#Grafana Labs Blog on Grafana Labs
Explore tagged Tumblr posts
Visit Tumblr Blog
Explore Tumblr blogs with no restrictions, modern design and the best experience.
Last Seen Tumblr Blogs


Fun Fact
US Tumblr user growth rate is estimated to slow down to 4.1%.
Photo
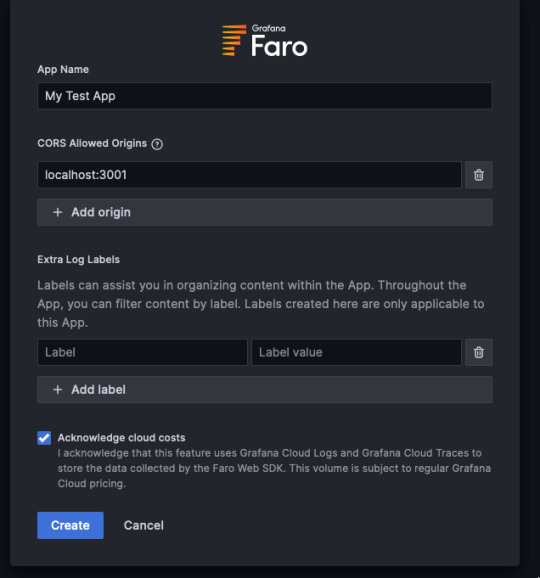
How to use the Grafana Faro Web SDK with Grafana Cloud Frontend Observability to gain additional app insights Frontend observability (or real user monitoring) is a critical, yet often overlooked, part of systems monitoring. Website and mobile app frontends are just as complex, if not more so, than the backend systems observability teams typically prioritize. They also represent the first interaction users have with our applications — so it’s important to have full visibility into that experience. Additionally, having that visibility and being able to correlate page timings and errors on the frontend can save you time when troubleshooting backend issues. Making these correlations, however, isn’t possible if you deploy an application using a managed service. For example, if you are an online retailer and use a third-party e-commerce platform for the frontend of your storefront app, you don’t have access to the backend infrastructure and applications to pull metrics from. Fortunately, you can install Grafana Faro, the open source frontend JavaScript agent, to get page speed timings, errors, and other types of rich data to make sure your site is performing optimally. Why use Grafana Faro and Grafana Cloud Frontend Observability to collect custom metrics? One of the best parts of using Faro and Grafana Cloud Frontend Observability, our hosted service for real user monitoring, is not just the quick setup time, but the flexibility it provides in collecting custom metrics, events, and logs. Incorporating custom events and metrics into Frontend Observability with Faro enables you to: Query this data however you like, alongside any other metrics Collect business data from the “source�� without having to wait for business intelligence (BI) tools to run Collect additional metrics when using a managed service Correlate user browser session data to business metrics We are going to explore how these capabilities can be applied to an e-commerce application to get more insights into user activity on top of the automatically collected metrics from the Grafana Faro Web SDK. In this tutorial you will: Deploy a basic web application Install the Faro Web SDK Observe the automatically collected metrics inside Grafana Cloud Frontend Observability View custom-implemented session data and events with Grafana Cloud Logs For this exercise, you will need a Grafana Cloud account. You’ll also need to have a basic understanding of: Web development (specifically, HTML and JavaScript) Git Node and node package manager (NPM) Docker Grafana k6 (optional) (Note: For a deeper introduction to Grafana Cloud Frontend Observability, check out this blog post.) Step 1: Create a frontend application in Grafana Cloud First, in the Grafana Cloud UI, navigate to Home → Observability → Frontend. Then, select Create New App. Fill in the App Name and CORS Allowed Origins fields, as shown in the screenshot below. By default, the test app will run on localhost:3001, so add it as an Allowed Origin. You can also complete the Extra Log Labels field to identify your app later, when parsing logs in Grafana Cloud Logs, but it’s not required. By default, the app will have a label with the app name you assign, so you can identify it. Step 2: Run the application! Clone the repo from: https://github.com/mcove11/FaroCustomMetrics Follow the directions in GitHub to run the app; you’ll notice it’s very simple, consisting of only a few files. The repo also includes an option for running the app with Docker, as well as a k6 test script we can use, optionally, in the next step. Step 3: Add the Faro Web SDK and test In Grafana Cloud, navigate to the Web SDK Configuration page, as shown below. Select the tab CDN without Tracing and copy the contents from it. Open up farowebapp/public/views/index.html in your file editor and copy and paste the config into the https://grafana.com/blog/2023/09/07/how-to-use-the-grafana-faro-web-sdk-with-grafana-cloud-frontend-observability-to-gain-additional-app-insights/
0 notes
Text
Enterprise Kubernetes Storage with Red Hat OpenShift Data Foundation (DO370)
As organizations continue their journey into cloud-native and containerized applications, the need for robust, scalable, and persistent storage solutions has never been more critical. Red Hat OpenShift, a leading Kubernetes platform, addresses this need with Red Hat OpenShift Data Foundation (ODF)—an integrated, software-defined storage solution designed specifically for OpenShift environments.
In this blog post, we’ll explore how the DO370 course equips IT professionals to manage enterprise-grade Kubernetes storage using OpenShift Data Foundation.
What is OpenShift Data Foundation?
Red Hat OpenShift Data Foundation (formerly OpenShift Container Storage) is a unified and scalable storage solution built on Ceph, NooBaa, and Rook. It provides:
Block, file, and object storage
Persistent volumes for containers
Data protection, encryption, and replication
Multi-cloud and hybrid cloud support
ODF is deeply integrated with OpenShift, allowing for seamless deployment, management, and scaling of storage resources within Kubernetes workloads.
Why DO370?
The DO370: Enterprise Kubernetes Storage with Red Hat OpenShift Data Foundation course is designed for OpenShift administrators and storage specialists who want to gain hands-on expertise in deploying and managing ODF in enterprise environments.
Key Learning Outcomes:
Understand ODF Architecture Learn how ODF components work together to provide high availability and performance.
Deploy ODF on OpenShift Clusters Hands-on labs walk through setting up ODF in a variety of topologies, from internal mode (hyperconverged) to external Ceph clusters.
Provision Persistent Volumes Use Kubernetes StorageClasses and dynamic provisioning to provide storage for stateful applications.
Monitor and Troubleshoot Storage Issues Utilize tools like Prometheus, Grafana, and the OpenShift Console to monitor health and performance.
Data Resiliency and Disaster Recovery Configure mirroring, replication, and backup for critical workloads.
Manage Multi-cloud Object Storage Integrate NooBaa for managing object storage across AWS S3, Azure Blob, and more.
Enterprise Use Cases for ODF
Stateful Applications: Databases like PostgreSQL, MongoDB, and Cassandra running in OpenShift require reliable persistent storage.
AI/ML Workloads: High throughput and scalable storage for datasets and model checkpoints.
CI/CD Pipelines: Persistent storage for build artifacts, logs, and containers.
Data Protection: Built-in snapshot and backup capabilities for compliance and recovery.
Real-World Benefits
Simplicity: Unified management within OpenShift Console.
Flexibility: Run on-premises, in the cloud, or in hybrid configurations.
Security: Native encryption and role-based access control (RBAC).
Resiliency: Automatic healing and replication for data durability.
Who Should Take DO370?
OpenShift Administrators
Storage Engineers
DevOps Engineers managing persistent workloads
RHCSA/RHCE certified professionals looking to specialize in OpenShift storage
Prerequisite Skills: Familiarity with OpenShift (DO180/DO280) and basic Kubernetes concepts is highly recommended.
Final Thoughts
As containers become the standard for deploying applications, storage is no longer an afterthought—it's a cornerstone of enterprise Kubernetes strategy. Red Hat OpenShift Data Foundation ensures your applications are backed by scalable, secure, and resilient storage.
Whether you're modernizing legacy workloads or building cloud-native applications, DO370 is your gateway to mastering Kubernetes-native storage with Red Hat.
Interested in Learning More?
📘 Join HawkStack Technologies for instructor-led or self-paced training on DO370 and other Red Hat courses.
Visit our website for more details - www.hawkstack.com
0 notes
Text
Istio Service Mesh Essentials: Simplifying Microservices Management
In today's cloud-native world, microservices architecture has become a standard for building scalable and resilient applications. However, managing the interactions between these microservices introduces challenges such as traffic control, security, and observability. This is where Istio Service Mesh shines.
Istio is a powerful, open-source service mesh platform that addresses these challenges, providing seamless traffic management, enhanced security, and robust observability for microservices. This blog post will dive into the essentials of Istio Service Mesh and explore how it simplifies microservices management, complete with hands-on insights.
What is a Service Mesh?
A service mesh is a dedicated infrastructure layer that facilitates secure, fast, and reliable communication between microservices. It decouples service-to-service communication concerns like routing, load balancing, and security from the application code, enabling developers to focus on business logic.
Istio is one of the most popular service meshes, offering a rich set of features to empower developers and operations teams.
Key Features of Istio Service Mesh
1. Traffic Management
Istio enables dynamic traffic routing and load balancing between services, ensuring optimal performance and reliability. Key traffic management features include:
Intelligent Routing: Use fine-grained traffic control policies for canary deployments, blue-green deployments, and A/B testing.
Load Balancing: Automatically distribute requests across multiple service instances.
Retries and Timeouts: Improve resilience by defining retry policies and request timeouts.
2. Enhanced Security
Security is a cornerstone of Istio, providing built-in features like:
Mutual TLS (mTLS): Encrypt service-to-service communication.
Authentication and Authorization: Define access policies using identity-based and attribute-based rules.
Secure Gateways: Secure ingress and egress traffic with gateways.
3. Observability
Monitoring microservices can be daunting, but Istio offers powerful observability tools:
Telemetry and Metrics: Gain insights into service performance with Prometheus and Grafana integrations.
Distributed Tracing: Trace requests across multiple services using tools like Jaeger or Zipkin.
Service Visualization: Use tools like Kiali to visualize service interactions.
Hands-On with Istio: Setting Up Your Service Mesh
Here’s a quick overview of setting up and using Istio in a Kubernetes environment:
Step 1: Install Istio
Download the Istio CLI (istioctl) and install Istio in your Kubernetes cluster.
Deploy the Istio control plane components, including Pilot, Mixer, and Envoy proxies.
Step 2: Enable Your Services for Istio
Inject Istio's Envoy sidecar proxy into your service pods.
Configure Istio Gateway and VirtualService resources for external traffic management.
Step 3: Define Traffic Rules
Create routing rules for advanced traffic management scenarios.
Test mTLS to secure inter-service communication.
Step 4: Monitor with Observability Tools
Use built-in telemetry to monitor service health.
Visualize the mesh topology with Kiali for better debugging and analysis.
Why Istio Matters for Your Microservices
Istio abstracts complex network-level tasks, enabling your teams to:
Save Time: Automate communication patterns without touching the application code.
Enhance Security: Protect your services with minimal effort.
Improve Performance: Leverage intelligent routing and load balancing.
Gain Insights: Monitor and debug your microservices with ease.
Conclusion
Mastering Istio Service Mesh Essentials opens up new possibilities for managing microservices effectively. By implementing Istio, organizations can ensure their applications are secure, resilient, and performant.
Ready to dive deeper? Explore Istio hands-on labs to experience its features in action. Simplify your microservices management journey with Istio Service Mesh!
Explore More with HawkStack
Interested in modern microservices solutions? HawkStack Technologies offers expert DevOps tools and support, including Istio and other cloud-native services. Reach out today to transform your microservices infrastructure! For more details - www.hawkstack.com
#redhatcourses#information technology#containerorchestration#kubernetes#docker#containersecurity#container#linux#aws#hawkstack#hawkstack technologies
0 notes
Text
How the Demand for DevOps Professionals is Exponentially Increasing

In today’s fast-paced technology landscape, the demand for DevOps professionals is skyrocketing. As businesses strive for greater efficiency, faster deployment, and improved collaboration, the role of DevOps has become crucial. This blog explores why the demand for DevOps professionals is exponentially increasing and how enrolling in a DevOps course in Mumbai can be your ticket to a successful career in this field.
The Rise of DevOps
What is DevOps?
DevOps is a set of practices that combines software development (Dev) and IT operations (Ops). The goal is to shorten the development lifecycle and provide continuous delivery with high software quality. This approach fosters a culture of collaboration between development and operations teams, leading to more efficient workflows and quicker product releases.
Why is Demand Growing?
Increased Need for Speed: Businesses are under pressure to deliver updates and new features rapidly. DevOps methodologies enable faster software development and deployment, making organizations more competitive.
Enhanced Collaboration: DevOps breaks down silos between teams, promoting better communication and collaboration. Companies are realizing that this integrated approach improves overall productivity.
Adoption of Cloud Technologies: As organizations migrate to the cloud, the need for professionals who understand both development and operational aspects of cloud environments is rising. DevOps professionals are key in managing these transitions effectively.
Focus on Automation: Automation is a core component of DevOps. The demand for professionals skilled in automation tools and practices is increasing, as organizations seek to minimize manual errors and optimize processes.
The Skill Set of a DevOps Professional
To succeed in the field of DevOps, certain skills are essential:
Continuous Integration/Continuous Deployment (CI/CD): Proficiency in CI/CD tools is critical for automating the software release process.
Cloud Computing: Understanding cloud platforms (AWS, Azure, Google Cloud) is crucial for managing and deploying applications in cloud environments.
Scripting and Automation: Knowledge of scripting languages (Python, Bash) and automation tools (Ansible, Puppet) is important for streamlining processes.
Monitoring and Logging: Familiarity with monitoring tools (Nagios, Grafana) to track application performance and troubleshoot issues is vital.
Collaboration Tools: Proficiency in tools like Slack, Jira, and Trello facilitates effective communication among teams.
Why Enroll in a DevOps Course in Mumbai?
Advantages of Taking a DevOps Course in Mumbai
Structured Learning: A DevOps course in Mumbai provides a structured curriculum that covers essential concepts, tools, and practices in depth.
Hands-On Experience: Many courses offer practical labs and projects, allowing you to apply your knowledge in real-world scenarios.
Networking Opportunities: Studying in Mumbai gives you access to a vibrant tech community and potential networking opportunities with industry professionals.
Career Advancement: Completing a DevOps course enhances your resume and makes you a more attractive candidate for employers in this high-demand field.
Future Outlook for DevOps Professionals
The future looks bright for DevOps professionals. As more organizations adopt DevOps practices, the demand for skilled individuals will continue to grow making and this is where DevOps Course in Mumbai plays a major role. Companies are increasingly recognizing the value of DevOps in achieving business goals, leading to a more significant investment in training and hiring.
In addition, emerging technologies such as artificial intelligence and machine learning are starting to intersect with DevOps practices. Professionals who can bridge these areas will be even more sought after, creating new opportunities for career advancement.
Conclusion
The demand for DevOps professionals is increasing at an unprecedented rate as businesses strive for greater efficiency, speed, and collaboration. By enrolling in a DevOps course in Mumbai, you can acquire the skills and knowledge needed to excel in this thriving field.
#cloud computing#cloudcomputing#cloud storage#cloud data#cloudsecurity#devops#devops course#devops training#devops certification#cloud computing course#technology
0 notes
Text
Machine learning blog posts | Grafana Labs
https://grafana.com/tags/machine-learning/ Enviado do meu telemóvel HONOR
View On WordPress
0 notes
Text
Grafana Labs launches free incident management tool in Grafana Cloud
https://grafana.com/blog/2022/09/13/grafana-incident-for-incident-management-is-now-generally-available-in-grafana-cloud/ Comments
0 notes
Text
障害発生時に担当者へのオンコールを自動化「Grafana OnCall」がオープンソースで公開
クラウド対応のログ可視化ツールとして知られる「Grafana」や監視システム「Prometheus」などを開発し提供するGrafana Labsは、障害発生時に担当者へのオンコールを自動化できるオンコールマネジメントソフトウェア「Grafa... https://www.publickey1.jp/blog/22/grafana_oncall.html?utm_source=dlvr.it&utm_medium=tumblr Publickey
0 notes
Link
Article URL: https://grafana.com/blog/2020/01/09/introducing-tanka-our-way-of-deploying-to-kubernetes/
Comments URL: https://news.ycombinator.com/item?id=22011251
Points: 11
# Comments: 3
0 notes
Text
Grafana Labs nabs $24M Series A for open source-based data analytics stack
For More Visit : Read More Best Tech Blog : Tech-on-news.blogspot.com
http://teznewsreport.blogspot.com/2019/10/grafana-labs-nabs-24m-series-for-open.html
0 notes
Text
0 notes
Link
via grafana.com
There are countless Grafana dashboards that will only ever be seen internally. But there are also a number of large organizations that have made their dashboards public for a variety of uses. These dashboards can be interesting to browse, giving you an insider’s peek into how real Grafana users set up their visualizations, with actual live data to boot.
Perhaps some of them will inspire you to get to work on your own Grafana?
GitLab
GitLab is a famously transparent company. They’ve even live streamed internal outages in the past. So it’s not surprising that they’d make a bunch of their internal Grafana dashboards for their cloud infrastructure public. The GitLab Dashboard offers graphs on everything from disk stats to fleet overviews, to alert reporting and triage.
Wikimedia
As one of the most popular sites on the Internet, Wikipedia operates at a truly incredible scale. The foundation behind the site exposes its Wikimedia Metrics via Grafana dashboards. The dashboards range from a global datacenter overview to API request rates. Be sure to adjust your eyes for some of their mind-bogglingly high numbers.
Cloud Native Computing Foundation
CNCF’s DevStats tool provides analysis of GitHub activity for Kubernetes and the other CNCF projects. Dashboards track a multitude of metrics, including the number of contributions, the level of engagement of contributors, how long it takes to get a response after an issue is opened, and which special interest groups (SIGs) are the most responsive. Grafana Labs is a member of the CNCF, and while we provided some help in getting DevStats up and running, the CNCF has put a lot of effort into this open source tool. It’s impressive to see what they’ve accomplished.
Grid Computing Centre Karlsruhe
GridKa, which is the home to the Large Hadron Collider, visualizes its data with a public GridKa Grafana that tracks everything from cluster utilization to system metrics for its experiments. Grafana powering science.
CERN
The European Organization for Nuclear Research operates the largest physics laboratory in the world. You can find more details about the experiments that members are doing at the Large Hadron Collider and other facilities on this public Grafana. Note those are tens of Gigabits per second they’re talking about.
Zabbix Plugin
There’s a Grafana plugin for the Zabbix open source network monitoring system that’s maintained by one of our Grafana Labs team members, Alexander Zobnin, and his play site provides a good demo of how the plugin works.
OGC SensorThings Plugin
This is a demo site for a plugin for the open source framework for interconnecting IoT. The example shown here is live tracking of a shuttle bus.
Hiveeyes Project
The open source Hiveeyes Project is developing a flexible beehive monitoring infrastructure platform. This public Grafana visualizes weather in Germany.
Percona
The Percona demo site offers examples of its Percona Monitoring and Management dashboard. It’s an open source platform that provides time-based analysis to ensure that your data works as efficiently as possible.
Grafana
And of course there’s the Grafana Play dashboard. This is one of the original public Grafana instances, hosted by Grafana Labs. It has served multiple purposes. First, it’s a demo site for people to get introduced to the various features and capabilities of Grafana. We also use it as a way to test issues or fixes, or demonstrate particular features.
0 notes
Text
Best Practices for Red Hat OpenShift and Why QCS DC Labs Training is Key
Introduction: In today's fast-paced digital landscape, businesses are increasingly turning to containerization to streamline their development and deployment processes. Red Hat OpenShift has emerged as a leading platform for managing containerized applications, offering a robust set of tools and features for orchestrating, scaling, and securing containerized workloads. However, to truly leverage the power of OpenShift and ensure optimal performance, it's essential to adhere to best practices. In this blog post, we'll explore some of the key best practices for Red Hat OpenShift and discuss why choosing QCS DC Labs for training can be instrumental in mastering this powerful platform.
Best Practices for Red Hat OpenShift:
Proper Resource Allocation: One of the fundamental principles of optimizing OpenShift deployments is to ensure proper resource allocation. This involves accurately estimating the resource requirements of your applications and provisioning the appropriate amount of CPU, memory, and storage resources to avoid under-provisioning or over-provisioning.
Utilizing Persistent Storage: In many cases, applications deployed on OpenShift require access to persistent storage for storing data. It's essential to leverage OpenShift's persistent volume framework to provision and manage persistent storage resources efficiently, ensuring data durability and availability.
Implementing Security Controls: Security should be a top priority when deploying applications on OpenShift. Utilize OpenShift's built-in security features such as Role-Based Access Control (RBAC), Pod Security Policies (PSP), Network Policies, and Image Scanning to enforce least privilege access, restrict network traffic, and ensure the integrity of container images.
Monitoring and Logging: Effective monitoring and logging are essential for maintaining the health and performance of applications running on OpenShift. Configure monitoring tools like Prometheus and Grafana to collect and visualize metrics, set up centralized logging with tools like Elasticsearch and Fluentd to capture and analyze logs, and implement alerting mechanisms to promptly respond to issues.
Implementing CI/CD Pipelines: Embrace Continuous Integration and Continuous Delivery (CI/CD) practices to automate the deployment pipeline and streamline the release process. Utilize tools like Jenkins, GitLab CI, or Tekton to create CI/CD pipelines that automate building, testing, and deploying applications on OpenShift.
Why Choose QCS DC Labs for Training: QCS DC Labs stands out as a premier training provider for Red Hat OpenShift, offering comprehensive courses tailored to meet the needs of both beginners and experienced professionals. Here's why choosing QCS DC Labs for training is essential:
Expert Instructors: QCS DC Labs instructors are industry experts with extensive experience in deploying and managing containerized applications on OpenShift. They provide practical insights, real-world examples, and hands-on guidance to help participants master the intricacies of the platform.
Hands-on Labs: QCS DC Labs courses feature hands-on lab exercises that allow participants to apply theoretical concepts in a simulated environment. These labs provide invaluable hands-on experience, enabling participants to gain confidence and proficiency in working with OpenShift.
Comprehensive Curriculum: QCS DC Labs offers a comprehensive curriculum covering all aspects of Red Hat OpenShift, from basic concepts to advanced topics. Participants gain a deep understanding of OpenShift's architecture, features, best practices, and real-world use cases through structured lessons and practical exercises.
Flexibility and Convenience: QCS DC Labs offers flexible training options, including online, instructor-led courses, self-paced learning modules, and customized training programs tailored to meet specific organizational needs. Participants can choose the format that best suits their schedule and learning preferences.
Conclusion: Red Hat OpenShift offers a powerful platform for deploying and managing containerized applications, but maximizing its potential requires adherence to best practices. By following best practices such as proper resource allocation, security controls, monitoring, and CI/CD implementation, organizations can ensure the efficiency, reliability, and security of their OpenShift deployments. Additionally, choosing QCS DC Labs for training provides participants with the knowledge, skills, and hands-on experience needed to become proficient in deploying and managing applications on Red Hat OpenShift.
For more details click www.qcsdclabs.com

#redhatcourses#redhatlinux#linux#qcsdclabs#openshift#docker#kubernetes#containersecurity#containerorchestration#container
0 notes
Text
How we're using gossip to improve Cortex and Loki availability | Grafana Labs
https://grafana.com/blog/2020/03/25/how-were-using-gossip-to-improve-cortex-and-loki-availability/ Enviado do meu iPad
View On WordPress
0 notes
Text
Tanka – Kubernetes Deployment System by Grafana Labs
https://grafana.com/blog/2020/01/09/introducing-tanka-our-way-of-deploying-to-kubernetes/ Comments
0 notes
Text
How we're using gossip to improve Cortex and Loki availability | Grafana Labs
https://grafana.com/blog/2020/03/25/how-were-using-gossip-to-improve-cortex-and-loki-availability/ Enviado do meu iPad
View On WordPress
0 notes
Text
Grafana Labs raises $24m to build open and composable observability platform
https://grafana.com/blog/2019/10/24/what-24-million-means-for-our-open-source-community/ Comments
0 notes