#JSONPath
Explore tagged Tumblr posts
Visit Tumblr Blog
Explore Tumblr blogs with no restrictions, modern design and the best experience.
Last Seen Tumblr Blogs


Fun Fact
28.6 is the average number of monthly visits per US mobile user.
Text
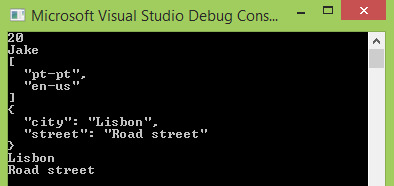
C#: JSONPath
How to apply JSONPath expressions in C#, using the Json.net library.
Introduction In this tutorial we will learn how to apply JSONPath expressions in C#, using the Json.net library. Continue reading C#: JSONPath

View On WordPress
1 note
·
View note
Text
Monitoring Kubernetes Clusters with Prometheus and Grafana
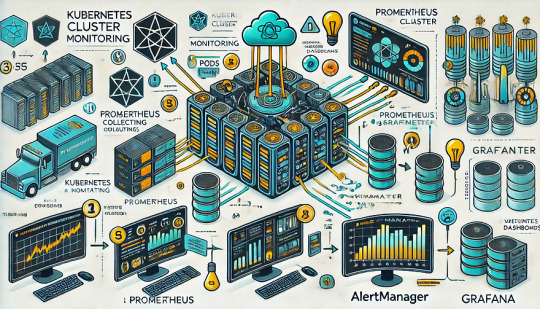
Introduction
Kubernetes is a powerful container orchestration platform, but monitoring it is crucial for ensuring reliability, performance, and scalability.
Prometheus and Grafana are two of the most popular open-source tools for monitoring and visualizing Kubernetes clusters.
In this guide, we’ll walk you through setting up Prometheus and Grafana on Kubernetes and configuring dashboards for real-time insights.
Why Use Prometheus and Grafana for Kubernetes Monitoring?
Prometheus: The Monitoring Backbone
Collects metrics from Kubernetes nodes, pods, and applications.
Uses a powerful query language (PromQL) for analyzing data.
Supports alerting based on predefined conditions.
Grafana: The Visualization Tool
Provides rich dashboards with graphs and metrics.
Allows integration with multiple data sources (e.g., Prometheus, Loki, Elasticsearch).
Enables alerting and notification management.
Step 1: Installing Prometheus and Grafana on Kubernetes
Prerequisites
Before starting, ensure you have:
A running Kubernetes cluster
kubectl and Helm installed
1. Add the Prometheus Helm Chart Repository
Helm makes it easy to deploy Prometheus and Grafana using predefined configurations.shhelm repo add prometheus-community https://prometheus-community.github.io/helm-charts helm repo update
2. Install Prometheus and Grafana Using Helm
shhelm install prometheus prometheus-community/kube-prometheus-stack --namespace monitoring --create-namespace
This command installs: ✅ Prometheus — For collecting metrics ✅ Grafana — For visualization ✅ Alertmanager — For notifications ✅ Node-exporter — To collect system-level metrics
Step 2: Accessing Prometheus and Grafana
Once deployed, we need to access the Prometheus and Grafana web interfaces.
1. Accessing Prometheus
Check the Prometheus service:shkubectl get svc -n monitoring
Forward the Prometheus server port:shkubectl port-forward svc/prometheus-kube-prometheus-prometheus 9090 -n monitoring
Now, open http://localhost:9090 in your browser.
2. Accessing Grafana
Retrieve the Grafana admin password:shkubectl get secret --namespace monitoring prometheus-grafana -o jsonpath="{.data.admin-password}" | base64 --decodeForward the Grafana service port:shkubectl port-forward svc/prometheus-grafana 3000:80 -n monitoring
Open http://localhost:3000, and log in with:
Username: admin
Password: (obtained from the previous command)
Step 3: Configuring Prometheus as a Data Source in Grafana
Open Grafana and navigate to Configuration > Data Sources.
Click Add data source and select Prometheus.
Set the URL to:
sh
http://prometheus-kube-prometheus-prometheus.monitoring.svc.cluster.local:9090
Click Save & Test to verify the connection.
Step 4: Importing Kubernetes Dashboards into Grafana
Grafana provides ready-made dashboards for Kubernetes monitoring.
Go to Dashboards > Import.
Enter a dashboard ID from Grafana’s dashboard repository.
Example: Use 3119 for Kubernetes cluster monitoring.
Select Prometheus as the data source and click Import.
You’ll now have a real-time Kubernetes monitoring dashboard! 🎯
Step 5: Setting Up Alerts in Prometheus and Grafana
Creating Prometheus Alerting Rules
Create a ConfigMap for alerts:yamlapiVersion: v1 kind: ConfigMap metadata: name: alert-rules namespace: monitoring data: alert.rules: | groups: - name: InstanceDown rules: - alert: InstanceDown expr: up == 0 for: 5m labels: severity: critical annotations: summary: "Instance {{ $labels.instance }} is down"
Apply it to the cluster:shkubectl apply -f alert-rules.yaml
Configuring Grafana Alerts
Navigate to Alerting > Notification Channels.
Set up a channel (Email, Slack, or PagerDuty).
Define alert rules based on metrics from Prometheus.
Step 6: Enabling Persistent Storage for Prometheus
By default, Prometheus stores data in memory. To make the data persistent, configure storage:
Modify the Helm values:yamlprometheus: server: persistentVolume: enabled: true size: 10Gi
Apply the changes:shhelm upgrade prometheus prometheus-community/kube-prometheus-stack -f values.yaml
Conclusion
In this guide, we’ve set up Prometheus and Grafana to monitor a Kubernetes cluster. You now have: ✅ Real-time dashboards in Grafana ✅ Prometheus alerts to detect failures ✅ Persistent storage for historical metrics
WEBSITE: https://www.ficusoft.in/devops-training-in-chennai/
0 notes
Text
Kubernetes - Prometheus & Grafana
Introduction
Kubernetes is a powerful orchestration tool for containerized applications, but monitoring its health and performance is crucial for maintaining reliability. This is where Prometheus and Grafana come into play. Prometheus is a robust monitoring system that collects and stores time-series data, while Grafana provides rich visualization capabilities, making it easier to analyze metrics and spot issues.
In this post, we will explore how Prometheus and Grafana work together to monitor Kubernetes clusters, ensuring optimal performance and stability.
Why Use Prometheus and Grafana for Kubernetes Monitoring?
1. Prometheus - The Monitoring Powerhouse
Prometheus is widely used in Kubernetes environments due to its powerful features:
Time-series database: Efficiently stores metrics in a multi-dimensional format.
Kubernetes-native integration: Seamless discovery of pods, nodes, and services.
Powerful querying with PromQL: Enables complex queries to extract meaningful insights.
Alerting system: Supports rule-based alerts via Alertmanager.
2. Grafana - The Visualization Layer
Grafana transforms raw metrics from Prometheus into insightful dashboards:
Customizable dashboards: Tailor views to highlight key performance indicators.
Multi-source support: Can integrate data from multiple sources alongside Prometheus.
Alerting & notifications: Get notified about critical issues via various channels.
Setting Up Prometheus & Grafana in Kubernetes
1. Deploy Prometheus
Using Helm, you can install Prometheus in your Kubernetes cluster:
helm repo add prometheus-community https://prometheus-community.github.io/helm-charts
helm repo update
helm install prometheus prometheus-community/kube-prometheus-stack
This will install Prometheus, Alertmanager, and related components.
2. Deploy Grafana
Grafana is included in the kube-prometheus-stack Helm chart, but if you want to install it separately:
helm install grafana grafana/grafana
After installation, retrieve the admin password and access Grafana:
kubectl get secret --namespace default grafana -o jsonpath="{.data.admin-password}" | base64 --decode
kubectl port-forward svc/grafana 3000:80
Access Grafana at http://localhost:3000 using the retrieved credentials.
3. Configure Prometheus as a Data Source
In Grafana:
Go to Configuration > Data Sources
Select Prometheus
Enter the Prometheus service URL (e.g., http://prometheus-server.default.svc.cluster.local:9090)
Click Save & Test
4. Import Kubernetes Dashboards
Grafana provides ready-made dashboards for Kubernetes. You can import dashboards by using community templates available on Grafana Dashboards.
Key Metrics to Monitor in Kubernetes
Some essential Kubernetes metrics to track using Prometheus and Grafana include:
Node Health: CPU, memory, disk usage
Pod & Container Performance: CPU and memory usage per pod
Kubernetes API Server Health: Request latency, error rates
Networking Metrics: Traffic in/out per pod, DNS resolution times
Custom Application Metrics: Business logic performance, request rates
Setting Up Alerts
Using Prometheus Alertmanager, you can configure alerts for critical conditions:
- alert: HighCPUUsage expr: avg(rate(container_cpu_usage_seconds_total[5m])) by (pod) > 0.8 for: 5m labels: severity: critical annotations: summary: "High CPU usage detected"Alerts can be sent via email, Slack, PagerDuty, and other integrations.
Conclusion Prometheus and Grafana provide a comprehensive monitoring and visualization solution for Kubernetes clusters. With the right setup, you can gain deep insights into your cluster’s performance, detect anomalies, and ensure high availability.
By integrating Prometheus' powerful data collection with Grafana’s intuitive dashboards, teams can efficiently manage and troubleshoot Kubernetes environments. Start monitoring today and take your Kubernetes operations to the next level!
For more details www.hawkstack.com
0 notes
Text
Ultimate YAML Course: YAML JSON JSONPath Zero

In the world of data processing, YAML, JSON, and JSONPath play crucial roles in simplifying data structuring and access. If you're looking to master these essential technologies, the Ultimate YAML Course: YAML JSON JSONPath Zero is the perfect place to begin your journey.
In this blog, we will take an in-depth look at these technologies, their significance in modern development, and why this course can help you gain a competitive edge. This article is crafted with top-performing keywords from SERP, Google Trends, and Google Keyword Planner to enhance its SEO performance.
What is YAML?
YAML (YAML Ain't Markup Language) is a human-readable data serialization standard. It is widely used for configuration files and data interchange between different applications. YAML is popular because of its simplicity and ease of reading, which makes it ideal for applications like Kubernetes, Ansible, and other configuration management tools.
Why YAML is Important?
YAML is preferred over JSON and XML for configuration files due to its clean and minimalistic structure. As an aspiring developer or DevOps engineer, understanding YAML is essential because it’s used in popular technologies such as Docker, Kubernetes, and CI/CD pipelines.
Key features of YAML:
Human-readable format
Supports complex data structures (lists, maps)
Minimal syntax with indentation-based structure
To master these skills, the Ultimate YAML Course: YAML JSON JSONPath Zero can be the stepping stone towards a proficient understanding of YAML.
What is JSON?
JSON (JavaScript Object Notation) is a lightweight data format that is easy to read and write for humans and simple to parse and generate for machines. It’s an essential skill for developers, especially those working with web applications and APIs.
Why JSON is Important?
JSON is omnipresent in the tech ecosystem. It is the standard format for data exchange between web clients and servers, especially in REST APIs. Whether you’re building front-end web applications, back-end services, or working with APIs, you’ll come across JSON.
Key features of JSON:
Text format that is language-independent
Easily readable and writable
Frequently used in APIs for data transfer
In the Ultimate YAML Course: YAML JSON JSONPath Zero, you’ll gain a solid understanding of JSON’s fundamentals, allowing you to work effectively with various data sources.
What is JSONPath?
JSONPath is a query language for JSON, much like XPath is for XML. It allows you to extract specific data from JSON structures using path-like syntax. JSONPath is powerful because it simplifies the process of navigating through complex JSON data.
Why JSONPath is Important?
In scenarios where JSON is the primary format for data exchange, JSONPath simplifies the process of retrieving and manipulating data. For example, in APIs, databases, and cloud services that use JSON, JSONPath can streamline data extraction.
Key features of JSONPath:
Querying nested JSON data
Supports conditional expressions
Allows for easy data extraction from JSON
The Ultimate YAML Course: YAML JSON JSONPath Zero covers JSONPath in detail, ensuring you gain the skills necessary to manipulate JSON data with precision.
Who Should Take the Ultimate YAML Course?
The Ultimate YAML Course: YAML JSON JSONPath Zero is perfect for:
Developers looking to expand their knowledge of data serialization.
DevOps engineers working with tools like Kubernetes and Ansible.
Data engineers who need to process JSON data in ETL pipelines.
API developers who want to master JSON for seamless client-server communication.
System administrators who frequently deal with configuration files written in YAML.
What You Will Learn in the Ultimate YAML Course
This course provides a comprehensive overview of YAML, JSON, and JSONPath, starting from the basics and advancing to more complex topics. Below are the key concepts covered in the Ultimate YAML Course: YAML JSON JSONPath Zero:
1. YAML Fundamentals
Introduction to YAML syntax
Writing YAML configuration files
YAML best practices
Converting data between YAML, JSON, and XML
2. JSON Mastery
Understanding JSON syntax
Parsing and generating JSON data in various programming languages
Working with REST APIs and handling JSON responses
Converting YAML to JSON and vice versa
3. Mastering JSONPath
Introduction to JSONPath expressions
Writing queries to extract data from complex JSON
Real-world applications of JSONPath in data analysis and API development
Integrating JSONPath with JavaScript, Python, and other languages
Top Use Cases of YAML, JSON, and JSONPath
Kubernetes Configuration Management YAML is the de facto standard for writing configuration files in Kubernetes. Understanding YAML is crucial for deploying applications, managing clusters, and configuring services in Kubernetes.
Web APIs with JSON JSON is widely used in web APIs for exchanging data between the client and server. Mastering JSON enables developers to build efficient API endpoints that can process and return structured data.
Automating Tasks with JSONPath JSONPath simplifies the process of querying JSON data, making it essential for developers working with complex datasets in APIs, databases, or data pipelines.
Why Choose the Ultimate YAML Course?
With the growing importance of YAML, JSON, and JSONPath in modern development workflows, mastering these tools can significantly enhance your career prospects. Whether you’re an aspiring DevOps engineer, a backend developer, or a system administrator, understanding how to work with structured data is crucial.
In the Ultimate YAML Course: YAML JSON JSONPath Zero, you’ll gain practical, hands-on experience with real-world use cases that you can apply immediately in your job. The course is designed for beginners, so no prior experience is required.
Why This Course Stands Out?
Comprehensive Coverage: From YAML syntax to JSONPath queries, the course provides an all-inclusive guide.
Practical Applications: Learn how YAML, JSON, and JSONPath are used in tools like Kubernetes, APIs, and automation scripts.
Up-to-date Content: The course includes modern use cases and integrates the latest trends in DevOps, API development, and cloud computing.
Final Thoughts: Why You Should Enroll in the Ultimate YAML Course
Whether you're just starting your development journey or are looking to enhance your DevOps skills, the Ultimate YAML Course: YAML JSON JSONPath Zero will equip you with the tools to handle structured data efficiently. You'll walk away from this course with a thorough understanding of YAML, JSON, and JSONPath, as well as practical skills that can be applied immediately in your job.
Take the next step in your career by mastering these essential technologies with the Ultimate YAML Course: YAML JSON JSONPath Zero. The demand for these skills is only increasing, and by enrolling today, you’ll be ahead of the curve.
Start learning today and transform your ability to manage and manipulate data!
0 notes
Text
Using Postman: Leveraging Response Data For Seamless API Requests

As a developer, you may often encounter scenarios where you need to send a request to an API endpoint and use the response from that request as input for subsequent requests. Manually copying and pasting the response data into the next request can be time-consuming and error-prone. That’s where tools like postman use response in next request come in handy. Postman allows you to automate this process by using the response of one request in the next request, ensuring a smooth and efficient workflow.
In this article, we will explore how to use the response of a request in the next request using Postman. We’ll cover the various ways you can obtain the response data from a request and utilize it in subsequent requests.
To begin, let’s assume we have an API with two endpoints: 1. `/authenticate` — This endpoint accepts a username and password, and upon successful authentication, returns a token.
2. `/user` — This endpoint requires a valid token to fetch user details.
Our goal is to authenticate a user and then retrieve their details using the token obtained from the authentication process.
Setting up the authentication endpoint First, we need to set up the `/authenticate` endpoint in Postman. Create a new request, specify the HTTP method as `POST`, and set the request URL to the appropriate endpoint URL.
Next, we need to provide the username and password in the request body. You can do this by selecting the `Body` tab in Postman, choosing the `raw` option, and specifying the request body in JSON format. Here’s an example:
{
“username”: “your_username”,
“password”: “your_password”
}
Send the request and verify that you receive a response with a token. Now, let’s move on to using this token in the next request.
Using response data in the next request Postman offers several ways to access and use the response data from a previous request. We’ll explore two commonly used methods: variables and response body extraction.
Using variables Variables in Postman act as placeholders for dynamic data that can be used across requests. To access the response data from a previous request, we need to define a variable and assign it the required value.
To define a variable in Postman, go to the `Tests` tab of the request that provides the response we want to use. In the response handler, you can extract the relevant data and assign it to the variable using the `pm.variables.set()` method. For example, to assign the token value to a variable called `authToken`, you can use the following code snippet:
const responseJson = pm.response.json();
pm.variables.set(“authToken”, responseJson.token);
With the variable defined, we can now use it in subsequent requests by enclosing its name in double curly braces, like `{{authToken}}`. In our case, we’ll pass this token as an authorization header in the `/user` request.
To add the authorization header, go to the `Headers` tab of the `/user` request in Postman. Add the header as `Authorization: Bearer {{authToken}}`, where `{{authToken}}` references the variable we defined earlier.
Now, when you send the `/user` request, Postman will replace `{{authToken}}` with the actual value stored in the `authToken` variable.
Response body extraction In some cases, you might want to extract specific values from the response body and use them in subsequent requests. Postman provides a flexible solution for this scenario through the use of `JSONPath` and `XPath` expressions.
To extract a value from the response body, go to the `Tests` tab of the request that provides the desired response. You can access the response body using `pm.response.json()` or `pm.response.text()` depending on the content type.
Once you have the response body, you can use either `pm.variables.set()` to define a variable with the extracted value, or directly assign the value to an environment or global variable using `pm.environment.set()` or `pm.globals.set()` respectively.
Here’s an example of extracting the `userId` from the response body and setting it as an environment variable:
const responseJson = pm.response.json();
pm.environment.set(“userId”, responseJson.userId);
Now, you can reference the `userId` environment variable in subsequent requests using `{{userId}}`.
Conclusion In this article, we explored how to use the response of one request in the next request using Postman. We covered two common methods: using variables and extracting values from the response body.
Using variables allows us to store and reuse dynamic data across different requests, resulting in a more efficient and maintainable workflow. Additionally, extracting values from the response body provides flexibility when dealing with complex JSON objects or XML data structures.
Postman simplifies the process of automating requests and leveraging response data, making it an invaluable tool for API testing and development. By utilizing these techniques, you can enhance your testing and development processes and ensure smoother integration between different endpoints. However, it’s important to note that sometimes you might encounter issues such as Postman returning a postman 400 bad request error, indicating that the request you’re trying to send to the server is malformed or incorrect. When faced with this error, it’s essential to review the request parameters, headers, and body to ensure they meet the requirements of the API endpoint you’re targeting. Troubleshooting such errors in Postman can help in refining your API testing and development workflows, ultimately leading to more robust and reliable systems.
0 notes
Text
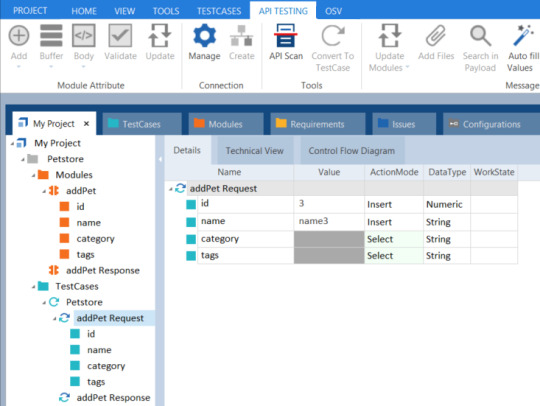
What is an API For Verification?
An api for verification allows developers to verify an API response's contents and determine if it is functioning as expected. This can be done using various methods, including string matching, regular expression, JsonPath, and XmlPath. These methods allow for highly-detailed examination of an API's response, which can be used to detect any errors that may occur during an API's operation.
Verification APIs automate multiple layers of identity verification checks, streamlining compliance workflows and reducing risk. They cross-reference identity documents against authoritative global databases, instantly flagging any inconsistencies or potential risks. This frees up human resources to focus on strategic business tasks, while keeping critical compliance workflows running smoothly.
Businesses that use a business verification API can quickly onboard new clients while ensuring the authenticity of their documents and minimizing fraud. This makes it possible for e-commerce platforms, digital marketplaces, and lending companies to grow their business while maintaining regulatory compliance.
For example, the Identity Verification for Custom Accounts API lets your platform report KYC information from your users to Stripe. This can be done by sending a request from your backend to Sinch using the Report Verification API. Then, Sinch will verify the provided information and ask for more when necessary. This helps your platform comply with Know Your Customer (KYC) requirements in jurisdictions where it is required. This is an alternative to requesting verification from your users through Connect. For more information, see the Identity Verification for Custom Accounts Guide.
youtube
"
SITES WE SUPPORT
Wordpress – Address verification API
SOCIAL LINKS
Facebook Twitter LinkedIn Instagram Pinterest
"
0 notes
Text
A Journey building a fast JSON parser and full JSONPath
https://github.com/ohler55/ojg/blob/develop/design.md
0 notes
Text
개발자를 위한 쿠버네티스 조셉 헥
1장. 개발을 위한 쿠버네티스 환경 설정 개발을 위한 필수 도구 추가 도구 로컬 환경에 쿠버네티스 클러스터 구성 및 실행 클러스터 재설정 및 재시작 미니큐브의 구성 요소 확인 도커 확인 도커 이미지 삭제와 정리 쿠버네티스 개념-컨테이너 쿠버네티스 리소스-팟 네임스페이스 팟과 컨테이너를 위한 코드 작성 쿠버네티스 리소스-노드 네트워크 컨트롤러 쿠버네티스 리소스-레플리카셋 쿠버네티스 리소스-디플로이먼트 쿠버네티스 리소스 표현 요약 2장. 쿠버네티스에서 코드 패키징 방법 컨테이너 이미지 컨테이너 레지스트리 컨테이너 만들기 도커파일 명령어 예제-Python/Flask 컨테이너 이미지 컨테이너 빌드하기 컨테이너 실행하기 애플리케이션으로부터 로그 얻기 예제-Node.js/Express 컨테이너 이미지 컨테이너 빌드하기 컨테이너 실행하기 애플리케이션으로부터 로그 얻기 컨테이너 이미지에 태그 달기 요약 3장. 쿠버네티스에서 코드와 상호작용 컨테이너 내부에서 실행되는 소프트웨어 개발을 위한 실용적인 팁 실행 가능한 코드를 위한 옵션 얻기 컨테이너 이미지 빌드를 위한 실용적인 팁 프로그램의 결과 전송 로그 하나 이상의 컨테이너로 구성된 팟 로그 스트리밍 이전 로그 확인 타임스탬프 디버깅 기법 대화형으로 이미지 배포하기 실행 중인 팟에 접속하기 컨테이너에서 두 번째 프로세스 실행하기 쿠버네티스 콘셉트 - 라벨 라벨의 구성 쿠버네티스 콘셉트 - 셀렉터 라벨 확인 kubectl 커맨드를 사용해 라벨과 함께 리소스 정보 목록화하기 자동 생성되는 라벨과 셀렉터 쿠버네티스 리소스 - 서비스 서비스 리소스 정의 엔드포인트 서비스 타입 - ExternalName 헤드리스 서비스 팟 내부에서 서비스 디스커버리하기 서비스를 위한 DNS 쿠버네티스 클러스터 외부로 서비스 노출하기 서비스 타입 - LoadBalancer 서비스 타입 - NodePort 미니큐브 서비스 예제 서비스 - 레디스 레디스 서비스 찾기 파이썬에서 레디스 사용하기 Flask 디플로이먼트 업데이트 디플로이먼트와 롤 아웃 롤 아웃 히스토리 롤 아웃 실행 취소 kubectl set 커맨드를 통한 업데이트 요약 4장. 선언형 인프라스트럭처 명령형 커맨드 대 선언형 커맨드 YAML 간단한 디플로이먼트 생성 첫 번째 애플리케이션 선언 이미지 풀 정책 추적 감시 쿠버네티스 리소스 - 어노테이션 팟에서 라벨과 어노테이션 노출하기 쿠버네티스 리소스 - 컨피그맵 컨피그맵 생성 컨피그맵 관리 컨테이너 이미지에 컨피그레이션 노출하기 컨피그맵의 디펜던시 쿠버네티스 리소스 - 시크릿 컨테이너에 시크릿 노출하기 시크릿과 보안 - 시크릿은 얼마나 안전한가? 예제 - 컨피그맵을 포함한 Python/Flask 디플로이먼트 부가 메뉴 - JSONPATH Python/Flask 내에서 컨피그맵 사용하기 요약 5장. 팟과 컨테이너의 라이프사이클 팟의 라이프사이클 컨테이너의 라이프사이클 디플로이먼트, 레플리카셋 그리고 팟 현재 상태 정보 얻기 프로브 활성 프로브 준비 프로브 파이썬 예제에 프로브 추가하기 Node.js 예제에 프로브 추가하기 컨테이너 라이프사이클 훅 초기화 컨테이너 빠른 대화형 테스트 우아한 종료 방법 파이썬에서 SIGTERM Node.js에서 SIGTERM 요약 6장. 쿠버네티스에서 백그라운드 프로세싱 잡 크론잡 파이썬과 셀러리를 이용한 워커큐 예제 셀러리 워커 예제 쿠버네티스에서 제공하는 퍼시스턴스 볼륨 퍼시스턴스 볼륨과 퍼시스턴스 볼륨 클레임 스테이트풀 세트 스테이트풀 세트를 활용한 Node.js 예제 사용자 정의 리소스 요약 7장. 모니터링과 메트릭 쿠버네티스의 빌트인 메트릭 쿠버네티스 콘셉트 - QoS 컨테이너에 대한 요청 및 한계값 선정 프로메테우스를 통한 메트릭 캡처 헬름 설치 헬름을 통한 프로메테우스 설치 프로메테우스를 통한 메트릭 보기 그라파나 설치 프로메테우스를 사용해 애플리케이션 메트릭 보기 프로메테우스를 통한 플라스크 메트릭 프로메테우스를 통한 Node.js 메트릭 프로메테우스에서 서비스 시그널 요약 8장. 로깅 및 추적 쿠버네티스 콘셉트 - 데몬셋 일래스틱서치, 플루언트디, 키바나 설치 및 활용 EFK를 활용한 로그 통합 키바나를 통한 로그 시각화 애플리케이션별 필터링 루씬 쿼리 언어 운영 환경에서 키바나 실행하기 예거를 활용한 분산 추적 스팬과 트레이스 예거의 분산 추적 아키텍처 예거 테스트하기 예제 - 애플리케이션에 추적 기능 추가하기 팟에 트레이싱 콜렉터 추가하기 트레이스 생성을 위한 라이브러리 및 코드 추가 추적 추가 시 고려 사항 요약 9장. 통합 테스팅 쿠버네티스를 활용한 테스팅 전략 테스팅에 필요한 리소스 검토 쿠버네티스를 활용한 테스팅 패턴 배츠를 통한 간단한 검증 예제 - 파이썬을 활용한 통합 테스트 파이테스트와 파이테스트-디펜던시 파이테스트 픽스처와 파이썬-쿠버네티스 클라이언트 상태 변경 대기 디플로이먼트에 액세스 예제 - Node.js를 활용한 통합 테스트 모카와 차이를 활용한 Node.js 테스트와 디펜던시 클러스터 상태 확인 kubectl을 활용한 배포 사용 가능한 팟이 될 때까지 대기하기 디플로이먼트와 상호작용 쿠버네티스를 활용한 지속적인 통합 예제 - Travis.CI와 미니큐브 사용하기 예제 - 젠킨스와 쿠버네티스 플러그인 사용하기 요약 10장. 일반적인 문제 트러블 슈팅 및 다음 단계 일반적인 에러와 해결 방법 데이터 유효성 검사 에러 ErrImagePull 에러 메시지 CrashLoopBackOff 에러 메시지 No endpoints available for service 에러 메시지 PodInitializing에서 멈춰 있는 경우 개발자를 위한 새로운 프로젝트 린터스 헬름 케이소넷 브리게이드 스카폴드 img 드래프트 ksync 텔레프레즌스 쿠버네티스 프로젝트와 상호작용하기 슬랙 유튜브 스택 오버플로우 메일링 리스트 및 포럼 요약
1 note
·
View note
Text
Open Sourcing our Kubernetes Tools
At Tumblr, we are avid fans of Kubernetes. We have been using Kubernetes for all manner of workloads, like critical-path web requests handling for tumblr.com, background task executions like sending queued posts and push notifications, and scheduled jobs for spam detection and content moderation. Throughout our journey to move our 11 year old (almost 12! 🎂) platform to a container-native architecture, we have made innumerable changes to how our applications are designed and run. Inspired by a lot of existing Kubernetes APIs and best practices, we're excited to share with the community some of the tools we've developed at Tumblr as our infrastructure has evolved to work with Kubernetes.
To help us integrate Kubernetes into our workflows, we have built a handful of tools of which we are open-sourcing three today! Each tool is a small, focused utility, designed to solve specific integration needs Tumblr had while migrating our workflows to Kubernetes. The tools were built to handle our needs internally, but we believe they are useful to the wider Kubernetes community.
github.com/tumblr/k8s-sidecar-injector
github.com/tumblr/k8s-config-projector
github.com/tumblr/k8s-secret-projector
k8s-sidecar-injector
Any company that has containerized an application as large and complex as Tumblr knows that it requires a tremendous amount of effort. Applications don't become container-native overnight, and sidecars can be useful to help emulate older deployments with colocated services on physical hosts or VMs. To reduce the amount of fragile copy-paste code by developers adding in sidecars to their Deployments and CronJobs, we created a service to dynamically inject sidecars, volumes, and environment data into pods as they are launched.
The k8s-sidecar-injector listens to the Kubernetes API for Pod launches that contain annotations requesting a specific sidecar to be injected. For example, the annotation injector.tumblr.com/request=sidecar-prod-v1 will add any environment variables, volumes, and containers defined in the sidecar-prod-v1 configuration. We use this to add sidecars like logging and metrics daemons, cluster-wide environment variables like DATACENTER and HTTP_PROXY settings, and volumes for shared configuration data. By centralizing configuration of sidecars, we were able to reduce complexity in CronJobs and Deployments by hundreds of lines, eliminated copy-paste errors, and made rolling out updates to shared components in our sidecars effortless.
An example sidecar ConfigMap is below, which adds a logging container, a volume from a logger-config ConfigMap, and some environment variables into the Pod.
--- apiVersion: v1 kind: ConfigMap metadata: name: example-sidecars namespace: kube-system labels app: k8s-sidecar-injector data: logger-v1: | name: logger-v1 containers: - name: logger image: some/logger:2.2.3 imagePullPolicy: IfNotPresent ports: - containerPort: 8888 volumeMounts: - name: logger-conf mountPath: /etc/logger volumes: - name: logger-conf configMap: name: logger-config env: - name: DATACENTER value: dc01 - name: HTTP_PROXY value: http://my-proxy.org:8080/ - name: HTTPS_PROXY value: http://my-proxy.org:8080/
This configuration will add the logger container into each pod with the annotation injector.tumblr.com/request: logger-v1, with a ConfigMap projected as a volume in /etc/logger. Additionally, every container in the Pod will get the DATACENTER=dc01 and HTTP_PROXY environment variables added, if they were not already set. This has allowed us to drastically reduce our boilerplate configuration when containerizing legacy applications that require a complex sidecar configuration.
k8s-config-projector
Internally, we have many types of configuration data that is needed by a variety of applications. We store canonical settings data like feature flags, lists of hosts/IPs+ports, and application settings in git. This allows automated generation/manipulation of these settings by bots, cron jobs, Collins, and humans alike. Applications want to know about some subset of this configuration data, and they want to be informed when this data changes as quickly as possible. Kubernetes provides the ConfigMap resource, which enables users to provide their service with configuration data and update the data in running pods without requiring a redeployment. We wanted to use this to configure our services and jobs in a Kubernetes-native manner, but needed a way to bridge the gap between our canonical configuration store (git repo of config files) to ConfigMaps. Thus, was k8s-config-projector born.
The Config Projector (github.com/tumblr/k8s-config-projector)[github.com/tumblr/k8s-config-projector] is a command line tool, meant to be run by CI processes. It combines a git repo hosting configuration data (feature flags, lists of hostnames+ports, application settings) with a set of "projection manifest" files that describe how to group/extract settings from the config repo and transmute them into ConfigMaps. The config projector allows developers to encode a set of configuration data the application needs to run into a projection manifest. As the configuration data changes in the git repository, CI will run the projector, projecting and deploying new ConfigMaps containing this updated data, without needing the application to be redeployed. Projection datasources can handle both structured and unstructured configuration files (YAML, JSON, and raw text/binary).
An example projection manifest is below, describing how a fictitious notification application could request some configuration data that may dynamically change (memcached hosts, log level, launch flags, etc):
--- name: notifications-us-east-1-production namespace: notification-production data: # extract some fields from JSON - source: generated/us-east-1/production/config.json output_file: config.json field_extraction: - memcached_hosts: $.memcached.notifications.production.hosts - settings: $.applications.notification.production.settings - datacenter: $.datacenter - environment: $.environment # extract a scalar value from a YAML - source: apps/us-east-1/production/notification.yaml output_file: launch_flags extract: $.launch_flags
After processing by the config projector, the following ConfigMap is generated, which can then be posted to a Kubernetes cluster with kubectl create -f <generatedfile>.
kind: ConfigMap apiVersion: v1 metadata name: notifications-us-east-1-production namespace: notification-production labels: tumblr.com/config-version: "1539778254" tumblr.com/managed-configmap: "true" data: config.json: | { "memcached_hosts": ["2.3.4.5:11211","4.5.6.7:11211","6.7.8.9:11211"], "settings": { "debug": false, "buffer": "2000", "flavor": "out of control", "log_level": "INFO", }, "datacenter": "us-east-1", "environment": "production" } launch_flags: "-Xmx5g -Dsun.net.inetaddr.ttl=10"
With this tool, we have enabled our applications running in kubernetes to receive dynamic configuration updates without requiring container rebuilds or deployments. More examples can be found here.
k8s-secret-projector
Similar to our configuration repository, we store secure credentials in access controlled vaults, divided by production levels. We wanted to enable developers to request access to subsets of credentials for a given application without needing to grant the user access to the secrets themselves. Additionally, we wanted to make certificate and password rotation transparent to all applications, enabling us to rotate credentials in an application-agnostic manner, without needing to redeploy applications. Lastly, we wanted to introduce a mechanism where application developers would explicitly describe which credentials their services need, and enable a framework to audit and grant permissions for a service to consume a secret.
The k8s-secret-projector operates similarly to the k8s-config-projector, albeit with a few differences. The secret projector combines a repository of projection manifests with a set of credential repositories. A Continuous Integration (CI) tool like Jenkins will run the k8s-secret-projector against any changes in the projection manifests repository to generate new Kubernetes Secret YAML files. Then, Continuous Deployment can deploy the generated and validated Secret files to any number of Kubernetes clusters.
Take this file in the production credentials repository, named aws/credentials.json:
{ "us-east-1": { "region": "us-east-1", "aws": { "key": "somethignSekri7T!", }, "s3": { "key": "passW0rD!", }, "redshift": { "key": "ello0liv3r!", "database": "mydatabase" } }, "us-west-2": { "region": "us-west-2", "aws": { "key": "anotherPasswr09d!", }, "s3": { "key": "sueprSekur#", } } }
We need to create an amazon.yaml configuration file containing the s3.key and aws.key for us-east-1, as well as a text file containing our region. The projection manifest below will extract only the fields we need, and output them in the format desired.
name: aws-credentials namespace: myteam repo: production data: # create an amazon.yaml config with the secrets we care about - name: amazon.yaml source: format: yaml json: aws/credentials.json jsonpaths: s3: $.us-east-1.s3.key aws: $.us-east-1.aws.key region: $.us-east-1.region # create a item containing just the name of the region we are in - name: region source: json: aws/credentials.json jsonpath: $.us-east-1.region
Projecting this manifest with the above credentials results in the following Kubernetes Secret YAML file:
apiVersion: v1 kind: Secret metadata: labels: tumblr.com/managed-secret: "true" tumblr.com/secret-version: master-741-7459d1abcc120 name: aws-credentials namespace: myteam data: region: dXMtZWFzdC0x # region decoded for clarity: us-east-1 amazon.yaml: LS0tCnMzOiAicGFzc1cwckQhIgphd3M6ICJzb21ldGhpZ25TZWtyaTdUISIKcmVnaW9uOiB1cy1lYXN0LTEK # amazon.yaml decoded for clarity: # --- # s3: "passW0rD!" # aws: "somethignSekri7T!" # region: us-east-1
In addition to being able to extract fields from structured YAML and JSON sources, we gave it the ability to encrypt generated Secrets before they touch disk. This allows Secrets to be deployed in shared Kubernetes environments, where users are colocated with other users, and do not feel comfortable with their Secret resources being unencrypted in etcd. Please note, this requires decryption by your applications before use. More details on how the encryption modules work can be found here.
For more examples of how to use this, check out examples here!
What's Next
We are excited to share these tools with the Kubernetes open source community, and we hope they can help your organization adopt container-native thinking when managing application lifecycle like they helped Tumblr. Feature enhancements and bug fixes are welcome! And, shameless plug: if you are interested in Kubernetes, containerization technology, open source, and scaling a massive website with industry leading technologies and practices? Come join us!.
- @pipefail
96 notes
·
View notes
Text
C#: JSONPath
How to apply JSONPath expressions in C#, using the Json.net library.
Introduction In this tutorial we will learn how to apply JSONPath expressions in C#, using the Json.net library. JSONPath is a powerful query language for JSON, similar to XPath regarding XML. In our examples below, we will focus on how to apply simple expressions, as our focus will be on how to use the C# API exposed by the Json.net library. How to apply JSONPath expressions We will start…
View On WordPress
0 notes
Text
Check API Is Working Or Not
Check api is working or not is a type of functional test that makes sure an API works correctly and does what it’s supposed to. This can include everything from ensuring the API carries data in a certain format to making sure users can’t affect the software in unexpected ways. Functional tests also analyze nonfunctional aspects of an API, such as performance and security.
The health endpoint, usually available via /health/ready or /health/liveness, verifies that an API is ready to accept incoming requests. This is often a good place to start for testing an API, as it is a simple way to test basic functionality without waiting for a response from the API itself.
Another important feature of a health check is a timestamp that indicates when the API should be deregistered. This is usually specified as a duration with a suffix like “10m”. The goal here is to set this timeout so that it’s significantly longer than any expected recoverable outage for the associated service.
Other health checks focus on verifying the structure and content of an API’s response. This can include validating the structure of an JSON or XML data structure, verifying that the response is sorted on the selected field in ascending or descending order, and confirming that all fields in the response are present. Katalon Studio includes a rich library of verification methods, including regular expressions, JsonPath, and XmlPath, to allow developers to quickly and easily validate the output of an API.
youtube
"
SITES WE SUPPORT
Blogspot – Check api
SOCIAL LINKS
Facebook Twitter LinkedIn Instagram Pinterest
"
0 notes
Text
An insightful discussion abour replacing JSONPath with jq or other alternatives. The main reason being that JSONPath lacks power and flexibility: "JSONPath was designed to query JSON documents for matches, especially arrays. It wasn't designed to handle complex logic, and the limitations in the spec show. JSONPath's inability to reference parent objects or property names of matching items forces users to contort their data in all sorts of strange ways." Also, support in different languages is reportedly bad. Also mentions https://jmespath.org as a formally specified alternative to jq.
0 notes
Text
kubernetes cheat sheet 100% working R633?
💾 ►►► DOWNLOAD FILE 🔥🔥🔥🔥🔥 See the helpful list of each commonly used category or component of Kubernetes (K8S) with appropriate kubectl commands for quick reference! This cheatsheet will serve as a quick reference to make commands on many common Kubernetes components and resources. You can use the full command for an object. See also: Kubectl overview and JsonPath guide. Creating Objects. $ kubectl create -f ./ # create resource(s) in a json or. Kubectl Cheat Sheet: 10 Critical Commands & Examples. The kubectl command line tool can help you perform almost any action on your Kubernetes cluster. 9 Work fast with our official CLI. Learn more. If nothing happens, download GitHub Desktop and try again. If nothing happens, download Xcode and try again. There was a problem preparing your codespace, please try again. To switch between contexts, you can also install and use kubectx. To switch namespaces, you can also install and use kubens. List of az aks commands. Secure the dashboard like this. Then run:. Skip to content. Star A cheat sheet for Kubernetes commands. License MIT license. This commit does not belong to any branch on this repository, and may belong to a fork outside of the repository. Branches Tags. Could not load branches. Could not load tags. Launching Xcode If nothing happens, download Xcode and try again. Launching Visual Studio Code Your codespace will open once ready. Latest commit. Git stats 29 commits. Failed to load latest commit information. View code. Kubernetes Cheat Sheet A cheat sheet for Kubernetes commands. Set-Alias -Name k -Value kubectl. About A cheat sheet for Kubernetes commands. Topics kubernetes k8s kubectl cheat-sheet kubernetes-cheat-sheet kubernetes-commands. MIT license. Releases No releases published. Packages 0 No packages published. Contributors 3. You signed in with another tab or window. Reload to refresh your session. You signed out in another tab or window.
1 note
·
View note
Text
kubernetes cheat sheet work 19BF%
💾 ►►► DOWNLOAD FILE 🔥🔥🔥🔥🔥 See the helpful list of each commonly used category or component of Kubernetes (K8S) with appropriate kubectl commands for quick reference! This cheatsheet will serve as a quick reference to make commands on many common Kubernetes components and resources. You can use the full command for an object. See also: Kubectl overview and JsonPath guide. Creating Objects. $ kubectl create -f ./ # create resource(s) in a json or. Kubectl Cheat Sheet: 10 Critical Commands & Examples. The kubectl command line tool can help you perform almost any action on your Kubernetes cluster. 9 All rights reserved. All other trademarks are the property of their respective owners. Often you know what you want to do, you just can't remember the vocabulary or syntax for how to do it. This Kubernetes cheat sheet is designed to help solve that problem. Kubernetes provides a way to orchestrate containers to provide a robust, cloud native environment. So rather than: kubectl get pods You can use: kubectl get deployments Now let's look at getting started. Get Started Setting up a Kubernetes environment is straightforward. Setup Kubernetes with k0s There are many ways to create a Kubernetes cluster; in this case we are assuming you are using k0s with a single-node configuration. Install kubectl You can get kubectl, the standard Kubernetes client, in multiple ways. It also, however, provides alternative ways to accomplish most of these tasks without actually using kubectl. You can download and install Lens here , then use the kubectl tool from the terminal. Create or apply changes to a resource kubectl apply -f. Types of services First, it's important to understand and remember the different types of services, because each has a different set of behaviors. NodePort enables you to create a service that's available from outside the cluster by exposing the service on the same port for every node. For example, the same service might be available on host1. LoadBalancer requires coordination with your cloud provider's load balancer, which automatically routes requests to the service. For this reason, not all distributions of Kubernetes will support LoadBalancer services. Port vs targetport One aspect of Kubernetes networking that frequently gets confusing is the notion of port versus targetPort. Here's the difference: port: the port receiving the request targetPort: the container port receiving the request Think of the request like an arrow flying into a container. Learn Containers 5 Minutes at a Time. View schedule. What is the Software Defined Data Center?
1 note
·
View note
Text
kubernetes cheat sheet PC OJ3#
💾 ►►► DOWNLOAD FILE 🔥🔥🔥🔥🔥 See the helpful list of each commonly used category or component of Kubernetes (K8S) with appropriate kubectl commands for quick reference! This cheatsheet will serve as a quick reference to make commands on many common Kubernetes components and resources. You can use the full command for an object. See also: Kubectl overview and JsonPath guide. Creating Objects. $ kubectl create -f ./ # create resource(s) in a json or. Kubectl Cheat Sheet: 10 Critical Commands & Examples. The kubectl command line tool can help you perform almost any action on your Kubernetes cluster. 9 All rights reserved. All other trademarks are the property of their respective owners. Often you know what you want to do, you just can't remember the vocabulary or syntax for how to do it. This Kubernetes cheat sheet is designed to help solve that problem. Kubernetes provides a way to orchestrate containers to provide a robust, cloud native environment. So rather than: kubectl get pods You can use: kubectl get deployments Now let's look at getting started. Get Started Setting up a Kubernetes environment is straightforward. Setup Kubernetes with k0s There are many ways to create a Kubernetes cluster; in this case we are assuming you are using k0s with a single-node configuration. Install kubectl You can get kubectl, the standard Kubernetes client, in multiple ways. It also, however, provides alternative ways to accomplish most of these tasks without actually using kubectl. You can download and install Lens here , then use the kubectl tool from the terminal. Create or apply changes to a resource kubectl apply -f. Types of services First, it's important to understand and remember the different types of services, because each has a different set of behaviors. NodePort enables you to create a service that's available from outside the cluster by exposing the service on the same port for every node. For example, the same service might be available on host1. LoadBalancer requires coordination with your cloud provider's load balancer, which automatically routes requests to the service. For this reason, not all distributions of Kubernetes will support LoadBalancer services. Port vs targetport One aspect of Kubernetes networking that frequently gets confusing is the notion of port versus targetPort. Here's the difference: port: the port receiving the request targetPort: the container port receiving the request Think of the request like an arrow flying into a container. Learn Containers 5 Minutes at a Time. View schedule. What is the Software Defined Data Center?
1 note
·
View note