#JVM tuning
Explore tagged Tumblr posts
Visit Tumblr Blog
Explore Tumblr blogs with no restrictions, modern design and the best experience.
Last Seen Tumblr Blogs


Fun Fact
Tumblr’s reach among the 26-to-35-year-olds in the US is 11%.
Text
Those wise, old Javanese
Yesterday I discovered "Arrays of Wisdom of the Ancients", Aleksey Shipilёv's 2016 quest for the most efficient way to convert Java collections into arrays. It's a fascinating story. Aleksey explains why the conversion API is the way it is, then presents some counter-intuitive measurements.
Next he makes an important point about performance analysis:
At this point, most people make the major mistake: they run with these numbers as if they are the truth. But these numbers are just data, they don’t mean anything unless we extract the insights out of them. To do that, we need to see why the numbers are like that.
To gain such insight, Aleksey uses various profiling tools. After pursuing some related questions (which lure him back into the spiderweb-encrusted days of Java 1.6), he concludes by making another point I adore:
most of the time, the straight-forward code is fast enough, so stop philosophizing about angels on the head of a pin, and get back to work. 99.9% of applications do not need a dedicated team of performance engineers; they need instead for their developers to focus on writing clear, maintainable code, and a little bit of measurement and tuning to file off the rough edges when the code fails to meet the performance requirements.
Here's the URL, in case you want to read the original post:
#java#software engineering#coding#jvm#arrays#collections#wisdom#software development#performance#measurements#profile app#old news#tuning#computer history#efficiency#war stories#good enough
1 note
·
View note
Text
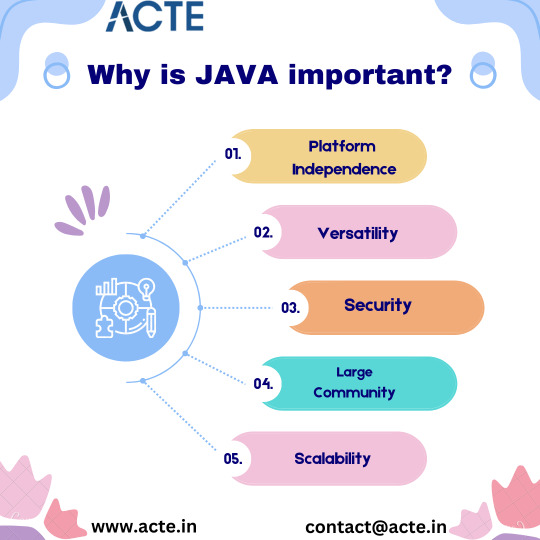
Unleashing the Power of Java: Your Guide to a Versatile Programming Language
Java: The Language of Digital Choreography
Programming languages are like the words we use to communicate with computers, and among these languages, Java stands out as a versatile and powerful tool. Imagine it as teaching your computer to dance to your tune, where your instructions are written in Java. But what makes Java so special, and why is it so widely embraced in the world of programming? Let's dive into the key reasons behind its importance.

1. Platform Independence: Java's Superpower
Java possesses a superpower—it can run on various computer systems without requiring modifications. How? Java programs are transformed into bytecode, a universal language understood by the Java Virtual Machine (JVM). This bytecode runs seamlessly on Windows, Mac, or Linux, making Java truly platform-independent.
2. Versatility: The Swiss Army Knife of Programming
Java is like a Swiss Army knife for programmers. It's not limited to one domain; you can use it to craft web applications, mobile apps, desktop software, and even embed it in small devices like smart thermostats. Its adaptability knows no bounds.
3. Security: A Robust Guardian
In an age where digital security is paramount, Java takes security seriously. It boasts built-in features that safeguard your computer and data from malicious software, providing peace of mind in our increasingly interconnected world.
4. Large Community: Your Support Network
The vast Java community is a valuable resource. With a multitude of Java developers out there, you can easily find help, access resources, and leverage libraries. If you encounter a coding challenge, chances are someone else has faced it and shared a solution.
5. Scalability: From Small to Massive
Java scales effortlessly. It's trusted by major corporations to power their colossal systems. Whether you're creating a small game or launching a massive e-commerce platform, Java can handle the challenge.
The Java Odyssey: Transforming Code into Digital Life
Understanding the inner workings of Java is paramount in the realm of programming. It unfolds as an intricate journey, a symphony of steps that bring your code to life, transforming instructions into digital ballet. Let’s delve deeper into this process:
1. Composition of Code: The Birth of Instructions
The journey commences with the composer, the programmer, crafting Java code that resonates with human understanding. It’s akin to writing the script for a grand performance, where every line of code becomes a note in the symphony of instructions.
2. Compilation: The Translator’s Artistry
Your code embarks on a transformative voyage known as compilation. This step resembles a skilled translator rendering a literary masterpiece into a universal language. The code metamorphoses into bytecode, a linguistic bridge that computers understand.
3. Bytecode: The Choreographer’s Notation
Bytecode emerges as the choreographer’s notation — a graceful set of instructions, akin to dance moves meticulously notated on a score. The Java Virtual Machine (JVM) is the dance floor, and bytecode is the choreographic masterpiece. It is platform-agnostic, a language that speaks fluently on any stage where a JVM is present.
4. Execution: The Grand Performance
The Java Virtual Machine takes center stage, assuming the role of the conductor and principal dancer. It orchestrates the grand performance by executing the bytecode on the target computer. This is where your program comes to life, faithfully translating your meticulously crafted instructions into tangible actions.
The Call to Adventure: Java Awaits
Now, are you ready to embark on the captivating adventure of Java? It beckons with the promise of exploring boundless possibilities and orchestrating digital feats. Java’s prowess extends across a myriad of applications, underpinned by its platform independence, fortified security, and the unwavering support of a vibrant community. If you harbor the eagerness to communicate with computers and guide them to perform incredible acts, Java stands as the perfect threshold.
Java is your gateway to a world where code transforms into enchanting performances, where the mundane becomes extraordinary. It is here that your journey unfolds, a journey of endless creativity and digital choreography that awaits your creative touch. Step onto the Java stage, and let your programming odyssey commence.
For those looking to deepen their understanding of Java, we strongly recommend exploring ACTE Technologies. Their qualified instructors can significantly enhance your learning journey, offering certificates and career placement opportunities. Whether you prefer online or offline access, ACTE Technologies provides a wealth of resources to help you master Java. Consider enrolling in one of their courses to embark on a step-by-step learning adventure.
#javacourse#javascript#javadevelopmentcompany#javaprogramming#javaprojects#best java developer jobs#best java training
4 notes
·
View notes
Text
What to Look for When Hiring Remote Scala Developers

Scala is a popular choice if you as a SaaS business are looking to build scalable, high-performance applications. Regarded for its functional programming potential and seamless integration with Java, Scala is widely implemented in data-intensive applications, distributed systems, and backend development.
However, to identify and hire skilled remote software developers with Scala proficiency can be challenging. An understanding of the needed key skills and qualifications can help you find the right fit. Operating as a SaaS company makes efficiency and scalability vital, which is why the best Scala developers can ensure smooth operations and future-proof applications.
Key Skills and Qualities to Look for When Hiring Remote Scala Developers
Strong knowledge of Scala and functional programming
A Scala developer's proficiency with the language is the most crucial consideration when hiring them. Seek applicants with:
Expertise in Scala's functional programming capabilities, such as higher-order functions and immutability.
Strong knowledge of object-oriented programming (OOP) principles and familiarity with Scala frameworks such as Play, Akka, and Cats.
You might also need to hire backend developers who are adept at integrating Scala with databases and microservices if your project calls for a robust backend architecture.
Experience in distributed systems and big data
Scala is widely used by businesses for large data and distributed computing applications. The ideal developer should be familiar with:
Kafka for real-time data streaming.
Apache Spark, a top framework for large data analysis.
Proficiency in NoSQL databases, such as MongoDB and Cassandra.
Hiring a Scala developer with big data knowledge guarantees effective processing and analytics for SaaS organizations managing massive data volumes.
Ability to operate in a remote work environment
Hiring remotely is challenging since it poses several obstacles. Therefore, remote developers must be able to:
Work independently while still communicating with the team.
Use collaboration technologies like Jira, Slack, and Git for version control.
Maintain productivity while adjusting to distinct time zones.
Employing engineers with excellent communication skills guarantees smooth project management for companies transitioning to a remote workspace.
Knowledge of JVM and Java interoperability
Scala's interoperability with Java is one of its main benefits. Make sure the developer has experience with Java libraries and frameworks and is knowledgeable about JVM internals and performance tuning before employing them. They must be able to work on projects that call for integration between Java and Scala. Businesses switching from Java-based apps to Scala will find this very helpful.
Problem-solving and code optimization skills
Writing clear, effective, and maintainable code is a must for any competent Scala developer. Seek applicants who can:
Optimize and debug code according to best practices.
Refactor current codebases to increase performance.
Possess expertise in continuous integration and test-driven development (TDD).
Conclusion
It takes more than just technical know-how to choose and hire the best Scala developer. Seek out experts who can work remotely, have experience with distributed systems, and have good functional programming abilities. Long-term success will result from hiring developers with the appropriate combination of skills and expertise. Investing in top Scala talent enables SaaS organizations to create high-performing, scalable applications that propel business expansion.
0 notes
Text

Java’s role in high-performance computing (HPC)
Java’s role in High-Performance Computing (HPC) has evolved significantly over the years. While traditionally, languages like C, C++, and Fortran dominated the HPC landscape due to their low-level control over memory and performance, Java has made inroads into this field thanks to various optimizations and frameworks.
Advantages of Java in HPC
Platform Independence — The Java Virtual Machine (JVM) allows Java applications to run on multiple architectures without modification.
Automatic Memory Management — Java’s garbage collection (GC) simplifies memory management, reducing the risk of memory leaks common in manually managed languages.
Multi-threading & Parallelism — Java provides built-in support for multithreading, making it easier to develop parallel applications.
JIT Compilation & Performance Optimizations — Just-In-Time (JIT) compilation helps Java achieve performance close to natively compiled languages.
Big Data & Distributed Computing — Java powers popular big data frameworks like Apache Hadoop, Apache Spark, and Flink, which are widely used for distributed HPC tasks.
Challenges of Java in HPC
Garbage Collection Overhead — While automatic memory management is beneficial, GC pauses can introduce latency, making real-time processing challenging.
Lower Native Performance — Even with JIT optimization, Java is generally slower than C or Fortran in numerical and memory-intensive computations.
Lack of Low-Level Control — Java abstracts many hardware-level operations, which can be a disadvantage in fine-tuned HPC applications.
Use Cases of Java in HPC
Big Data Processing — Apache Hadoop and Apache Spark, both written in Java/Scala, enable large-scale data processing.
Financial Computing — Many trading platforms use Java for risk analysis, Monte Carlo simulations, and algorithmic trading.
Bioinformatics — Java-based tools like Apache Mahout and BioJava support genomic and protein structure analysis.
Cloud-Based HPC — Java is widely used in cloud computing frameworks that provide scalable, distributed computing resources.
Java-Based HPC Frameworks & Libraries
Parallel Java (PJ2) — A library designed for parallel computing applications.
Java Grande Forum — A research initiative aimed at improving Java’s suitability for scientific computing.
MPJ Express — A Java implementation of Message Passing Interface (MPI) for distributed computing.
Future of Java in HPC
With ongoing developments like Project Panama (improving native interoperability), Project Valhalla (introducing value types for better memory efficiency), and optimized Garbage Collectors (ZGC, Shenandoah), Java is becoming a more viable option for high-performance computing tasks.
1 note
·
View note
Text
Understanding the Java Virtual Machine (JVM): Internals and Optimization

Introduction
Briefly introduce the JVM and its role in running Java applications.
Highlight why understanding JVM internals is crucial for developers.
Mention key aspects like performance, memory management, and optimizations.
1. JVM Architecture: An Overview
Explain how JVM acts as an abstraction layer between Java code and the underlying hardware.
Key components:
Class Loader: Loads bytecode into memory.
Runtime Memory Areas: Heap, Stack, Method Area, etc.
Execution Engine: Converts bytecode into native code.
Garbage Collector (GC): Manages memory automatically.
2. JVM Memory Management
Heap vs. Stack Memory: What each is used for.
Method Area & Runtime Constant Pool: Storage for metadata and constants.
Garbage Collection (GC) Mechanisms:
Serial, Parallel, CMS, G1, and ZGC collectors.
When and how GC runs.
Tuning GC for performance (using JVM options like -XX:+UseG1GC).
3. Just-In-Time (JIT) Compilation
How JIT compiles frequently used bytecode into native machine code for performance.
Difference between:
Interpreter Mode (slower execution but quick startup).
JIT Compilation (optimizes hot code paths).
JVM optimizations like:
Method Inlining
Loop Unrolling
Escape Analysis
4. JVM Optimization Techniques
Tuning JVM with Command-line Flags
-Xms and -Xmx for memory allocation.
-XX:+PrintGCDetails for monitoring GC.
Profiling and Monitoring Tools
JVisualVM, JConsole, Java Flight Recorder.
Code-level Optimizations
Reducing object creation to avoid excessive GC.
Using efficient data structures (ArrayList vs. LinkedList).
Avoiding memory leaks (proper use of WeakReferences, ThreadLocal).
5. JVM Performance Best Practices
Selecting the right GC algorithm for different workloads.
Analyzing JVM logs to detect performance bottlenecks.
Using Ahead-of-Time (AOT) Compilation (like GraalVM) for even faster execution.
Conclusion
Summarize key takeaways: JVM architecture, memory management, JIT compilation, and optimizations.
Emphasize the importance of tuning JVM settings for different applications.
WEBSITE: https://www.ficusoft.in/core-java-training-in-chennai/
0 notes
Text
Analyzing and tuning the Garbage collection in JVM can be difficult thing to do. Most java applications do not require this type of tuning. However when there is large amount of load applications may need to start using GC tuning techniques to get best results. Each application is different and therefore no one size fits all solution for it. However the approach for garbage collector tuning is same for all types of application. Garbage collector tuning is a cyclic process that involves monitoring and adjusting the JVM GC parameters to match the application needs. In this article, I am going to describe how we can monitor and identify problems related to garbage collection using SPLUNK analytics tool. There are many GC log analysis tools available, however this tutorial focuses on splunk queries and techniques to identify problems in a production application. Here are the steps to analyze GC logs using splunk Step 1: Enable GC Logs Java Hot spot VM has a built in support for logging garbage collection activities. This provides a lot of useful information about running application and garbage collection. This log can provide you following information Total size of objects using memory Number of times GC has been triggered. Total available memory for JVM Type of GC collection - Full or Partial Below JVM parameters can be used to enable GC logging in a HotSpot VM, Its highly recommended to enable this logging in production systems and monitor for Full collections. -verbose:gc -Xloggc:/path/to/gc.log Additional attribute logging params -XX:+PrintGCDetails -XX:+PrintGCTimeStamps -XX:+PrintGCDateStamps Sample log entries in GC log file will look like this [GC 12345.678: [ParNew: 844129K->4912K(943544K), 0.0092400 secs] 1974793K->1135530K(3040896K) icms_dc=0 , 0.0095380 secs] [GC 123567.891: [ParNew: 841112K->4824K(943544K), 0.0087620 secs] 2021920K->1184327K(3040896K) icms_dc=0 , 0.0090380 secs] [GC 232617.109: [Full GC 7525K->7477K(60800K), 0.0615190 secs] Step 2 : Index GC Logs in Splunk Once the logs are setup for your application you can start indexing it in splunk. This can be an easy task if you already have splunk setup. For this article I am assuming you can setup the splunk for GC log file. Step 3 : Query Splunk For Full Garbage collections Once the GC log file is setup in splunk you can start querying it. The most important check on a GC log is to scan for a full collection. Full collections can cause application pauses and create a lot of performance issues. Full collections are common in two types of application Applications with memory leaks Applications with heavy load that have poor or no GC tuning. To check for a Full GC collection enter this query in your splunk, index=myindex sourcetype=myappsource “Full GC" Run this query for a days time and see if you get any results. Every row in the results will correspond to a Full GC collection. If you do not see any results run this query for longer period of time and observe the application behavior for several days of garbage collection cycle. How Many Full GC are Good? In a healthy and well tuned application there should be no full GC collection required. Therefore any occurrence of a Full GC log entry is an opportunity for you to optimize your application performance by either fixing memory leaks or tuning garbage collector algorithm to fit you application needs. How To Avoid Full GC? Avoiding full GC may not be easy. Below are 5 Key Tips to Avoid Full GC in your application Tip #1 Full GC collections are very common in applications that have memory leaks. Therefore, profile the application thoroughly and ensure all memory leaks are fixed. Try to understand the application memory needs and ensure no extra object or resource is left leaking. Tip #2 You may also observe full GC in heavy load applications that have no memory leaks. This is a simple optimization problem. You should tune the GC for you application to match its needs. Try to tune the GC such that it does small but frequent collections such that there is no backlog.
Tip #3 Try to avoid having too big heap size. In case your application requires lot of memory you may want to consider GC tuning before it goes live in production. To a load test run to monitor application for sometime. A typical HotSpot vm may be good for GC up to 3-4Gb heap size. Larger heap size may introduce bigger collections and longer GC pauses. If you have a fat box with lot of RAM - run multiple smaller JVMs on it instead of running one big JVM. Tip #4 Consider using other JVMs like Azul - http://www.azulsystems.com/zing/pgc or others that claim to have pause-less garbage collector. Such JVM is good to host a large heap application (10+GB of heaps). Tip #5 Leave some memory for operating system. A typical production server must leave 20% of total memory for operating system to deal with crisis. Step 4 : Query Splunk for Minor Garbage collections Minor garbage collections are commonly seen in all java applications. Its not easy to identify a problem by looking at few minor collection log entries, however you can identify a pattern of collection by tracking the frequency of minor collection. JVM does frequent minor collections when a application is creating lot of garbage. Below is the splunk query to find the frequency of minor collections index=myindex sourcetype=myappsource “ParNew:” | timechart span=5m count(_time) This query should display a line chart of minor GC collections over time. Notice the peaks in the chart are the times when GC is working hard to collect more garbage. Understand the application usage in this time frame and relate it to the GC behavior. Extracting other values in minor collection log Below query extracts the various parameters from a minor collection entry and shows them as a table of values. sourcetype=myappsource index=myindex "ParNew:” | rex "(?i)\), (?P[^ ]+)" | rex "(?i).*?\((?P\d+\w+)(?=\))" | rex "(?i)\[ParNew: (?P[^\-]+)" | rex "(?i)\->(?P[^\(]+)" | table COLLECTION_TIME, HEAP_SIZE_AVAILABLE, OBJECT_SIZE_BEFORE_GC, OBJECT_SIZE_AFTER_GC COLLECTION_TIME - Time take by GC to collect garbage objects. HEAP_SIZE_AVAILABLE - Memory size available in heap for application OBJECT_SIZE_BEFORE_GC - Size of objects in memory before GC was triggered OBJECT_SIZE_AFTER_GC - Size of objects in memory after GC completed. Step 5 : Setup Alerts Splunk makes it really easy to setup any alerts on your log files. Make sure to setup following alerts A must have alerts is for Full GC Optional alert can also be set for a limit of minor GC collections within a timeframe. For example get an alert if minor GC collections exceed 100 in 10 minutes window. Make sure you tune this alert based on your application behavior and keep adjusting these alerts when required. Step 6 : Tune the application JVM params Once you understand the GC pattern in your application you can start working on tuning it. The GC tuning is a big topic and requires a lot of efforts. Some popular options you may want to try are listed below To Use Mark and Sweep GC -XX:+CMSClassUnloadingEnabled -XX:+UseConcMarkSweepGC -XX:+CMSIncrementalMode -XX:+CMSIncrementalPacing Step 7: Repeat Step 3 to 6 Tuning application for best performance will require you to do several round of changes. Repeat the steps 3 to 6 until you get the optimal performance. Do not over optimize GC. Useful Resources of GC Tuning and Monitoring Splunk Wiki A tutorial for splunk admin on how to configure gc logs in splunk. Visualizing GC In JVM A good tutorial about JVM memory model and GC demonstrating the memory by easy to understand diagrams. Visual GC A tool by Oracle to conveniently read GC logs. GC Tuning Tutorial An in depth tutorial on how to do GC tuning. GC Monitoring Tutorial Another good tutorial about monitoring applications using GC logs. GC Tuning Tips By Oracle Oracle documentation about GC tuning. Enabling GC Logs A simple to follow tutorial for enabling and analyzing GC logs in any java application.
0 notes
Text
Unlock JVM Performance Optimization Techniques for Java Applications
Introduction Optimizing Java Performance with JVM Tuning and Profiling is a crucial task for any Java developer, as it directly affects the application’s responsiveness, scalability, and reliability. In this tutorial, we will explore the core concepts, terminology, and implementation details of JVM tuning and profiling, providing a comprehensive guide to help you optimize your Java…
0 notes
Text
High-volume, low-latency Java applications
Concurrency and Multithreading
Thread Pooling: Use thread pools (Executors in Java) to manage threads efficiently, avoiding the overhead of creating and destroying threads for each task.
Non-blocking I/O (NIO): Leverage Java NIO for handling large numbers of connections or requests without blocking threads.
Asynchronous Programming: Use CompletableFuture, or other async frameworks (like Project Reactor or Akka) to avoid blocking and enhance throughput.
ForkJoinPool: For divide-and-conquer parallelism, utilize the ForkJoinPool to break tasks into smaller sub-tasks.
2. Efficient Data Structures and Algorithms
Low-latency Collections: Use specialized collections like ConcurrentHashMap for thread-safe, highly scalable access to data. Consider using high-performance libraries like Agrona or JCTools for non-blocking data structures.
Minimize Locking: Avoid blocking locks and shared states whenever possible. Instead, use lock-free and wait-free algorithms (atomic operations via java.util.concurrent.atomic) to avoid contention.
Immutable Objects: Use immutability to reduce synchronization needs and ensure safe access across multiple threads without locks.
Garbage Collection Optimization
Garbage Collection (GC) Tuning: Configure garbage collectors to minimize GC pauses. Some low-latency collectors in the JVM include:
ZGC (Z Garbage Collector): Offers very low pause times even with large heap sizes.
Shenandoah GC: Reduces garbage collection pauses by performing more work concurrently.
G1 GC (Garbage First): Can be tuned to meet specific pause-time goals.
Object Pooling: Reuse objects to reduce the frequency of memory allocation and GC pressure.
Avoid Excessive Object Creation: Prefer primitive types and arrays over objects, especially in hot paths.
4. Network I/O Optimization
Zero-Copy I/O: Utilize memory-mapped files or Java NIO’s DirectByteBuffer for efficient data transfer without the overhead of copying data between buffers.
Use Asynchronous Networking: Java NIO combined with AsynchronousSocketChannel can handle large numbers of I/O operations concurrently without blocking.
Minimize Serialization Overhead: Use efficient serialization formats like Protocol Buffers, FlatBuffers, or MessagePack instead of Java's built-in serialization, which can be slow and memory-intensive.
5. Low-Latency Messaging Systems
Use of Messaging Systems: Low-latency messaging frameworks such as Disruptor (by LMAX) can help bypass traditional locking mechanisms by using a ring buffer architecture, reducing latency in message passing.
Off-Heap Memory: Libraries like Chronicle Queue and Chronicle Map allow storing data off-heap, reducing the load on the garbage collector and improving performance in messaging applications.
6. Database Optimization
NoSQL Databases: For high throughput, consider NoSQL solutions like Cassandra, MongoDB, or Redis for their ability to scale horizontally and handle large datasets.
In-Memory Data Stores: Use in-memory databases (like Redis or Memcached) to avoid disk I/O latency.
Sharding and Partitioning: Distribute data across multiple databases or nodes to ensure scalability and reduce the load on any single system.
7. Minimizing Latency in Critical Paths
Microservices Architecture: Use microservices to break down complex applications into smaller, more manageable components, reducing latency by allowing independent scaling.
Event-Driven Architecture: Use event-driven designs with systems like Kafka or RabbitMQ to decouple components and reduce synchronous calls that can introduce latency.
8. JVM and OS Tuning
CPU Affinity and Pinning: Bind critical threads to specific CPUs to ensure that the most important tasks are not preempted or interrupted by the OS scheduler.
Tuning JVM Parameters: Optimize JVM flags like heap size (-Xms, -Xmx), garbage collector options, and direct memory settings (-XX:MaxDirectMemorySize) based on the workload.
Reduce Context Switching: Avoid excessive thread switching by using fewer, dedicated threads for critical tasks and batch processing.
9. Profiling and Performance Monitoring
Profiling Tools: Use profilers such as VisualVM, YourKit, or Java Flight Recorder (JFR) to identify bottlenecks in code, GC performance, or I/O operations.
Metrics and Monitoring: Implement real-time monitoring (using tools like Prometheus, Grafana, or ELK Stack) to track latency, throughput, and resource utilization. Continuously fine-tune the system based on observed behavior.
10. Batching and Caching
Batch Processing: Process data in batches where possible to reduce the overhead of handling multiple individual requests.
Caching: Use local caches like Caffeine or distributed caches like Redis to store frequently accessed data, reducing the need for repeated data fetching or computation.
sudo lsof -i :<port_number>
High-volume, low-latency Java applicationsThread Pooling: Use thread pools (Executors in Java) to manage threads efficiently,
Asynchronous Programming: Use CompletableFuture, or other async frameworks (
Non-blocking I/O (NIO): Leverage Java NIO for handling large numbers of connections
Efficient Data Structures and Algorithms
Low-latency Collections: Use specialized collections like ConcurrentHashMap for thread-safe,
Minimize Locking: Avoid blocking locks and shared states whenever possible. Instead, use lock-free and wait-free algorithms
Immutable Objects: Use immutability to reduce synchronization needs
3. Garbage Collection Optimization
Configure garbage collectors to minimize GC pauses. Some low-latency collectors in the JVM include:
ZGC (Z Garbage Collector): Offers very low pause times even with large heap sizes.
Object Pooling: Reuse objects to reduce the frequency of memory allocation and GC pressure.
Database Optimization
Sharding and Partitioning:
In-Memory Data Stores: Use in-memory databases
//
Batch Processing: Process data in batches where possible to reduce the overhead of handling multiple individual requests.
Caching: Use local caches like Caffeine or distributed caches like Redis to store frequently accessed data.
Profiling Tools: Use profilers such as VisualVM, YourKit, or Java Flight Recorder (JFR)
Microservices Architecture: Use microservices to break down complex applications into smaller.
///
Class Loading
Preload Classes: You can load key classes in advance to avoid delays caused by lazy class loading during the first few requests.
Heap Sizing: Ensure the heap size (-Xms and -Xmx) is set correctly to avoid resizing the heap during runtime,
Database Connection Pool: Pre-initialize a database connection pool (e.g., HikariCP, Apache DBCP) so that connections are readily available
SQL Query Caching: If your database or ORM (like Hibernate) uses query caches, run key queries to ensure that the cache is warmed up and execution plans are cached in the database.
Class Data Sharing (CDS): Java provides a Class Data Sharing (CDS) feature that allows the JVM to share class metadata between JVM instances to speed up class loading.
//
Preloading with Frameworks (Spring Boot Example)
In frameworks like Spring Boot, you can use @PostConstruct to execute code after the application has been initialized, which is a great place to add preloading logic.
Using Map for Faster Lookups
If you want to be able to quickly look up students by their ID, for example, you can use a Map structure (HashMap or ConcurrentHashMap) that allows O(1) lookup.
Example of an In-Memory Data Map Using HashMap
to create a thread-safe and concurrent version of a HashMap, you can use the ConcurrentHashMap class in Java.
ConcurrentHashMap is a great choice when you need a thread-safe map that supports high concurrency with minimal contention.
Inserting a null Key or Value
If you attempt to insert a null key or value in a ConcurrentHashMap, a NullPointerException will be thrown.
///
ConcurrentHashMap<Student, Student>: In this example, ConcurrentHashMap is used with Student objects as both keys and values. To use Student as a key, the hashCode() and equals() methods are overridden to ensure correct key lookups.
Thread Safety: ConcurrentHashMap allows multiple threads to access the map concurrently, without needing explicit synchronization, ensuring thread-safe read and write operations.
///
Race conditions occur when multiple threads concurrently modify a shared variable without proper synchronization.
To prevent race conditions, use synchronized blocks or atomic variables like AtomicInteger for thread-safe operations.
Using synchronized Block Without static
In this solution, we create an instance variable I, and use a synchronized block to ensure thread safety. Each thread will still share the same IncrementWithSync object, so the synchronization applies to the object instance.
How the Garbage Collector Works?
Java uses reachability to determine when an object is no longer needed. If an object is no longer referenced (reachable) from any live thread, it becomes eligible for garbage collection.
Root Sources of Object References (GC Roots):
Local variables on the stack.
Active threads.
Static fields.
JNI (Java Native Interface) references.
When objects are used as keys in hash-based collections (e.g., HashMap, HashSet), the hashCode() method is used to determine the object's bucket, and equals() is used to check whether the two objects are logically equivalent.
///
0 notes
Text
Watsonx.data Presto C++ With Intel Sapphire Rapids On AWS

Using Watsonx.data Presto C++ with the Intel Sapphire Rapid Processor on AWS to speed up query performance
Over the past 25 years, there have been notable improvements in database speed due to IBM and Intel’s long-standing cooperation. The most recent generation of Intel Xeon Scalable processors, when paired with Intel software, can potentially improve IBM Watsonx.data performance, according to internal research conducted by IBM.
A hybrid, managed data lake house, IBM Watsonx.data is tailored for workloads including data, analytics, and artificial intelligence. Using engines like Presto and Spark to drive corporate analytics is one of the highlights. Watsonx.data also offers a single view of your data across hybrid cloud environments and a customizable approach.
Presto C++
The next edition of Presto, called Presto C++, was released by IBM in June. It was created by open-source community members from Meta, IBM, Uber, and other companies. The Velox, an open-source C++ native acceleration library made to be compatible with various compute engines, was used in the development of this query engine in partnership with Intel. In order to further improve query performance through efficient query rewrite, IBM also accompanied the release of the Presto C++ engine with a query optimizer built on decades of experience.
Summary
A C++ drop-in replacement for Presto workers built on the Velox library, Presto C++ is also known as the development name Prestissimo. It uses the Proxygen C++ HTTP framework to implement the same RESTful endpoints as Java workers. Presto C++ does not use JNI and does not require a JVM on worker nodes because it exclusively uses REST endpoints for communication with the Java coordinator and amongst workers.
Inspiration and Goals
Presto wants to be the best data lake system available. The native Java-based version of the Presto evaluation engine is being replaced by a new C++ implementation using Velox in order to accomplish this goal.
In order to allow the Presto community to concentrate on more features and improved connectivity with table formats and other data warehousing systems, the evaluation engine has been moved to a library.
Accepted Use Cases
The Presto C++ evaluation engine supports just certain connectors.
Reads and writes via the Hive connection, including CTAS, are supported.
Only reads are supported for iceberg tables.
Both V1 and V2 tables, including tables with delete files, are supported by the Iceberg connector.
TPCH.naming=standard catalog property for the TPCH connector.
Features of Presto C++
Task management: Users can monitor and manage tasks using the HTTP endpoints included in Presto C++. This tool facilitates tracking ongoing procedures and improves operational oversight.
Data processing across a network of nodes can be made more effective by enabling the execution of functions on distant nodes, which improves scalability and distributed processing capabilities.
For secure internal communication between nodes, authentication makes use of JSON Web Tokens (JWT), guaranteeing that data is safe and impenetrable while being transmitted.
Asynchronous data caching with prefetching capabilities is implemented. By anticipating data demands and caching it beforehand, this maximizes processing speed and data retrieval.
Performance Tuning: Provides a range of session parameters, such as compression and spill threshold adjustments, for performance tuning. This guarantees optimal performance of data processing operations by enabling users to adjust performance parameters in accordance with their unique requirements.
Limitations of Presto C++
There are some drawbacks to the C++ evaluation engine:
Not every built-in function is available in C++. A query failure occurs when an attempt is made to use unimplemented functions. See Function Coverage for a list of supported functions.
C++ does not implement all built-in types. A query failure will occur if unimplemented types are attempted to be used.
With the exception of CHAR, TIME, and TIME WITH TIMEZONE, all basic and structured types in Data Types are supported. VARCHAR, TIMESTAMP, and TIMESTAMP WITH TIMEZONE are subsumptions of these.
The length n in varchar[n] is not honored by Presto C++; it only supports the limitless length VARCHAR.
IPADDRESS, IPPREFIX, UUID, KHYPERLOGLOG, P4HYPERLOGLOG, QDIGEST, TDIGEST, GEOMETRY, and BINGTILE are among the types that are not supported.
The C++ evaluation engine does not use all of the plugin SPI. Specifically, several plugin types are either fully or partially unsupported, and C++ workers will not load any plugins from the plugins directory.
The C++ evaluation engine does not support PageSourceProvider, RecordSetProvider, or PageSinkProvider.
Block encodings, parametric types, functions, and types specified by the user are not supported.
At the split level, the event listener plugin is not functional.
See Remote Function Execution for information on how user-defined functions differ from one another.
The C++ evaluation engine has a distinct memory management system. Specifically:
There is no support for the OOM killer.
There is no support for the reserved pool.
Generally speaking, queries may utilize more memory than memory arbitration permits. Refer to Memory Management.
Functions
reduce_agg
Reduce_agg is not allowed to return null in the inputFunction or the combineFunction of C++-based Presto. This is acceptable but ill-defined behavior in Presto (Java). See reduce_agg for more details about reduce_agg in Presto.
Amazon Elastic Compute Cloud (EC2) R7iz instances are high-performance CPU instances that are designed for memory. With a sustained all-core turbo frequency of 3.9 GHz, they are the fastest 4th Generation Intel Xeon Scalable-based (Sapphire Rapids) instances available in the cloud. R7iz instances can lower the total cost of ownership (TCO) and provide performance improvements of up to 20% over Z1d instances of the preceding generation. They come with integrated accelerators such as Intel Advanced Matrix Extensions (Intel AMX), which provide a much-needed substitute for clients with increasing demands for AI workloads.
R7iz instances are well-suited for front-end Electronic Design Automation (EDA), relational database workloads with high per-core licensing prices, and workloads including financial, actuarial, and data analytics simulations due to their high CPU performance and large memory footprint.
IBM and Intel have collaborated extensively to offer open-source software optimizations to Watsonx.data, Presto, and Presto C++. In addition to the hardware enhancements, Intel 4th Gen Xeon has produced positive Watsonx.data outcomes.
Based on publicly available 100TB TPC-DS Query benchmarks, IBM Watsonx.data with Presto C++ v0.286 and query optimizer on AWS ROSA, running on Intel processors (4th generation), demonstrated superior price performance over Databrick’s Photon engine, with better query runtime at comparable cost.
Read more on Govindhtech.com
#AWS#PrestoC++#Intel#C++#C++evaluation#R7izinstances#C++engine#Watsonx.data#News#Technews#Technology#Technologynews#Technologytrends#govindhtech
0 notes
Text
Advanced Java Training: Pune's Top Classes for Experienced Programmers
For experienced programmers looking to elevate their skills, advanced Java training is essential. Pune, known for its thriving tech industry, offers a multitude of options for those seeking to master this versatile programming language. Whether you prefer in-person learning or the flexibility of an online course, Pune has you covered with some of the best Java classes in Pune.
Advanced Java training dives deep into topics that go beyond the basics, enabling programmers to build robust, scalable applications. Courses typically cover advanced concepts such as multithreading, design patterns, JVM performance tuning, and frameworks like Spring and Hibernate. These skills are highly sought after in the industry, making advanced training a valuable investment for your career.
One of the leading providers of Java classes in Pune is Scoopen. Known for its comprehensive curriculum and experienced instructors, Scoopen offers a learning experience that is both rigorous and practical. The courses are designed to bridge the gap between theoretical knowledge and real-world application, ensuring that students are well-prepared to tackle complex programming challenges.
Scoopen's advanced Java classes in Pune are tailored for professionals who already have a solid understanding of basic Java concepts. The classes emphasize hands-on learning, with numerous coding exercises and projects that simulate real-life scenarios. This practical approach helps students gain confidence in their skills and apply what they learn directly to their work.
For those who prefer a more flexible learning schedule, Scoopen also offers a Java online course. The online course covers the same advanced topics as the in-person classes but allows students to learn at their own pace. This is particularly beneficial for working professionals who need to balance their training with other commitments. The Java online course includes video lectures, interactive coding sessions, and regular assessments to ensure that learners stay on track.
Choosing between in-person Java classes in Pune and an online course depends on your personal preferences and learning style. In-person classes provide immediate access to instructors and peers, fostering a collaborative learning environment. On the other hand, an online course offers greater flexibility, allowing you to learn from anywhere and at any time.
In conclusion, advanced Java training is crucial for experienced programmers looking to advance their careers. Pune offers some of the best options for both in-person and online learning. With institutions like Scoopen providing top-notch Java classes in Pune, you can be assured of receiving quality education that will enhance your programming skills and open up new career opportunities. Whether you choose traditional classroom learning or an online course, investing in advanced Java training is a step towards becoming a proficient and in-demand Java developer.
0 notes
Text
Python vs Java vs C++: Choosing Your Programming Weapon
When diving into the world of programming, selecting the appropriate language can greatly influence the success and efficiency of your project. Python, Java, and C++ are three prominent programming languages, each with distinct characteristics and uses. This blog will explore these languages in depth, focusing on user-friendliness, performance, versatility, and common applications. Considering the kind support of Learn Python Course in Pune, Whatever your level of experience or reason for switching from another programming language, learning Python gets much more fun.

User-Friendliness and Learning Curve
Python: Python stands out for its simplicity and readability. Its clear and concise syntax makes it a popular choice for beginners. Python enables developers to write less code to achieve the same functionality as Java or C++, resulting in quicker development and easier debugging.
Java: Java’s syntax is more verbose and rigid compared to Python. This can lead to clearer and more maintainable code but also means more extensive code writing. Java is statically typed, which can catch errors at compile time but requires more boilerplate code.
C++: C++ is known for its complexity and steep learning curve. It offers low-level memory management capabilities, which are powerful but challenging for beginners. Developers need to manually manage memory, increasing the risk of errors like memory leaks but allowing for highly efficient programs.
Performance Considerations
Python: As an interpreted language, Python generally runs slower than compiled languages such as Java and C++. Python’s high-level nature abstracts many hardware details, prioritizing ease of use over performance.
Java: Java is compiled into bytecode and executed on the Java Virtual Machine (JVM), providing relatively high performance and cross-platform compatibility. JVM’s Just-In-Time (JIT) compilation optimizes Java program execution at runtime, enhancing performance.
C++: C++ is a fully compiled language, directly translating to machine code. This results in superior performance and efficiency, essential for performance-critical applications. C++ offers low-level system access, enabling fine-tuned performance optimizations.
Versatility and Use Cases
Python: Python is highly versatile, used across various domains. In web development, frameworks like Django and Flask are prevalent. Python’s extensive library ecosystem (e.g., NumPy, Pandas, TensorFlow) makes it a favorite for data science and machine learning. Its simplicity and flexibility also make it ideal for scripting and automation. Enrolling in the Best Python Certification Online can help people realise Python’s full potential and gain a deeper understanding of its complexities.

Java: Java is widely utilized in large-scale enterprise applications due to its robustness, scalability, and comprehensive ecosystem. It’s a primary language for Android app development and, along with the Spring framework, is used extensively for building complex web applications.
C++: C++ excels in developing operating systems, drivers, and embedded systems, thanks to its low-level capabilities. High-performance games often rely on C++ due to its ability to handle complex graphics and real-time computations. It’s also preferred for applications requiring high performance, such as financial trading systems, simulations, and CAD software.
Community and Ecosystem Support
Python: Python has a vibrant community that continuously enhances its development. This results in abundant resources, libraries, and frameworks. The community offers extensive documentation, tutorials, and forums, simplifying learning and troubleshooting for beginners.
Java: Java’s mature ecosystem includes a vast array of libraries, frameworks, and tools. It’s well-supported by major tech companies and has strong corporate backing, ensuring its continued development and relevance.
C++: C++ boasts a robust community of developers and a rich set of libraries and tools. The C++ Standard Library provides efficient and reliable algorithms and data structures, supporting extensive application development.
Final Thoughts
The choice between Python, Java, and C++ hinges on the specific needs of your project and the expertise of your development team.
Python shines in ease of use and rapid development, making it ideal for beginners and applications in data science, web development, and automation.
Java strikes a balance between performance and readability, suitable for enterprise applications and Android development.
C++ offers unmatched performance and low-level control, making it the go-to language for system programming, game development, and high-efficiency applications.
Understanding the strengths of each language helps in making informed decisions tailored to your project requirements and developer expertise.
#python course#python training#python#python programming#python online training#python online course
0 notes
Text
SAP Basis Knowledge

SAP Basis Java Stack Administration: A Comprehensive Guide
SAP systems often rely on a Java stack to power essential business applications and processes. SAP Basis administrators play a crucial role in ensuring the smooth operation and performance of this Java stack. This blog will delve into the key concepts and responsibilities of a SAP Basis administrator working with the Java stack.
Understanding the SAP Java Stack
The SAP Java stack is a component within SAP NetWeaver that provides a platform for running Java-based applications. Key elements include:
Java Virtual Machine (JVM): The heart of the stack, responsible for executing Java code.
Application Server Java (AS Java): The container where Java applications and components are deployed and managed.
Java Connector (JCo): Facilitates communication between Java applications and the SAP ABAP stack.
Responsibilities of a SAP Basis Java Stack Administrator
Installation and Configuration: Setting up the Java stack, configuring JCo connections, integrating the stack with other SAP components and landscapes.
Monitoring: Proactively monitoring the health of the Java stack using tools such as the SAP Management Console, Visual Administrator, and NetWeaver Administrator. Paying close attention to resource utilization (CPU, memory), JVM health, and log files.
Troubleshooting: Proficiently diagnosing and resolving Java stack issues. These issues can range from application errors to performance bottlenecks.
Patching and Updates: Keeping the Java stack secure and up-to-date by applying security patches, bug fixes, and version upgrades in a controlled manner.
Performance Tuning: Analyzing performance metrics and optimizing settings for the JVM, applications, and the AS Java itself to achieve desired performance levels.
Capacity Planning: Collaborating with business teams to forecast resource requirements and plan for future capacity adjustments.
Essential Tools for SAP Basis Java Stack Administration
Config Tool: A configuration tool for managing parameters and settings of the Java stack.
Visual Administrator: A GUI-based management tool that provides a comprehensive overview of the Java stack, allowing administrators to monitor, start/stop services, and perform configuration changes.
NetWeaver Administrator (NWA): A web-based tool used for central administration of SAP NetWeaver systems, including both Java and ABAP stacks.
SAP Management Console (SAP MC): Offers a broad view of your SAP landscape, allowing monitoring and administration of Java instances along with system status.
Keys to Success in Java Stack Administration
Strong Understanding of the JVM: A deep understanding of the JVM, including garbage collection mechanisms, memory management, and thread optimization, is critical.
SAP System Architecture: Know how different SAP system components interact and depend on the Java stack.
Troubleshooting Skills: Be methodical and analytical in diagnosing and resolving errors within the Java stack.
Staying Current: The SAP landscape continuously evolves. Keep up with new SAP Java stack versions and best practices.
Conclusion
Mastering the administration of the SAP Basis Java stack is essential for ensuring the stability, performance, and reliability of SAP systems. By following these guidelines, building your expertise, and effectively utilizing the tools provided, you’ll excel in managing this vital part of your SAP landscape.
youtube
You can find more information about SAP BASIS in this SAP BASIS Link
Conclusion:
Unogeeks is the No.1 IT Training Institute for SAP BASIS Training. Anyone Disagree? Please drop in a comment
You can check out our other latest blogs on SAP BASIS here – SAP BASIS Blogs
You can check out our Best In Class SAP BASIS Details here – SAP BASIS Training
Follow & Connect with us:
———————————-
For Training inquiries:
Call/Whatsapp: +91 73960 33555
Mail us at: [email protected]
Our Website ➜ https://unogeeks.com
Follow us:
Instagram: https://www.instagram.com/unogeeks
Facebook:https://www.facebook.com/UnogeeksSoftwareTrainingInstitute
Twitter: https://twitter.com/unogeek
#Unogeeks #training #Unogeekstraining
0 notes
Text
Best Practices for Java Development: Navigating Common Pitfalls with Finesse
Introduction
In the ever-evolving landscape of software development, Java remains a cornerstone for building robust and scalable applications. However, even the most seasoned Java developers can find themselves ensnared in common pitfalls that compromise the quality, performance, and maintainability of their code. In this comprehensive guide, we’ll dissect these challenges and provide actionable insights to navigate the intricacies of Java development with finesse
1. Meticulous Memory Management
Misstep: Overlooking memory management can result in memory leaks and inefficient resource allocation.
Solution: Exercise diligence in memory management. Leverage tools like the Java Virtual Machine (JVM) profiler to scrutinize memory usage intricacies. Implement garbage collection judiciously to release dormant objects, optimizing overall memory efficiency.
2. Exemplary Exception Handling
Misstep: Inadequate exception handling begets erratic behaviour and compounds debugging complexities.
Solution: Institute airtight exception handling mechanisms. Discriminately catch exceptions and propagate those that elude resolution. Offer articulate error messages and systematically log exceptions for expedited troubleshooting.
3. Fastidious Performance Optimization
Misstep: Disregarding performance optimization compromises user experience and application efficiency.
Solution: Systematically profile and scrutinize code with tools like JProfiler or VisualVM. Optimize critical sections, eschew gratuitous loops, and harness caching mechanisms. Stay abreast of performance tuning best practices in the Java ecosystem.
4. Adherence to Java Updates
Misstep: Languishing on outdated Java versions exposes applications to security vulnerabilities and forfeits performance enhancements.
Solution: Maintain currency with Java releases and updates. Routinely scrutinize security patches and embrace the latest features. Employ dependency management tools like Maven or Gradle for streamlined version control.
5. Vigilant Thread Safety
Misstep: Inadequate synchronization in multithreaded applications compromises data integrity.
Solution: Espouse robust synchronization mechanisms using synchronized blocks or classes. Leverage the java.util.concurrent package for streamlined concurrency management. Employ thread-safe data structures judiciously.
6. Eradicating Code Duplication
Misstep: Repetition of code blocks across the application breeds maintenance challenges.
Solution: Embrace the DRY (Don’t Repeat Yourself) principle. Encapsulate common functionalities into modular methods or classes for seamless reuse. Enlist design patterns to foster a modular and maintainable codebase.
7. Comprehensive Testing Protocols
Misstep: Inadequate testing compromises the application’s reliability and exposes latent bugs.
Solution: Champion a comprehensive testing strategy encompassing unit tests, integration tests, and end-to-end tests. Leverage stalwart testing frameworks like JUnit and sophisticated tools such as Mockito for rigorous unit testing. Integrate continuous testing practices for automated validation.
8. Inefficient Database Access
Misstep: Poorly optimized database queries and data access can bottleneck application performance.
Solution: Optimize database queries, use indexing judiciously, and consider employing an Object-Relational Mapping (ORM) framework for streamlined data access. Leverage connection pooling to efficiently manage database connections.
9. Inadequate Logging and Monitoring
Misstep: Neglecting comprehensive logging and monitoring hinders issue diagnosis and tracking.
Solution: Implement robust logging using frameworks like SLF4J and Logback or Log4j. Integrate monitoring tools to track application metrics, log errors systematically, and set up alerts for critical issues.
10. Overlooking Design Patterns
Misstep: Failing to apply design patterns can result in code that is harder to understand, maintain, and extend.
Solution: Familiarize yourself with common design patterns such as Singleton, Factory, Observer, and Strategy. Apply these patterns judiciously to enhance code organization, flexibility, and maintainability.
11. Ignoring Security Best Practices
Misstep: Neglecting security measures can expose applications to vulnerabilities, jeopardizing data and user privacy.
Solution: Adhere to security best practices, including input validation, secure coding guidelines, and encryption mechanisms. Regularly update dependencies to patch known vulnerabilities. Consider leveraging frameworks like Spring Security for robust authentication and authorization.
12. Unoptimized Resource Handling
Misstep: Inefficient resource handling, such as file I/O or network operations, can lead to performance bottlenecks.
Solution: Optimize resource handling by using buffered I/O, minimizing network calls, and releasing resources promptly. Consider leveraging try-with-resources statements for automatic resource management.
13. Ignoring Code Reviews and Collaboration
Misstep: Neglecting code reviews and collaborative development compromises code quality.
Solution: Foster a culture of code reviews within your development team. Embrace collaborative tools such as Git for version control and establish coding standards. Regularly engage in knowledge-sharing sessions to enhance the collective expertise of the team.
14. Lack of Documentation
Misstep: Inadequate or outdated documentation makes it challenging for developers to understand and maintain the codebase.
Solution: Maintain comprehensive and up-to-date documentation, including code comments, README files, and inline documentation. Use tools like Javadoc for generating API documentation to enhance code comprehension.
15. Dependency Mismanagement
Misstep: Using outdated or incompatible dependencies can lead to compatibility issues and security vulnerabilities.
Solution: Regularly update dependencies to the latest stable versions. Utilize dependency management tools like Maven or Gradle to streamline dependency resolution and version control.
By conscientiously implementing these best practices, Java developers can elevate their craft, fortifying their projects against common pitfalls, and ensuring the development of robust, secure, and maintainable applications.
0 notes
Text
Discuss how Java handles memory and what developers should know about it.
Java handles memory management through a robust system that automatically handles most tasks related to memory allocation and deallocation, with some key areas developers should be aware of:
Heap and Stack Memory:
Heap Memory: This is where objects, arrays, and instances of classes are stored.
It is managed by the Garbage Collector (GC), which automatically reclaims memory occupied by objects that are no longer in use.
Stack Memory:
Used for storing method calls, local variables, and control flow information.
Each thread in a Java program has its own stack.
Stack memory is automatically freed once a method execution is completed.
2. Garbage Collection:
Java relies on an automatic garbage collection mechanism that removes unreachable objects from memory to prevent memory leaks. The Garbage Collector works in the background, freeing up heap space without direct intervention from the developer.
However, developers should be aware that improper management of object references can lead to memory leaks, even with garbage collection in place.
Types of Collectors:
Java provides several garbage collection strategies such as Serial GC, Parallel GC, and G1 GC.
Developers should choose an appropriate garbage collection method depending on the application’s requirements.
3. Memory Leaks:
Memory leaks occur when objects are no longer needed but are still referenced, preventing the garbage collector from reclaiming the memory.
Java’s memory management helps to reduce such risks, but developers must be mindful of resource management.
For example, large objects, such as connections or buffers, should be properly closed after use.
4. Direct Memory Access:
While Java generally manages memory through its garbage collector, developers can also use Direct Memory (via java.nio package) to allocate memory outside the Java heap, typically for performance-sensitive applications like high-performance computing or I/O operations.
Direct memory is not subject to garbage collection, so it requires manual management.
5. Memory Management in Multi-threading:
When working with multiple threads, Java provides thread-local memory via the Thread Stack to ensure each thread’s local variables don’t interfere with others.
However, sharing data between threads requires synchronization, as improper access to shared memory can cause issues like race conditions or deadlocks.
6. Out of Memory Errors:
Developers should be aware of potential out-of-memory errors when the Java heap space is insufficient for the application’s needs.
This can be managed through JVM options (-Xmx for max heap size, -Xms for initial heap size) to optimize memory allocation.
7. Tuning JVM Memory:
Developers can tune the JVM memory settings to improve performance and prevent issues such as excessive garbage collection.
Adjusting the heap size, choosing an appropriate garbage collector, and profiling memory usage can help in resource-constrained environments.
In summary, understanding how Java handles memory is crucial for optimizing performance, preventing memory leaks, and making efficient use of system resources.
Developers should be aware of Java’s memory management mechanisms like heap/stack memory, garbage collection, and manual memory management when working with direct memory or multi-threading.
WEBSITE: https://www.ficusoft.in/core-java-training-in-chennai/
0 notes
Text
When it comes to performance tuning, you may not find many good books around. There are many good java books that have covered small aspects of performance tuning. However, none of them are sufficient. In this article, I have covered a handful books that I found were useful for practical applications. There are many aspects of performance tuning that java developer do not understand. Having knowledge of performance tuning tools is not enough to get world class performance on a java application. Performance tuning java applications take a lot of effort and patience. You need to have a very clear in-depth understanding of JVM architecture, Garbage collection, and multi-threading. At the same time, you also need to understand that each operating system may behave differently in a different scenario. I have compiled a list of books that can help you speed up on learning java performance tuning. In this list have focused on the books that can cover all aspects of performance tuning a java application. Java Performance: The Definitive Guide (By: Scott Oaks ) This is 400 page book is a must have for java engineers. The book is completely focused on java performance tuning approach and details. It highlights the basics of performance tuning including some key concepts such as micro-benchmarking, throughput and response time. The author has covered multiple aspects of Java application tuning including garbage collection analysis, multi threading concepts, memory optimization techniques and tools to do performance improvements. It has a detailed explanation of garbage collection algorithms that can help you understand GC tuning better. Java Performance (By: Charlie Hunt, Binu John ) This books provides numerous details about JVM and performance tuning tools. This is book is biased towards Oracle products therefore non-oracle JVM users may find it less connecting. The author has tried covering performance tuning, profiling, and performance benchmarking topics in detail. The books a lot more text and less code. This makes it an intense read, however you may be able to find a lot more details about JVM architecture internals in this book. Java Performance Tuning (By: Jack Shirazi ) https://www.amazon.com/Java-Performance-Tuning/dp/0596003773/ref=cm_cr_dp_d_rvw_txt?ie=UTF8 Jack Shirazi, the author of this book is an expert at performance tuning java applications. He has included many real life and practical examples in this book that will help any java developer. Topics like object creation, I/O, and exceptions are covered in depth. There are readers who got benefitted in real production application performance using the tips mentioned in this book. Apart from specific tips this book also have some general advice that can be used a reference for any experienced or beginner level java programmer. Systems Performance: Enterprise and the Cloud (By: Brendan Gregg ) Author of this book, Brendan Gregg is prefessional performance architect. The book is mainly focused on software performance in general, therefore it is not very specific to Java programming. However, this does not make it less valuable for the java engineers. The concepts and ideas about overall system performance are very valuable to any software developer. I think this book is a general must have book for any programmer to refresh on performance tuning applications agnostic to any specific technology. The book goes a lot more in depth at the same time its simple read. It does not require a lot of experience and background to start learning. Java Concurrency in Practice (By: Tim Peierls, Brian Goetz, Joshua Bloch, Joseph Bowbeer, Doug Lea, David Holmes ) Multi threaded programming is java is much more difficult than it looks. This book is a must read for any java programmer before jumping into writing a concurrent java application. In theory, multi thread programs can achieve a lot more results. However, in practice there are a lot of difference reasons it fails. This book is focused on doing it right.
The book starts with the basics and builds it up to very advanced topics. It includes best practices and code example that you can use for your learning. Performance Analysis for Java Websites (By: Stacy Joines, Ruth Willenborg, Ken Hygh ) https://www.amazon.com/dp/0201844540 As the name suggests, this book is completely focused on java based web applications. I think its a very practical book that covers performance tuning challenges in a vendor neutral way. The examples and code snippets in this book are handy and easy to connect. This book covers pragmatic solutions and approaches to solve performance, latency and throughput issues in a typical corporate infrastructure based application. Java Nio (By: Ron Hitchens ) Java IO has been slow for long time. The NIO (new IO) package on java introduces a better and faster way to write efficient IO bound java programs. If your application is using legacy java.io package, moving to NIO may be a big performance winner for your application. Writing good NIO code is not easy and requires a lot of understanding of new API and design patterns. I recommend this book for getting started. Summary Tuning any software is not an easy task, especially when the user expectations are high. In recent years users are a lot more impatient. A faster application may mean a lot more business to you and your company. What is your favorite performance tuning book for java ? Please share in comments.
0 notes
Text
How can JAVA Performance tuning speed up applications?
It’s one thing to write a code that works. But what about readable, concise, and clean code? That’s another matter entirely.

Creating an app that solves a problem is not that hard either. What about an app that not only solves the problem but is also easy to use? That’s what we want!
You could apply the same reasoning for multiple software properties. Let’s focus on the vital one: performance.
Issues faced with applications:
Slow Application:
Your application may not respond well because it’s spending too much time cleaning up garbage rather than running the necessary processes.
Application consumes too much memory:
The application’s memory usage is related to the number and size of live objects in the Java virtual machine (JVM) at any point in time. This can be because of valid objects needed to stay in Java heap memory or maybe because the programmer forgot to remove the unwanted object’s reference (known as ‘memory leaks’ in Java parlance).
Why opt for JAVA performance tuning?
Java optimization identifies misbehaving or underperforming code, configurations, frameworks, libraries, and, potentially, even hardware. When you identify a component as an optimization target, you can rework and retest the system.
If the Java performance optimization target is remediated, the system as a whole will perform better.
8 Tips to speed up applications with JAVA performance tuning
1. Don’t optimize before it’s necessary
This sounds simple but is often ignored by many companies. You need to follow standard best practices to implement your use cases efficiently.
But that doesn’t imply you should replace the standard libraries or make complex optimizations without asserting that it’s necessary. Premature optimization takes huge time and makes the code hard to read.
To make it even worse, these optimizations rarely have any benefits because you’re spending an extensive amount of time optimizing non-critical parts of the application.
So, how to need what you need to optimize?
First, you need to define how fast your application code needs to be, e.g., by specifying a maximum response time for the API calls or the number of records you want to import within a time frame. Once you’re done with that, you can measure which parts of your application are slow and need to be improved.
2. Use a profiler to detect the real bottleneck.
Once you follow the first recommendation and figure out the parts of your application you have to improve, ask yourself where to begin?
You can cover this question in two ways:
● You can take a look at the code and start with the part that looks suspicious or where it might create problems.
● Or you can use a profiler and get detailed information about the performance of each part of your code.
It should be obvious that the profiler-based approach gives you a better understanding of the code’s performance implications and allows you to focus on the critical parts.
And if you used a profiler, you may be surprised to know what parts of your code created the performance issues.
3. Create a performance test suite for complete application
This is another tip that helps you avoid a bunch of unexpected problems that often occur once you deploy your performance improvement to production.
You need always to define a performance test suite that works over the whole application. Run it before and after you work on the performance improvement.
These test runs will help you determine the functional and performance side effects of the change and make sure that you don’t root for an update that caused more harm than good.
That is essentially important if you work on components used by several various parts of your application, like caches or databases.
4. Work on the most significant bottleneck first.
And after you have made your test suite and analyzed the application with a profiler, you have an array of issues to address to improve the performance.
That’s good, but it doesn’t answer the question of where you should begin. You can focus on the quick wins or start with the most important issue.
It can be tempting to start with the quick wins as you will be able to show initial results soon. Sometimes, that is necessary to convince other team members that the performance analysis was worth the effort.
5. Use StringBuilder to concatenate strings programmatically.
There are different options to concatenate Strings in Java. You can use a simple + or +=, the good old StringBuilder or StringBuffer.
So, which should you prefer?
The answer is based on the code that concatenates the String. If you’re adding new content to your String, for instance, you need to use the StringBuilder.
It’s simple to use and gives a better performance than StringBuffer. But keep in mind that StringBuilder, compared to StringBuffer, is not thread-safe and may not be a good fit for all cases.
That creates a new StringBuilder, including the provided String and a capacity for 16 extra characters. Once you add more characters to the StringBuilder, your JVM dynamically increases the size of the StringBuilder.
If you are familiar with the characters that your String contains, you can give that number to another constructor method to instantiate a StringBuilder using the defined capacity.
Why use StringBuilder?
StringBuilder is speedy and takes less memory than a string when performing concatenations. This is mainly because the string is immutable in Java. The concatenation of two string objects includes creating a new object.
StringBuilder lets you add characters to an object, and you can call it every time you need to use the string representation. So, StringBuilder is useful when a mutable string is required without the performance overhead to construct lots of strings along the way.
6. Use + to concatenate Strings in one statement
When you used your first application in Java, someone probably guided you that you shouldn’t concatenate Strings with +. That’s right if you’re concatenating Strings in the application logic.
Strings are immutable. The result of each String concatenation is stored in a new String object. That needs additional memory, and it slows down your application. This happens especially when you’re concatenating multiple Strings in a loop.
Why use String?
Being immutable automatically makes the String thread safer since they won’t be altered when accessed from multiple threads. That’s why immutable objects, in general, can be shared in multiple threads running simultaneously.
These objects cannot be modified; they can only be shared between threads, cutting the need for synchronization. Also, it can create a String object without the help of a new operator.
The String class can implement the Comparable interface, unlike StringBuilder. Since a string object is immutable, its hash code can be cached at the time of creation, which should be used multiple times without calculation.
7. Checking current log levels
This should be the obvious recommendation, but unfortunately, you can find multiple codes that ignore it. Before you craft a debug message, you should first check the current log level.
Otherwise, you can create a string with your log message to be ignored afterward.
Conclusion
Optimizing an application to get the most effective performance isn’t easy.
You can take easy steps to improve the application’s performance, even if you’re not a performance tuning expert.
Most of the recommendations given in this post aren’t hard to apply to your code.
Like other businesses, if you too are looking to migrate or modernize your applications, Mindfire Solutions can be your partner of choice. We have gained significant experience over the years working on Java projects. We have a team of highly skilled and certified software professionals, who have developed many custom solutions for our global clients over the years.
Here are a few interesting projects we have worked upon for migration and modernization. Click here to know more:
PMS (Practice Management System) Modernization
Get in Touch with Us
US East Coast: +1 248.686.1424
US West Coast: +1 415.226.6334
0 notes