#NASA Scientific Visualization Studio
Explore tagged Tumblr posts
Visit Tumblr Blog
Explore Tumblr blogs with no restrictions, modern design and the best experience.
Last Seen Tumblr Blogs


Fun Fact
Tumblr’s reach among the 26-to-35-year-olds in the US is 11%.
Text
“Both policymakers and scientists try to account for where carbon comes from and how that impacts the planet,” said NASA Goddard climate scientist Lesley Ott, whose research was used to generate the final visualization. “You see here how everything is interconnected by the different weather patterns.”
#Global CO2 Data#NASA Goddard#Carbon Dioxide In The Atmosphere#NASA SVS#NASA Scientific Visualization Studio
0 notes
Text
Previous posts: 1 2 3 4 5 6 7
Sorry didn't mean to leave you in suspense for this long 😅 but I was in the mountains for a few days and got swamped by work etc etc.
Anyhoo gonna make a short-ish post here about:
The Moon

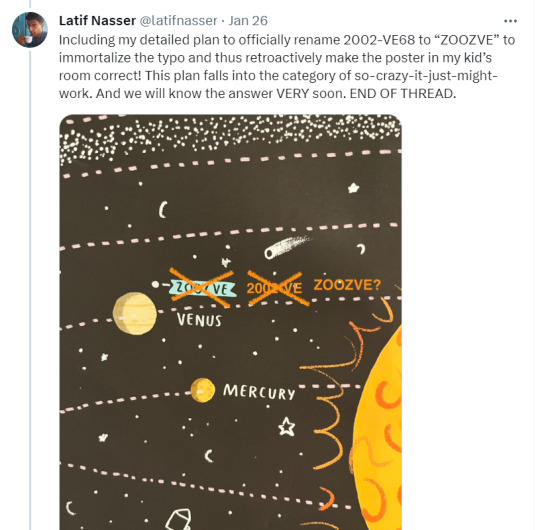
This, my friends, is a picture of the moon taken on the evening XZ arrived at Lake Lucerne.
This here is the phases of the moon in June 2024:
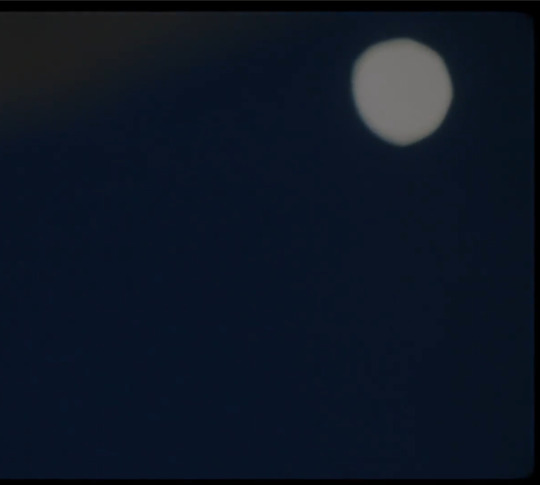

You can see that the moon in XZ's picture (left) is past half way, well on its way to being full. However, when compared to the moon phases on right, it does not look like the moon on 16 or even 17 June. In fact, it looks more like halfway between the waxing gibbous on 18th and 19th June.
Just to be extra extra sure (and after finding only witchcraft websites with past moon phases), I went to the NASA Scientific Visualization Studio (yes, we got nasa involved) Dial-a-Moon website. They've got photos of the moon at essentially every hour. Here's the link (pop in, it's very cool)
Here are the pics:


Look at that and tell me XZ didn't arrive at Lake Lucerne only on the evening of 18 June.
Which then raises many interesting questions:
Where was he for most of 17-18 June? Why was there a timeskip in Part 4 from the day he took the picture of the clock (most certainly 16 June) to the day he arrives at Lake Lucerne (most likely 18 June evening)? Which, btw, was also made to seem like the two things had happened on the same day (and confused us to no end, OH this sly bunny!)
Also, why was he in Bern for so many days, when he has essentially seen everything within one day already? And if you've booked an expensive hotel on Lake Lucerne, why check in around sunset (~9pm in June), when you can check in at 3pm and fully enjoy the amenities? Bern is max 2h by car from Lake Lucerne.
All this also means there was plenty, plenty of time for WYB to arrive on 17/18 June. XZ was waiting for him in Bern. They did something in Bern, in the presence of XZ's parents, but completely undocumented in the vlogs (nearly two whole days without footage).
The only hint we have is the sound of bells. And the next thing we know, his parents have disappeared, and they're in a super luxurious honeymoon castle, having dinner for two.
I leave you to simmer in the possibilities.
Next up, we'll reinterpret the itinerary and dates with respect to this new info. Plus a look at the overall emotional tinting of the vlogs (they are not all made equal!)
14 notes
·
View notes

Photo

2023 September 21
Tagging Bennu Image Credit: OSIRIS-REx, University of Arizona, NASA, Goddard Scientific Visualization Studio
Explanation: The OSIRIS-REx spacecraft's arm reached out and touched asteroid 101955 Bennu on October 20, 2020, after a careful approach to the small, near-Earth asteroid's boulder-strewn surface. Dubbed a Touch-And-Go (TAG) sampling event, the 30 centimeter wide sampling head (TAGSAM) appears to crush some of the rocks in this close-up recorded by the spacecraft's SamCam. The image was snapped just after surface contact some 321 million kilometers from planet Earth. One second later, the spacecraft fired nitrogen gas from a bottle intended to blow a substantial amount of Bennu's regolith into the sampling head, collecting the loose surface material. And now, nearly three years later, on Sunday, September 24, that sample of asteroid Bennu is scheduled to arrive on planet Earth. The sample return capsule will be dropped off by the OSIRIS-Rex spacecraft as it makes a close flyby of Earth. Twenty minutes after the drop-off, the spacecraft will fire its thrusters to divert past Earth and continue on to orbit near-Earth asteroid 99942 Apophis.
∞ Source: apod.nasa.gov/apod/ap230921.html
99 notes
·
View notes
Text

Habitable Worlds Observatory !
A conceptual graphic of what the Habitable Worlds Observatory may look like as it peers into the cosmos.
Credit: NASA Scientific Visualization Studio
#art#cosmos#cosmic#universe#blast#space#wallpaper#HWO#spacecraft#space exploration#space craft#render#conceptual#nasa
8 notes
·
View notes
Text

Enhanced activity in the upper atmosphere of Sporadic E layers during the 2024 Mother’s Day super geomagnetic storm
New study reveals the impact of the Mother’s Day geomagnetic storm on the Sporadic E layers that could disrupt radio communications and navigation systems
In a paper published in Geophysical Research Letters, researchers from Kyushu University report on the activity of sporadic E layers—about 90-120 km above sea level—during the Mother’s Day geomagnetic storm. The team found that the E layers were significantly enhanced during the recovery phase of the geomagnetic storm. Sporadic E layer, as the name suggests, is a phenomenon in which thin—about 1-5 km thick—but dense patches of ionized metals suddenly appear in the E layer of the ionosphere.
Moreover, the team found that these series of sporadic E layers occurred mainly over Southeast Asia, Australia, the South Pacific, and the East Pacific. They also observed a propagation characteristic of the phenomenon wherein the clouds were first detected around high latitude areas of the poles and then detected successively in lower latitude areas over time.
“When studying the Mother’s Day geomagnetic storm, many researchers looked at what happened in the F layer of the ionosphere. It is about 150-500 km above sea level and is where the most ionization occurs,” explains Professor Huixin Liu of Kyushu University’s Faculty of Science, who led the study. “The sporadic E layer hasn’t been studied very much during the storm because it appeared unaffected by solar storms. But we wanted to see if something as powerful as the Mother’s Day geomagnetic storm did anything to the E layer. What we found was very interesting.”
To track sporadic Es across the globe the team collected data both from the ground, using 37 ground-based radars called ionosodes, and from space, using the COSMiC-2 satellite network. This vast amount of data gave the researchers an unprecedented global map of sporadic Es activity during and after the solar storm.
“This large amount of data was critical for both detecting the presence of sporadic Es and tracking where they formed as time went by,” continues Liu. “In our analysis, we found that sporadic Es formed after the main phase of the solar storm, during what we call the recovery phase. Sporadic Es were also detected first in the higher latitude regions, around the Earth’s poles. They were then detected gradually in lower latitudes over time. This propagation characteristic from high to low latitudes suggests that sporadic E layers are most likely caused by the disturbed neutral winds in the E region.”
Understanding the activity of the E layer is vital due to its potential to disrupt radio communications in the HF and VHF bands. The research team hopes that their new findings will lead to better insights on Es layer activity and how such unique phenomena are created in the ionosphere.
“We now know that sporadic Es enhance during the recovery phase of a solar storm, so perhaps we can forecast more accurately sporadic Es using the propagation characteristics found in our study and mitigate potential communication disruptions,” concludes Liu. “We also plan to re-examine the data from other solar storms to see if we can better understand these phenomena.”
IMAGE: A screen shot from NASA’s Scientific Visualization Studio that visualizes the Earth's magnetosphere being hit by a geomagnetic storm that happened throughout May 10-11, 2024. The powerful geomagnetic storm resulted in auroras being viewed in relatively low latitude areas around the globe. Kyushu University researchers found that sporadic Es were also enhanced during these storms. Credit NASA's Scientific Visualization Studio and NASA DRIVE Science Center for Geospace Storms https://svs.gsfc.nasa.gov/5435.
6 notes
·
View notes
Text
Spitzer Space Telescope vs. James Webb Space Telescope (credit: Mark Malanoski (GST), Lead Motion Graphics / NASA's Scientific Visualization Studio)
21 notes
·
View notes
Link
2 min read NASA Reveals Prototype Telescope for Gravitational Wave Observatory NASA has revealed the first look at a full-scale prototype for six telescopes that will enable, in the next decade, the space-based detection of gravitational waves — ripples in space-time caused by merging black holes and other cosmic sources. On May 20, the full-scale Engineering Development Unit Telescope for the LISA (Laser Interferometer Space Antenna) mission, still in its shipping frame, was moved within a clean room at NASA’s Goddard Space Flight Center in Greenbelt, Maryland. NASA/Dennis Henry The LISA (Laser Interferometer Space Antenna) mission is led by ESA (European Space Agency) in partnership with NASA to detect gravitational waves by using lasers to measure precise distances — down to picometers, or trillionths of a meter — between a trio of spacecraft distributed in a vast configuration larger than the Sun. Each side of the triangular array will measure nearly 1.6 million miles, or 2.5 million kilometers. “Twin telescopes aboard each spacecraft will both transmit and receive infrared laser beams to track their companions, and NASA is supplying all six of them to the LISA mission,” said Ryan DeRosa, a researcher at NASA’s Goddard Space Flight Center in Greenbelt, Maryland. “The prototype, called the Engineering Development Unit Telescope, will guide us as we work toward building the flight hardware.” The prototype LISA telescope undergoes post-delivery inspection in a darkened NASA Goddard clean room on May 20. The entire telescope is made from an amber-colored glass-ceramic that resists changes in shape over a wide temperature range, and the mirror’s surface is coated in gold. NASA/Dennis Henry The Engineering Development Unit Telescope, which was manufactured and assembled by L3Harris Technologies in Rochester, New York, arrived at Goddard in May. The primary mirror is coated in gold to better reflect the infrared lasers and to reduce heat loss from a surface exposed to cold space since the telescope will operate best when close to room temperature. The prototype is made entirely from an amber-colored glass-ceramic called Zerodur, manufactured by Schott in Mainz, Germany. The material is widely used for telescope mirrors and other applications requiring high precision because its shape changes very little over a wide range of temperatures. The LISA mission is slated to launch in the mid-2030s. Download additional images from NASA’s Scientific Visualization Studio By Francis ReddyNASA’s Goddard Space Flight Center, Greenbelt, Md. Media Contact:Claire [email protected]’s Goddard Space Flight Center, Greenbelt, Md. Share Details Last Updated Oct 22, 2024 Related Terms Astrophysics Black Holes Galaxies, Stars, & Black Holes Goddard Space Flight Center Gravitational Waves LISA (Laser Interferometer Space Antenna) The Universe Keep Exploring Discover Related Topics Missions Humans in Space Climate Change Solar System
3 notes
·
View notes
Text
Does this site render correctly for anyone else? It's just showing the raw code for me. Does this means Firefox is finding an error somewhere in the HTML?
Actually looking at the HTTP request, the response doesn't have a content-type header so maybe that's it.
The wayback machine archive of it renders fine though, don't know what's up with that.
4 notes
·
View notes
Text
@nasa has included a link to the source data, but the spirograph I'd really like to see would go back more — in this case they are discussing only the Industrial Era, so only consider from 1880, but we know from Byron and Shelly there was a deep chill in those years. If we could go back geologically, the resolution would be poor, but might it double-underline how FAST current changes are changing? (or if there are precarious resonances!)

#climate data#tacoma bridge collapse#resonance#wave power equations#I didn't intend my question to be prophetic sorry
4 notes
·
View notes
Text
Atmospheric Gravity Waves Imagery
Atmospheric gravity waves are similar to what happens when you drop a stone into a calm pond, but they roll through the air and cloud tops instead of water. Just like waves form in the ocean or a lake when water is disturbed, waves also form in the atmosphere when air is disturbed. They form when air is forced upward by hills or mountains into a layer of stable air in the atmosphere. Gravity causes the air to fall back down, and it begins to oscillate, creating a ripple effect. Wind flowing over the Rocky Mountains, for example, can create gravity waves that are felt as turbulence on an airplane.
0 notes
Text
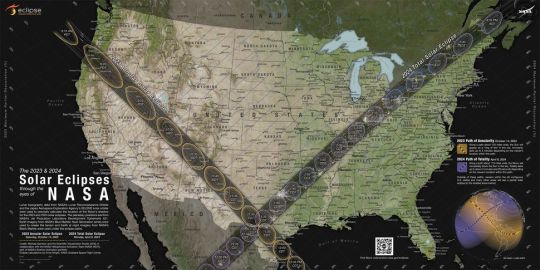
The Great American Eclipses Coming Up …
The Great American Eclipses Coming Up ...
This NASA map shows the paths of the annular “ring of fire” solar eclipse of Oct. 14, 2023 (left) and the April 8, 2024 total solar eclipse. (Image credit: NASA/Scientific Visualization Studio/Michala Garrison; eclipse calculations by Ernie Wright, NASA Goddard Space Flight Center) Notice both solar eclipses converge in the state of Texas … this may pertain to the recent surges of illegal…
View On WordPress
#aries solar eclipse#astrology#greatamericaneclipse#libra solar eclipse#mars#solareclipse#solareclipseinaries#solareclipseinlibra#venus
3 notes
·
View notes
Text
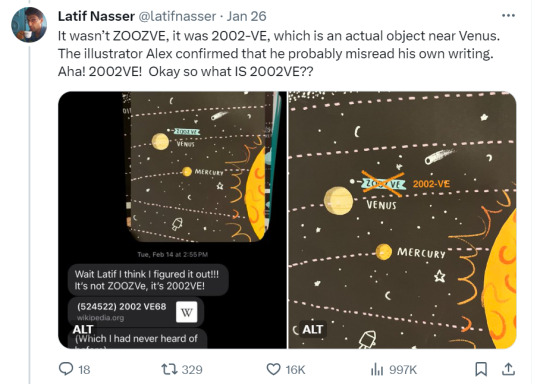
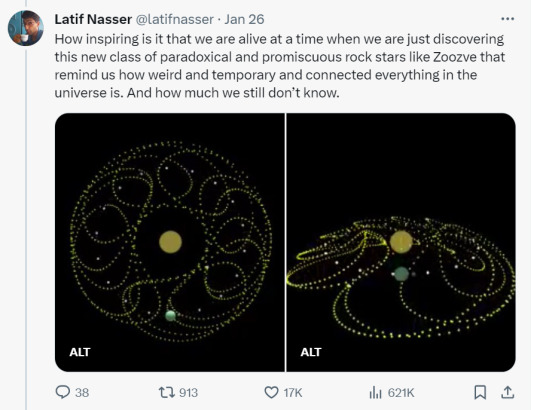
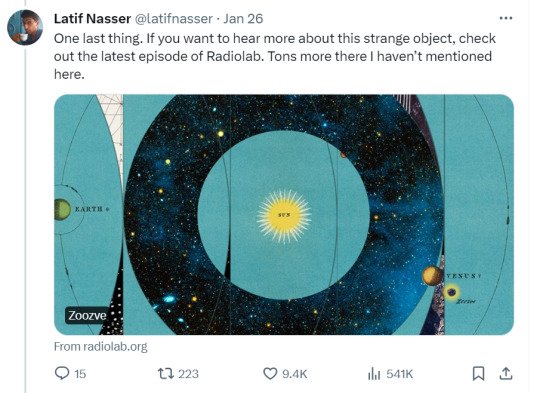
Okay so random physics that I bysomemiracle remembered reading about ZOOZVE. Trojans are made possible by these nifty things called Lagrange points (named after French-Italian mathematician Joseph-Louis Lagrange whose work yielded their discovery along with a fuckton of other awesome, mindblowing shit) ...

(Pic and gifs rom NASA's Scientific Visualization Studio - orbit of James Webb at L2)
... which is just a fancy term for points in a three body system where the gravitational force of two big-ass bodies is equal to the centripetal force of a ittybitty body. So, basically everything is balanced juuuuuuuuuuuust right so the ittybitty remains in orbit.
Anyway, Lagrange points are what enable us to launch satellites (e.g. ATT so we can look at cat videos wherever we want, or non-terrestrial telescopes like Hubble and James Webb) into space. Based on a satellite's mass and function, we choose the best point where its gravitational pull to Earth is strong enough that it won’t float off toward the Sun or another celestial body (likely the Sun tho cuz it's yooge) but weak enough that it won’t come crashing back to Earth, right.
Three-body systems like this have 5 Lagrange points. For Earth and Venus, two of these, L4 and L5, are stable, meaning an object of a certain mass tbh can't remember the exact cutoff but you can look it up can rotate p much indefinitely without altering it's path. The other three, L1, L2, and L3, are unstable meaning an object will inevitably drift away without course correcting to maintain orbit. (It should be noted, three-body systems have no general solution, so the distances of Lagrange points vary in proportion to the masses of their bodies. L1- L5 signifies general position, not magnitudes of distance, so Earth and Venus have an L1, but the distance between Earth and its L1 is not the same as Venus to its L1.)
ZOOZVE will float away from Venus but it's going to take a suuuuper long time so-long-in-fact-it'll-take-afew-millennia. For the unstable Lagrange points, objects drift away in a matter of days or months, which would indicate ZOOZVE is located at one of the stable Lagrange points, L4 or L5. I'd bet L5 since ZOOZVE first jumped ship from Earth to Venus and will eventually part ways with Venus too.
And with a name like ZOOZVE, how could we not expect her to be a free spirit.


Zoozve, my beloved
#when the physics degree comes in handy#and makes you sad you're not using it more#zoozve#lagrange points#three body problems
164K notes
·
View notes
Text
Landing on the Moon is an incredibly difficult feat — here's how 2025 is shaping up
The Moon’s Clavius Crater (Credit: NASA’s Scientific Visualization Studio/USGS) Half a century after the Apollo astronauts left the last bootprints in lunar dust, the Moon has once again become a destination of fierce ambition and delicate engineering. This time, it’s not just superpowers racing to plant flags, but also private companies, multinational partnerships and robotic scouts aiming to…
0 notes
Text

Hollywood techniques help NASA visualize supercomputing data
Captivating images and videos can bring data to life. NASA's Scientific Visualization Studio (SVS) produces visualizations, animations, and images to help scientists tell stories of their research and make science more approachable and engaging.
Using the Discover supercomputer at the Center for Climate Simulation at NASA's Goddard Space Flight Center in Greenbelt, Maryland, visualizers use datasets generated by supercomputer models to create highly detailed, accurate, and stunning visualizations with Hollywood filmmaking tools like 3D modeling and animation.
Using supercomputing models, SVS visualizers created this data-driven animation of carbon dioxide emissions moving around the planet. The visualization is driven by massive climate data sets and highly detailed emissions maps created by NASA researchers and external partners. The resulting visualization shows the impact of power plants, fires, and cities, and how their emissions are spread across the planet by weather patterns and airflow.
"Both policymakers and scientists try to account for where carbon comes from and how that impacts the planet," said NASA Goddard climate scientist Lesley Ott, whose research was used to generate the final visualization. "You see here how everything is interconnected by the different weather patterns."
By combining visual storytelling with supercomputing power, the SVS team continues their work to captivate and connect with audiences while educating them on NASA's scientific research and efforts.
3 notes
·
View notes
Text

NASA Scientific Visualization Studio | Sea Level Through a Porthole (2025) https://svs.gsfc.nasa.gov/5520/?utm_source=dlvr.it&utm_content=muz4now%2Fmagazine%2FClimate%20Action%20Now&utm_medium=tumblr
0 notes