#Power Bi solutions
Explore tagged Tumblr posts
Visit Tumblr Blog
Explore Tumblr blogs with no restrictions, modern design and the best experience.
Last Seen Tumblr Blogs


Fun Fact
In February 2021, Tumblr had 518.6 million blog accounts.
Text
Maximizing Report Creation: A Comparison of Power BI and Tableau Migration
Introduction: The Evolution of Business Intelligence
In the fast-paced business world, data visualization plays a pivotal role in driving strategic decisions. The choice of a business intelligence (BI) tool significantly impacts how organizations analyze and present their data. With technology continuously evolving, staying ahead with cutting-edge BI solutions is crucial for maintaining a competitive edge.
If you are currently using Tableau but are considering a switch to Power BI, you may be wondering whether it’s worth the effort. In this blog, we’ll guide you through the transition process, explore the key advantages of Power BI, and highlight best practices to ensure a smooth migration.
Data Source Connection: New Beginnings vs. Existing Connections
Building from Scratch: In Power BI, starting fresh with report creation means establishing new data connections.
Migration from Tableau: During migration, you connect to the pre-existing data sources that were used in Tableau, ensuring continuity and reducing the need for data reconfiguration.
Rebuilding in Power BI: Replication vs. New Creation
Building from Scratch: Creating reports from scratch allows full customization of visualizations and structure without constraints from existing designs, giving greater creative freedom.
Migration from Tableau: Migration requires replicating Tableau’s reports and visualizations, often involving reverse-engineering the work done in Tableau to rebuild similar dashboards and reports in Power BI.
Read More about Why Move from Tableau to Power BI: Key Benefits Explained
Translating Logic: Adapting Tableau’s Logic to DAX in Power BI
Building from Scratch: When creating reports from scratch, you have the flexibility to design new calculations using Power BI’s DAX language.
Migration from Tableau: One of the most intricate parts of migration is converting Tableau’s calculated fields and logic into Power BI’s DAX language, ensuring that functionality is retained while adapting to Power BI’s unique environment.
Styling and Formatting: Matching the Look vs. Redesigning from Scratch
Building from Scratch: Rebuilding reports in Power BI from scratch allows for more flexibility, offering a fresh, modern design aligned with current brand aesthetics and business needs.
Migration from Tableau: During migration, it’s often necessary to match the style and design of Tableau reports to ensure a consistent user experience.
Migration Challenges: Balancing Consistency and Flexibility
Building from Scratch: Starting fresh presents no challenges in maintaining consistency with previous designs but allows for full creative control.
Migration from Tableau: The migration process is more challenging than building from scratch, as it requires careful attention to replicating Tableau’s functionality and design to ensure the Power BI reports mirror the original in both appearance and performance.
Post-Migration Support: Ensuring a Smooth Transition to Power BI
Once the migration from Tableau to Power BI is complete, providing comprehensive post-migration support is vital to ensuring a smooth transition. This includes offering training sessions, preparing documentation that outlines the differences between Tableau and Power BI, and establishing dedicated channels for users to ask questions or report issues. These efforts will facilitate user adoption and ensure the transition to Power BI is both successful and sustainable.
Know more about Tableau to Power BI: Save Costs & Gain AI-Driven Insights
Key Considerations for Migrating from Tableau to Power BI
Calculated Columns and Measures: Understanding the Differences
Tableau: Tableau’s calculated fields enable users to perform a wide variety of in-platform calculations and dynamic analysis, creating new metrics and applying complex formulas.
Power BI: Power BI uses measures for similar functionality but requires translating Tableau’s logic into Power BI’s DAX language, which might involve some fine-tuning to maintain consistency.
Chart Creation: A Shift from Modularity to Flexibility
Tableau: Tableau uses a modular approach where each chart resides in a separate worksheet. This makes it easier to analyze individual visualizations but requires more effort to manage multiple charts.
Power BI: Power BI allows multiple charts to be placed on a single page for efficient comparison and analysis, offering greater flexibility and ease of comparison within a unified workspace.
Both Power BI and Tableau provide powerful charting capabilities. Power BI’s design allows for dynamic and interconnected visualizations, while Tableau’s modular approach emphasizes individual analysis of specific datasets.
Why Choose Acuvate?
At Acuvate, we help businesses seamlessly transition their BI tools to stay ahead in today’s data-driven world. As a trusted Microsoft partner, we ensure efficiency, security, and governance in analytics modernization.
Try our migration calculator: Seamlessly Transition from Tableau to Power BI with Acuvate
How Acuvate Supports Your Power BI Migration
1. Efficient Migration Strategy
Migrating from Tableau to Power BI can be complex, but Acuvate streamlines the process. Unlike traditional BI firms, we leverage automation and best practices to accelerate migration with minimal disruption.
2. Faster Adoption with Self-Service Analytics
Power BI empowers business users with self-service analytics. Acuvate ensures teams can independently create reports while maintaining data security and governance.
3. Seamless Microsoft Integration
As a Microsoft Solutions Partner, we integrate Power BI with Office 365, Azure, and Dynamics 365 to enhance insights and decision-making.
4. Scalable and Cost-Effective Solutions
We offer flexible managed services for security compliance, data governance, and ongoing support tailored to your business needs.
5. Cutting-Edge BI Technologies
Acuvate stays ahead of BI trends, collaborating closely with Microsoft to bring the latest innovations to our clients.
6. Reliable Support & Maintenance
Beyond migration, we ensure your Power BI environment remains optimized with continuous support and performance tuning.
7. Accelerated Data Transformation
Acuvate enhances Power BI migration with AcuWeave, our advanced Microsoft Fabric accelerator. AcuWeave streamlines data ingestion, transformation, and modeling, ensuring faster insights and seamless integration with your existing BI ecosystem.
Get Started with Acuvate Today
Whether you need a full-scale migration or phased transition, Acuvate is here to guide you. Contact us to leverage Power BI for smarter insights and decision automation.
Conclusion: Unlock the Power of Advanced BI
As businesses strive for smarter analytics and improved decision-making, Power BI emerges as a powerful alternative to Tableau. Its deep integration with Microsoft products, cost efficiency, and user-friendly experience make it an excellent choice for organizations looking to enhance their BI strategy.
With a structured migration approach and best practices in place, transitioning from Tableau to Power BI can be a game-changer for your business. Don’t hesitate to make the switch and unlock new insights to drive your company forward!
Ready to migrate? Reach out to our experts today and take the first step towards an optimized business intelligence experience with Power BI.
#powerbi#automation#tableau#migration#power bi solutions#Data visualization#data modeling#data governance#Migration tool#data transformation
0 notes
Text
Cost-Effective Power BI Solutions for All Businesses
This blog explains how Power BI Solutions help businesses work with data in a smarter way without spending too much. It covers 10 key reasons why Power BI development services are a smart pick—like building custom dashboards, connecting with Microsoft tools, and sharing reports in real time.
Whether you run a small shop or a large company, these insights show how Power BI can support better decisions, save time, and cut costs across departments.
0 notes
Text
Businesses that want to make better decisions and reports based on data should consider switching to Power BI. But like any tech shift, doing it the right way matters. A well-planned Power BI migration ensures your data is accurate, your dashboards are functional, and your team is ready to take full advantage of what the platform offers. Power BI makes it easier for teams to turn raw data into visual reports that are easy to understand and share. However, moving from older systems or tools like Excel, Tableau, or legacy BI platforms requires careful planning. That can be done with the help of Power BI coaching services. These professionals can help you assess your current setup, decide what to migrate, and ensure everything works smoothly once the move is complete. A reliable Power BI development company can also build custom reports and dashboards customized to your business needs. Instead of starting from scratch, you get fully functional tools to track your goals, highlight trends, and support more intelligent decisions. Power BI migration isn't just about moving data; it's about ensuring your team uses the new tools effectively. So, working with Power BI pros is very important. They handle the technical side of the migration and help train your staff so everyone can get value from the new setup. Whether you're shifting from on-premises databases or cloud-based platforms, a Microsoft Power BI consultant can guide the process. From planning and data mapping to performance optimization, having a professional by your side ensures nothing gets overlooked. The result? A seamless transition to a platform that helps your business stay agile and informed. With the appropriate team, Power BI becomes more than just a tool for reporting. It turns into a daily ritual.
If your business is considering moving, now's the time to consult with experienced professionals. With the help of trusted Power BI consulting services, you can make the switch smoothly and start unlocking insights that drive results.
#microsoft power bi consultant#microsoft power bi solutions#power bi development company#power bi consultants#power bi consulting company#power bi consulting services#power bi developers#power bi services#power bi solutions#microsoft power bi consulting services#power bi experts#power bi development services
0 notes
Text
6 Powerful Ways Power BI Transforms Your Business Operations
Let’s get straight to the point—Power BI’s top selling points are its robust features, intuitive design, and cost-effectiveness.
In today’s hyper-connected world, data is the new bacon—hot, in-demand, and irresistible! And why not? It drives customer behavior, shapes internal strategies, and helps business leaders make smart decisions.
But here's the catch: raw data alone isn’t valuable unless it’s well-structured, visualized, and actionable. That’s where Microsoft Power BI steps in, transforming your data chaos into clarity.

What is Power BI and Why Should You Care?
According to Microsoft, Power BI is a unified, scalable business intelligence (BI) platform that enables you to connect, model, and visualize any kind of data. It supports self-service BI, as well as enterprise-level analytics.
Power BI helps you gather, visualize, and analyze large volumes of business-critical data in a way that’s simple, engaging, and easy to digest. You can finally ditch those dull spreadsheets and lengthy reports and get everything you need—right on a single dashboard, through eye-catching graphs and interactive charts.
Power BI also shares a familiar interface with Microsoft Excel, so even non-tech-savvy users can jump in and start using it with minimal training. Plus, it integrates effortlessly with Microsoft 365 tools, cloud platforms, and external databases.
6 Ways Power BI Enhances Your Business Processes
Let’s break down how Power BI can elevate your operations, streamline decision-making, and maximize return on investment.
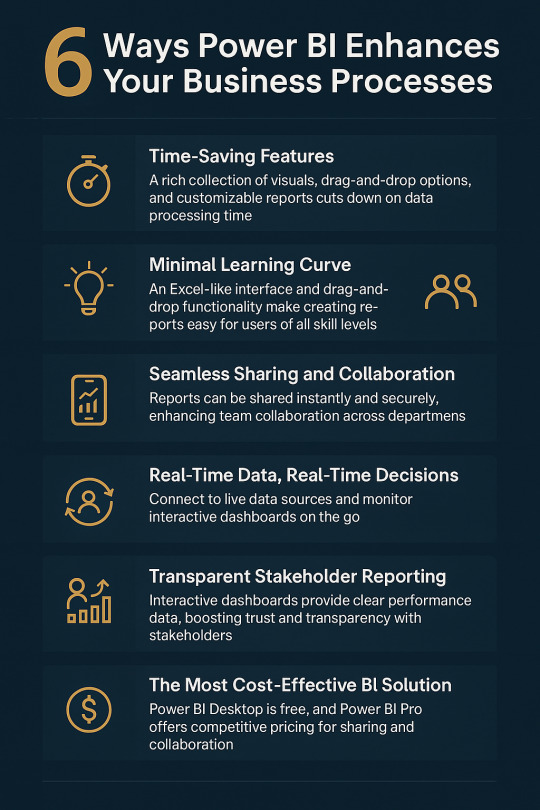
1. Time-Saving Features That Make a Big Difference
Power BI comes packed with a rich library of pre-built visuals, drag-and-drop elements, and highly customizable reports that significantly reduce the time spent on data processing.
Key time-saving features include:
Natural language queries: Ask questions like “What were sales last month?” and get instant charts.
Bookmarks, filters, and parameters: Personalize data stories based on your audience.
Zoom sliders: Easily navigate complex data.
DAX (Data Analysis Expressions): A powerful formula language for creating complex measures.
With Microsoft continuously adding updates, Power BI is always getting smarter.
2. Minimal Learning Curve
One of the biggest fears businesses have when adopting new software is the learning curve. But Power BI removes that barrier entirely.
Thanks to its Excel-like interface and drag-and-drop functionality, even first-time users can build impressive reports and dashboards. Your team doesn't need to be made up of data scientists—they just need a little curiosity and creativity.
For more advanced users, there’s support for:
M-Query for data transformation
DAX for advanced calculations
Python and SQL integration for deep-level analytics
Whether you’re a beginner or a pro, Power BI caters to all skill levels.
3. Seamless Sharing and Collaboration
Power BI takes team collaboration to the next level.
With Power BI Pro, users can:
Share reports instantly across departments
Embed dashboards into SharePoint, Teams, or your website
Schedule automatic report updates
Grant secure access to stakeholders and clients
Forget endless email chains and outdated attachments. With Power BI, everyone gets real-time access to the same data, keeping teams aligned and productive.
4. Real-Time Data, Real-Time Decisions
In a rapidly changing market, real-time insights can be a game-changer.
Power BI allows you to connect to live data sources—whether it's social media, SQL servers, CRM platforms, or cloud apps. By setting up an on-premises data gateway, your dashboards stay continuously updated.
You can even view interactive dashboards from your mobile device, so you’re never out of the loop—even on the go.
Example: Your support team can monitor live call logs to instantly spot and resolve customer wait-time issues.
That’s the power of timely decision-making.
5. Build Trust with Transparent Stakeholder Reporting
Let’s face it—no one likes long, text-heavy reports anymore.
Power BI enables you to present complex business performance data in an engaging, visual format that your stakeholders will love. From executives to investors, interactive dashboards help convey KPIs and results clearly and persuasively.
Reports can be accessed from any device at any time, building transparency and boosting stakeholder confidence.
And the best part? Updates are reflected automatically, ensuring they’re always seeing the most current data.
6. The Most Cost-Effective BI Solution on the Market
Cost plays a major role in decision-making, and Power BI truly stands out in this regard. Power BI Desktop is completely free—just download it and begin building interactive, data-rich reports right away.
For sharing and collaboration, Power BI Pro is available at just $9.99 per user per month. It allows you to publish dashboards on-premises and effortlessly share them with your team by simply sending a link.
Compared to other business intelligence tools, Power BI offers a highly competitive pricing model. When you factor in its powerful features and capabilities, it becomes clear that Power BI delivers exceptional value for your investment.
FAQs
1. Is Power BI suitable for beginners? Yes! With its Excel-like feel and drag-and-drop features, Power BI is designed for users at all levels.
2. How secure is Power BI for business data? Power BI uses Microsoft’s robust security protocols, including data encryption, role-based access, and compliance with GDPR.
3. Can I customize dashboards for different departments? Absolutely. Power BI lets you create department-specific views, filters, and dashboards based on the role or access level.
4. Does Power BI work offline? Power BI Desktop works offline for data modeling and report building. Online features like sharing and collaboration require internet access.
5. How often does Power BI get updates? Microsoft releases monthly feature updates, keeping the platform modern and user-friendly.
#power bi consulting services#generative ai#power bi solutions#data analytics#data analytics services#Power BI
0 notes
Text
0 notes
Text
Enhancing Project Management with Power BI Reporting and Dashboards
Efficient project management is the cornerstone of successful businesses, and having the right tools can make all the difference. Power BI, a leading business analytics platform, is revolutionizing project management by offering robust reporting and dashboard capabilities that provide real-time insights and data-driven decision-making.
Transforming Project Management with Power BI
Power BI empowers project managers by consolidating data from multiple sources into interactive dashboards. These dashboards enable teams to monitor project progress, track key performance indicators (KPIs), and identify potential bottlenecks—all in real time. With customizable reports, managers can tailor insights to align with specific goals, ensuring that every stakeholder has the information they need at their fingertips.
For example, Power BI’s real-time monitoring allows project managers to oversee task completion rates, budget utilization, and resource allocation. Alerts and automated notifications can be set up to identify risks early, ensuring timely interventions. By offering a centralized view of project data, Power BI eliminates the need for time-consuming manual updates, freeing teams to focus on what matters most—delivering successful projects.
Seamless Integration and Scalability
One of Power BI’s standout features is its ability to integrate seamlessly with tools like Microsoft Excel, Azure, and even ERP systems like Acumatica. This means project teams can work within a familiar ecosystem while leveraging the advanced analytics and visualization capabilities of Power BI. Whether your business is a small startup or a large enterprise, Power BI’s scalable solutions grow with you, ensuring consistent performance and reliability.
Empowering Teams with Exceptional Support
At Power BI Solutions, we specialize in delivering tailored dashboards and reports designed to meet the unique needs of your business. Our certified professionals provide end-to-end implementation and ongoing training, ensuring your team is equipped to unlock the full potential of Power BI. From automating reporting processes to creating actionable insights, we are dedicated to empowering businesses with data-driven project management solutions.
Conclusion
With its interactive dashboards, real-time reporting, and seamless integration, Power BI is transforming project management. By simplifying data analysis and enhancing decision-making, Power BI equips businesses to achieve their project goals efficiently and effectively.
0 notes
Text
1 note
·
View note
Text

Power BI Solutions are a suite of business analytics tools provided by Microsoft that enable users to analyze data and share insights. These tools transform raw data into visually engaging and interactive reports and dashboards, allowing users to monitor their business and make data-driven decisions. Power BI supports various data sources, offers advanced analytics capabilities, and integrates seamlessly with other Microsoft services and third-party applications. Its features include real-time data access, customizable visualizations, and collaborative tools, making it a versatile solution for organizations seeking to enhance their data analysis and reporting capabilities.
0 notes
Text
8 Ways Power BI Consulting Can Streamline Your Reporting Process
Businesses today are constantly seeking ways to improve their reporting processes to make better-informed decisions and stay ahead of the competition. One such solution that has gained tremendous popularity in recent years is power bi consulting.
In this blog post, we will explore the various ways in which Power BI consulting can streamline reporting processes for businesses, providing enhanced data visualisation, real-time data analysis, customised dashboards, interactive reports, seamless integration with other tools, automated report generation, data security, compliance, scalability, and flexibility.
Enhanced Data Visualisation
One of the key advantages of Power BI consulting is its ability to enhance data visualisation. Businesses can create visually appealing and informative reports through a wide range of visualisation tools such as charts, graphs, maps, and more.
These visualisations provide a clear and concise representation of complex data, making it easier for stakeholders to understand and interpret the information. For instance, businesses can utilise Power BI to create interactive dashboards with dynamic visuals that allow for better insights into their data.
Real-Time Data Analysis
Real-time data analysis is crucial for businesses to make quick and informed decisions. Power BI consulting enables organisations to analyse data in real time, providing up-to-date insights into key performance indicators and business metrics.
With real-time data analysis, businesses can identify trends, spot anomalies, and respond promptly to changes in the market, giving them a competitive edge in their industry.
Customised Dashboards
Customised dashboards offer businesses a personalised and focused view of essential business metrics. Power BI consulting helps organisations create tailor-made dashboards that align with their specific reporting needs.
These dashboards can be customised to display relevant KPIs, performance metrics, and other vital data, providing a comprehensive overview of the business's performance at a glance.
Interactive Reports
Interactivity is key to engaging stakeholders and encouraging data exploration. Power BI consulting empowers businesses to create interactive reports that allow users to drill down into the data for deeper insights.
Users can interact with the reports, apply filters, and explore different data perspectives, fostering a better understanding of the underlying trends and patterns.
Seamless Integration with Other Tools
Power BI's seamless integration with other business tools is instrumental in streamlining the reporting process. This integration allows businesses to combine data from various sources and tools, providing a comprehensive and unified view of their operations.
Popular business tools such as Microsoft Excel, Azure, Salesforce, and Google Analytics can be seamlessly integrated with Power BI, enhancing reporting capabilities and enabling a more holistic analysis of the business's performance.
Automated Report Generation
Automated report generation is a time-saving benefit offered by Power BI consulting services. Businesses can automate the process of generating reports, reducing manual effort and improving overall efficiency.
By setting up automated schedules and workflows, organisations can ensure that reports are generated and distributed at predefined intervals, allowing stakeholders to access the latest insights without the need for manual intervention.
Data Security and Compliance
Transitioning to new reporting solutions raises concerns about data security and compliance. Power BI consulting services prioritise data security and compliance to ensure safe and reliable reporting practices.
With robust security features and adherence to industry regulations, businesses can trust Power BI to safeguard their sensitive data and maintain compliance with data protection standards.
Scalability and Flexibility
Power BI consulting offers scalability and flexibility, making it an ideal solution for growing businesses with evolving reporting needs. As organisations expand and their data requirements evolve, Power BI allows them to scale their reporting capabilities accordingly.
Whether it's handling larger datasets, accommodating additional users, or integrating new data sources, Power BI provides the flexibility to adapt to changing business dynamics.
Conclusion
In conclusion, Power BI consulting presents businesses with a powerful toolkit to streamline their reporting processes, enabling enhanced data visualisation, real-time data analysis, customised dashboards, interactive reports, seamless integration with other tools, automated report generation, data security, compliance, scalability, and flexibility.
By leveraging these capabilities, organisations can make informed decisions, drive business growth, and stay ahead in today's competitive landscape.
We encourage readers to consider the value of Power BI consulting for their own organisations and explore the transformative impact it can have on their reporting processes.
Source From: 8 Ways Power BI Consulting Can Streamline Your Reporting Process
#power bi consultant#power bi consulting#power bi implementation#power bi service#power bi solutions
0 notes
Text
Complete Guide to Power BI Themes
As a data-driven organization, you understand the significance of presenting your insights in a visually appealing and cohesive manner. Power BI, Microsoft's business intelligence tool, offers a plethora of features to help you achieve this goal, including the ability to create and apply custom themes. In this comprehensive blog post, we'll dive into the world of Power BI themes, exploring their benefits, best practices, and practical examples to elevate your data storytelling game.

What are Power BI Themes?
Power BI themes are a powerful feature that allows you to define and apply a consistent look and feel across all your reports and dashboards. By customizing elements such as colors, fonts, and backgrounds, you can seamlessly align your data visualizations with your organization's branding guidelines. This not only enhances the professional appearance of your reports but also reinforces your brand identity, making it easier for stakeholders to recognize and engage with your data products.
Benefits of Using Power BI Themes
1. Consistency: Themes ensure a uniform appearance across all your Power BI reports, dashboards, and applications, fostering a cohesive user experience.
2. Branding: By incorporating your company's color palette, fonts, and logo, you can strengthen brand recognition and reinforce your organization's identity.
3. Professionalism: Well-designed themes elevate the overall presentation of your data, lending a polished and professional look to your reports.
4. Efficiency: Once you've created a theme, you can easily apply it to multiple reports, saving time and effort in maintaining a consistent visual language.
Creating a Custom Power BI Theme
Power BI offers a user-friendly interface for creating and managing themes. Here's a step-by-step guide to help you get started:
1. Launch the Theme Designer: Within the Power BI Desktop application, navigate to the "View" tab and select "Theme Designer."
2. Define Colors: Customize the color palette by selecting swatches and assigning specific colors to various elements, such as background, foreground, and accent colors.
3. Choose Fonts: Specify the font family, size, and weight for different text elements, including titles, labels, and data values.
4. Customize Background and Visuals: Adjust the background settings, including transparency and fill options, as well as visual properties like data point shapes and line styles.
5. Preview and Export: Use the live preview pane to visualize your changes and fine-tune the theme until you're satisfied. Once complete, export the theme as a JSON file for easy distribution and application across your organization.
Applying a Power BI Theme
Once you've created your custom theme, you can apply it to individual reports or to your entire Power BI environment. Here's how:
1. Apply to a Report: Within the Power BI Desktop application, open the desired report, navigate to the "View" tab, and select "Themes." From the drop-down menu, choose your custom theme.
2. Apply to the Environment: For a more comprehensive approach, you can deploy your theme to your Power BI environment, ensuring a consistent look and feel across all reports and dashboards. This process typically involves uploading the theme file to your Power BI service or working with a Power BI consultant or administrator.
Real-World Examples
To illustrate the power of Power BI themes, let's explore a few practical examples:
1. Corporate Branding: Imagine you're a multinational financial services company with a well-established brand identity. By creating a custom theme that incorporates your brand colors, fonts, and logos, you can ensure that all your Power BI reports and dashboards align with your corporate identity, fostering brand recognition and trust among stakeholders.
2. Industry-Specific Themes: If you operate in a highly regulated industry, such as healthcare or finance, you may have specific guidelines for data visualization and reporting. Power BI themes can help you adhere to these guidelines by defining color palettes, font choices, and visual styles that comply with industry standards.
3. Data Visualization Best Practices: Themes can also be crafted to follow data visualization best practices, ensuring that your reports are not only visually appealing but also optimized for clarity and readability. For example, you could create a theme that uses high-contrast color combinations, legible fonts, and consistent visual encodings to improve data comprehension.
Leveraging Power BI Consulting Services
While Power BI themes are relatively easy to create and apply, organizations with complex requirements or limited resources may benefit from seeking professional "power bi consulting services." Power BI consultants can provide expert guidance and support in designing, implementing, and managing custom themes tailored to your organization's specific needs.
These consultants possess in-depth knowledge of Power BI's capabilities, best practices, and industry-specific requirements, ensuring that your themes not only align with your branding guidelines but also adhere to data visualization principles and regulatory standards.
Additionally, Power BI consulting services can assist with the deployment and maintenance of themes across your entire Power BI environment, ensuring consistency and efficiency at scale.
Conclusion
Power BI themes are a powerful tool for elevating your data storytelling capabilities and reinforcing your brand identity. By leveraging custom themes, you can create visually stunning and cohesive reports that resonate with stakeholders and align with your organization's branding guidelines.
Whether you choose to tackle theme creation in-house or seek the expertise of "power bi consulting services," investing in thoughtfully designed themes can significantly enhance the impact and professionalism of your data visualizations, ultimately empowering data-driven decision-making within your organization.
0 notes
Text
Uncover Trends: Business Intelligence Tools for Pharma Excellence
Unlock the full potential of your pharmaceutical endeavors with the transformative power of data-driven insights. At ESS, we specialize in revolutionizing your Business Intelligence capabilities, tailored specifically for the pharmaceutical industry. Our mission is to equip every facet of your pharmaceutical team with real-time, comprehensive analytics that empower strategic decision-making.

Dive into trends with our business intelligence tools for pharma. Unlock actionable insights, streamline operations, and drive business success.
#Best BI software for Pharma#BI Software for Pharmaceutical Industry#BI in Pharmaceutical Industry#Best BI Software for Pharmaceutical Industry#Power BI Solutions#pharmaceutical business intelligence software#pharma business intelligence software#pharmaceutical business intelligence#business intelligence tools pharma#business intelligence strategies pharma#business intelligence strategy pharmaceutical#pharmaceutical business intelligence strategy#pharma business intelligence strategies#pharmaceutical manufacturing software in kenya#business intelligence in pharmaceutical industry#business intelligence strategy pharma#business intelligence pharmaceutical#bi pharma#bi pharmaceutical#business intelligence in pharma#pharmaceutical company software
0 notes
Text
https://www.covrize.com/power-bi-benefits-for-business/

0 notes
Text
How Power BI Solutions Support Data-Driven Digital Transformation

In the era of rapid technological advancement, businesses are increasingly turning to data-driven strategies to remain competitive, agile, and customer-focused. Digital transformation has emerged as a vital objective across industries—from manufacturing to healthcare, retail to finance. A core enabler of this transformation is business intelligence (BI), and among the most effective tools available today is the Power BI solution from Microsoft.
What Is Digital Transformation?
Digital transformation refers to the strategic integration of digital technologies into all areas of a business. It goes beyond simply digitizing processes—it involves rethinking business models, customer engagement, operations, and internal workflows with a focus on innovation, efficiency, and scalability.
A Power BI solution plays a key role in this transformation by offering organizations the ability to collect, analyze, and visualize data in real time, turning raw data into actionable intelligence.
Power BI: The Catalyst for a Data-Driven Culture
1. Unified Data Access Across the Organization
One of the biggest challenges in digital transformation is breaking down data silos. Data often resides in disparate systems—CRM, ERP, cloud storage, spreadsheets, and databases—making it difficult to consolidate for analysis.
A Power BI solution seamlessly integrates with hundreds of data sources, including Microsoft Azure, SQL Server, Google Analytics, Salesforce, SAP, and more. This allows businesses to bring together scattered data into a unified view, laying the foundation for strategic decision-making.
2. Real-Time Insights for Agile Decision-Making
Digital transformation thrives on speed and responsiveness. Power BI enables real-time analytics and live dashboards that reflect the most up-to-date metrics across operations, finance, marketing, and sales. These real-time insights empower teams to respond proactively to market shifts, customer behavior changes, and internal inefficiencies.
For instance, a retailer can track live inventory levels and sales data, allowing immediate adjustments to promotions or supply chain decisions. A Power BI solution eliminates guesswork and replaces it with data-backed responsiveness.
Transforming Business Functions with Power BI
1. Finance and Operations
Power BI simplifies complex financial data into visual dashboards that highlight performance metrics like revenue trends, cost optimization, and cash flow. Finance teams gain transparency and can perform deeper analysis with predictive models and historical comparisons.
In operations, Power BI improves process visibility by tracking KPIs such as production efficiency, resource utilization, and turnaround times—enabling lean, optimized workflows.
2. Sales and Marketing
Sales teams use Power BI dashboards to monitor pipelines, lead conversions, territory performance, and customer lifetime value. Marketing teams benefit from campaign analytics, ROI tracking, and customer engagement trends.
With a Power BI solution, both departments align more closely with real-time performance indicators, leading to faster strategy pivots and higher ROI.
3. Human Resources and Employee Engagement
HR departments leverage Power BI to monitor headcount, employee satisfaction, hiring trends, and attrition rates. This data aids in workforce planning, talent management, and organizational health assessments.
Supporting Predictive and Prescriptive Analytics
True digital transformation requires organizations to move from descriptive analytics (what happened) to predictive (what will happen) and prescriptive (what should be done). Power BI integrates with advanced analytics tools such as Azure Machine Learning and R or Python scripts.
This allows companies to build and visualize predictive models directly within their dashboards, such as forecasting sales, identifying churn risks, or optimizing resource allocation. A Power BI solution turns BI from a reactive tool into a proactive strategic asset.
Enabling a Culture of Data-Driven Decision-Making
For digital transformation to be successful, data accessibility must extend beyond the executive level. Power BI promotes the democratization of data, meaning that employees across all levels can access and interact with business intelligence relevant to their role.
With user-friendly interfaces, drag-and-drop visuals, and natural language queries, a Power BI solution empowers non-technical users to explore data, generate reports, and derive their own insights, fostering a culture where decisions are based on facts, not assumptions.
Enhancing Collaboration and Communication
Power BI seamlessly integrates with Microsoft Teams, SharePoint, and other collaboration tools, allowing cross-functional teams to share dashboards, tag team members in reports, and jointly explore data. This alignment of insights promotes collaboration and accelerates collective problem-solving.
Furthermore, automated alerts and scheduled reports keep stakeholders informed without requiring manual intervention, reinforcing transparency and communication.
Scalability and Governance
As businesses grow and their data expands, maintaining governance and data security becomes essential. Power BI offers robust governance features, including role-based access control, row-level security, activity monitoring, and compliance with industry standards like GDPR and HIPAA.
Whether deployed in a small team or across a global enterprise, a Power BI solution scales with the organization while maintaining high standards of governance.
Real-World Example
A healthcare provider undergoing digital transformation adopted a Power BI solution to consolidate patient records, monitor treatment efficiency, and track hospital performance. Within months, the organization reported:
30% improvement in patient throughput
Faster identification of care bottlenecks
Enhanced reporting for regulatory compliance
This transformation not only improved operations but also elevated patient care standards.
Conclusion
Digital transformation isn’t a one-time event—it’s a continuous evolution driven by technology, data, and a commitment to innovation. Microsoft’s Power BI solution acts as a strategic enabler in this journey by providing real-time visibility, actionable insights, and predictive capabilities.
Whether you're modernizing your business model, improving customer experiences, or optimizing internal processes, Power BI is a powerful ally in turning digital aspirations into measurable outcomes. For organizations serious about data-driven transformation, investing in a Power BI solution is a forward-looking and necessary step.
0 notes
Text
Supply chain management has always been a complex challenge, but as businesses face increasing pressure to optimize operations and reduce costs, finding efficient solutions has become even more critical. In recent years, the Microsoft Power Platform has emerged as a powerful tool for resolving common supply chain issues. By offering a suite of integrated tools that allow businesses to automate processes, analyze data, and build custom applications, the Power Platform is transforming how companies approach supply chain management. One of the core strengths of the Power Platform lies in its ability to integrate different processes and systems, helping organizations streamline their supply chain operations. Through Power Automate development services, businesses can create automated workflows that reduce manual tasks and ensure a smoother flow of information between departments. Whether it's automating inventory management, order processing, or vendor communications, Power Automate helps eliminate inefficiencies that often slow down supply chain activities. The Power Platform's capacity to offer real-time insights on supply chain performance is another important element. With Power BI development company solutions, businesses can visualize and analyze vast amounts of data, uncovering trends, bottlenecks, and areas for improvement. This data-driven approach enables supply chain managers to make more informed decisions, identify risks, and adjust strategies proactively to maintain a smooth and responsive supply chain. The ability to build customized applications customized to specific supply chain needs is another game-changing feature of the Power Platform. A Microsoft PowerApps development company can help businesses create applications that improve communication, track shipments, or manage vendor relationships, all within a unified platform. This flexibility ensures that companies can quickly adapt to changes in the market or supply chain disruptions while maintaining control over their operations. In conclusion, the Microsoft Power Platform provides businesses with a comprehensive set of tools to tackle the challenges of modern supply chain management. By leveraging Power Automate, Power BI, and PowerApps, companies can automate tasks, gain valuable insights, and develop custom solutions that enhance their overall supply chain efficiency. Embracing the Power Platform in 2024 will be key for organizations looking to stay competitive and resilient in the face of ongoing supply chain challenges.
#power bi dashboard#power bi services#power bi solutions#workflow automation solutions#power automate consulting services#power automate development services#power apps development#power apps development services#microsoft powerapps development company#microsoft powerapps consulting services#power apps developers#power apps services#microsoft powerapps service#powerapps developers#power bi consultants#power bi consulting company#power bi development services
0 notes
Text
Seamless Power BI Development Services by Shiv Technolabs
Shiv Technolabs offers Power BI development services to help you work with real-time data, custom dashboards, and business reports. Our team builds tailored BI solutions using Microsoft tools, DAX formulas, and Power Query.
We connect your data from sources like Excel, SQL Server, and Azure to create clear, visual insights. Whether you need interactive dashboards or automated reports, we design it to match your goals using Microsoft Power BI.
0 notes
Text
Unlock seamless #connectivity and empower your team with hosted #desktop solutions! 💻✨ Experience flexibility and enhance productivity—wherever your #business takes you! Discover more at https://techsolworld.com/subscriptions Call (800)998-2792. #HostedDesktop #desktopapplications #microsoft365 #microsoft365business #m365business #microsoftenterprise #microsoftenterpriseagreement
#technews#tech trends#microsoft technology update#microsoft news#microsoft partner#microsoft partner network#microsoft price increases#learn about microsoft products#learn about microsoft products and services#learn about microsoft 365 business#learn about microsoft 365#learn about dynamics 365#learn about microsoft azure#learn about microsoft power bi#learn about microsoft ai#learn about microsoft artificial intelligence#find the best microsoft partner#find the best microsoft solutions partner#find the best microsoft distributor#top microsoft distributor#list of microsoft distributors#microsoftappsource#microsoftgoldpartner#microsoftreseller#microsoftenterprise#microsoft365businessbasic#technologysolutionsworldwide#microsoft dynamics 365#microsoftlicensereseller#microsoft
1 note
·
View note