#SQL Pivot and Unpivot
Explore tagged Tumblr posts
Visit Tumblr Blog
Explore Tumblr blogs with no restrictions, modern design and the best experience.
Last Seen Tumblr Blogs


Fun Fact
Tumblr Inc. is using 66 technologies for its website.
Text
Demystifying SQL Pivot and Unpivot: A Comprehensive Guide
CodingSight
Demystifying SQL Pivot and Unpivot: A Comprehensive Guide
In the realm of data management and analysis, SQL Pivot and Unpivot operations shine as invaluable tools that enable the transformation of complex datasets into meaningful insights. This article is a deep dive into the world of SQL Pivot and Unpivot, providing a comprehensive understanding of their functions, applications, and when to employ them.
Defining SQL Pivot
SQL Pivot is a data manipulation technique that revolves around the reorganization of rows into columns, facilitating a shift from a "long" format to a more reader-friendly "wide" format. This operation streamlines data analysis and reporting, making it indispensable in numerous scenarios.
The Mechanism Behind SQL Pivot
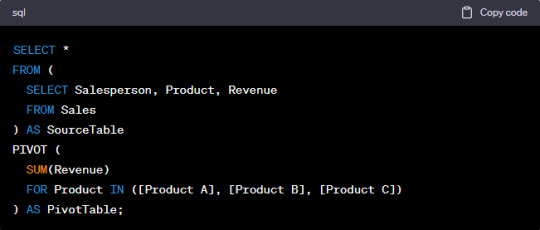
To execute a Pivot operation, you must specify the columns that should become new columns in the output, along with the values that will fill these columns. Typically, an aggregate function is employed to compute values for each new column. Here's a simple example to illustrate this:

In this instance, data is pivoted to display total revenue for each product and salesperson. The SUM function serves to aggregate the revenue values.
When to Employ SQL Pivot
SQL Pivot is the ideal choice when you need to transform data from a long format into a wide format for enhanced reporting or analysis. Common use cases include:
Generating sales and revenue reports, as exemplified above.
Creating cross-tabulated reports for survey data.
Converting timestamped data into time series data for trend analysis.
Understanding SQL Unpivot
Exploring SQL Unpivot
SQL Unpivot operates as the antithesis of Pivot. It reverses the process by transforming wide-format data back into a long format, which is more conducive to specific analytical tasks. Unpivot is used to normalize data for further processing or to simplify the integration of data from diverse sources.
The Mechanics of SQL Unpivot
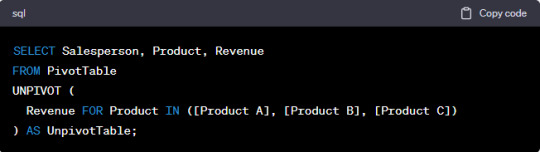
Unpivot works by selecting a set of columns to convert into rows. You must also specify the column that will store values from the chosen columns and the column that will hold the original dataset's column names. Here's an illustrative example:

In this example, the data is unpivoted, returning to its original long format. The "Product" column values become new rows, while the "Revenue" column houses the corresponding values.
When to Utilize SQL Unpivot
SQL Unpivot is indispensable when you need to normalize data or amalgamate information from multiple sources with varying structures. Common use cases include:
Analyzing survey data collected in a cross-tabulated format.
Merging data from different departments or databases characterized by distinct column structures.
Preparing data for machine learning algorithms that require specific input formats.
Conclusion
SQL Pivot and Unpivot operations emerge as indispensable assets in the realm of data manipulation and analysis. Pivot facilitates the transformation of data for improved reporting and analysis, while Unpivot streamlines data normalization and the integration of disparate information sources. Mastery of these techniques empowers data analysts, business intelligence professionals, and data scientists to unlock the full potential of their data, thereby enabling better decision-making and the revelation of hidden insights. Whether you're a seasoned data professional or just embarking on your data journey, SQL Pivot and Unpivot operations are vital tools to have at your disposal, ready to reveal the true potential of your data. Start exploring their capabilities today and embark on a data-driven journey of discovery and transformation.
0 notes
Text
Mastering Pivot and Unpivot Tables in T-SQL Server
T-SQL Server Pivot and Unpivot: Transform Data Like a Pro Hello, fellow SQL enthusiasts! In this blog post, I will introduce you to Pivot and Unpivot Tables in T-SQL – one of the most powerful data transformation techniques in T-SQL Server – Pivot and Unpivot. Pivot allows you to convert rows into columns, making your data easier to analyze and report. Unpivot performs the reverse operation by…
0 notes
Text
Explain advanced transformations using Mapping Data Flows.

Advanced Transformations Using Mapping Data Flows in Azure Data Factory
Mapping Data Flows in Azure Data Factory (ADF) provide a powerful way to perform advanced transformations on data at scale. These transformations are executed in Spark-based environments, allowing efficient data processing. Below are some of the key advanced transformations that can be performed using Mapping Data Flows.
1. Aggregate Transformation
This transformation allows you to perform aggregate functions such as SUM, AVG, COUNT, MIN, MAX, etc., on grouped data.
Example Use Case:
Calculate total sales per region.
Find the average transaction amount per customer.
Steps to Implement:
Add an Aggregate transformation to your data flow.
Choose a grouping column (e.g., Region).
Define aggregate functions (e.g., SUM(SalesAmount) AS TotalSales).
2. Pivot and Unpivot Transformations
Pivot Transformation: Converts row values into columns.
Unpivot Transformation: Converts column values into rows.
Example Use Case:
Pivot: Transform sales data by year into separate columns.
Unpivot: Convert multiple product columns into a key-value structure.
Steps to Implement Pivot:
Select a column to pivot on (e.g., Year).
Define aggregate expressions (e.g., SUM(SalesAmount)).
Steps to Implement Unpivot:
Select multiple columns to unpivot.
Define a key-value output structure.
3. Window Transformation
Allows performing operations on a specific window of rows, similar to SQL window functions.
Example Use Case:
Calculate a running total of sales.
Find the rank of customers based on their purchase amount.
Steps to Implement:
Define partitioning (e.g., partition by CustomerID).
Use window functions (ROW_NUMBER(), RANK(), LEAD(), LAG(), etc.).
4. Lookup Transformation
Used to join two datasets based on a matching key.
Example Use Case:
Enrich customer data by looking up additional details from another dataset.
Steps to Implement:
Define the lookup source dataset.
Specify the matching key (e.g., CustomerID).
Choose the columns to retrieve.
5. Join Transformation
Allows joining two datasets using various join types (Inner, Outer, Left, Right, Cross).
Example Use Case:
Combine customer and order data.
Steps to Implement:
Select the join type.
Define join conditions (e.g., CustomerID = CustomerID).
6. Derived Column Transformation
Allows adding new computed columns to the dataset.
Example Use Case:
Convert date format.
Compute tax amount based on sales.
Steps to Implement:
Define expressions using the expression builder.
7. Conditional Split Transformation
Splits data into multiple outputs based on conditions.
Example Use Case:
Separate high-value and low-value orders.
Steps to Implement:
Define conditional rules (e.g., SalesAmount > 1000).
8. Exists Transformation
Checks if records exist in another dataset.
Example Use Case:
Identify customers who have made a purchase.
Steps to Implement:
Select the reference dataset.
Define the existence condition.
9. Surrogate Key Transformation
Generates unique IDs for records.
Example Use Case:
Assign unique customer IDs.
Steps to Implement:
Define the start value and increment.
10. Rank Transformation
Assigns ranking based on a specified column.
Example Use Case:
Rank products by sales.
Steps to Implement:
Define partitioning and sorting logic.
Conclusion
Azure Data Factory’s Mapping Data Flows provide a variety of advanced transformations that help in complex ETL scenarios. By leveraging these transformations, organizations can efficiently clean, enrich, and prepare data for analytics and reporting.
WEBSITE: https://www.ficusoft.in/azure-data-factory-training-in-chennai/
0 notes
Text
Data Cleansing and Structuring
Data cleansing and structuring are crucial steps in the data preparation process, ensuring that data is accurate, consistent, and formatted for analysis or machine learning. Here's a breakdown of each step:
1. Data Cleansing
This process involves identifying and correcting errors in data, improving its quality. Key activities include:
Removing Duplicates: Identifying and eliminating repeated records in the dataset.
Handling Missing Data: Using methods like imputation (filling missing values), deletion, or flagging to handle null or missing entries.
Correcting Inconsistent Data: Standardizing formats (e.g., date formats, address formats), fixing spelling mistakes, or converting numerical data into the right scale (e.g., removing currency symbols).
Outlier Detection: Identifying and handling data points that deviate significantly from the rest of the data. This might involve removing or correcting them depending on their context.
Noise Filtering: Removing irrelevant or meaningless data that may distort analysis (e.g., stopwords in text data).
2. Data Structuring
Data structuring involves organizing data into a format that is easy to analyze or use for machine learning. This step focuses on making raw data more usable:
Normalization: Scaling features (e.g., values between 0 and 1) to bring them to the same level of magnitude, which helps in various machine learning models.
Encoding: Converting categorical data (e.g., gender, location) into numerical form using techniques like one-hot encoding or label encoding.
Data Aggregation: Combining data from different sources or summary statistics (e.g., sum, average) into a cohesive form.
Feature Engineering: Creating new variables from existing data (e.g., extracting the year from a date field, categorizing data into bins).
Reshaping Data: Converting the dataset into a structured format like tables (e.g., pivoting or unpivoting data, creating time series).
Both of these processes are often done using programming tools like Python (with libraries like pandas, numpy, and scikit-learn for machine learning) or R, and may also involve using SQL for database-related cleaning tasks.
Do you have a specific dataset you're working with, or are you exploring general techniques?
0 notes
Text
Functions and Benefits of Power Query M | Infographic
Power Query M is a formula language used to transform and shape data in Power BI. It provides a flexible and powerful way to clean, combine, and manipulate data from various sources.
Here are the key steps to transform data using Power Query M in Power BI:
Load Data: Import your data source into Power BI using the "Get Data" option. You can connect to various sources like Excel, CSV, SQL databases, and more.
Edit Query: Once your data is loaded, right-click on the query name and select "Edit Query." This will open the Power Query Editor where you can apply transformations.
Apply Transformations: Use the available functions and operators in Power Query M to perform transformations like:
Cleaning: Remove duplicates, handle null values, and correct data types.
Combining: Merge multiple tables based on common columns.
Reshaping: Pivot or unpivot columns, add or remove columns.
Filtering: Apply conditions to extract specific data.
Sorting: Arrange data in ascending or descending order.
Grouping: Group data by specific columns and calculate aggregations.
Apply Steps: As you apply transformations, Power Query M generates a series of steps. You can edit or delete these steps to refine your data.
Close and Apply: When you're satisfied with the transformations, click "Close & Apply" to apply the changes to your Power BI report.
Found this interesting? Then check out our detailed Infographic on the use of Power Query M, and gain insights related to its benefits, market share, popular BI tools, and so on.

0 notes
Text
Use of Power Query in Power BI

Power Query in Power BI is a powerful tool used for data transformation and preparation before visualizing the data. It provides an intuitive interface to connect, combine, and refine data from various sources into a coherent, structured dataset ready for analysis. Excel Training in Mumbai often covers how to use Power Query to effectively prepare and transform data. Here's an overview of how Power Query is used in Power BI:
1. Connecting to Data Sources
Importing Data: Power Query can connect to various data sources like Excel files, databases (SQL Server, Oracle, etc.), online services (Azure, SharePoint, etc.), and even web pages.
Multiple Data Sources: You can combine data from multiple sources into a single dataset, which is especially useful when dealing with complex data architectures.
2. Data Transformation
Data Shaping: Power Query allows you to shape your data by removing unnecessary columns, renaming columns, filtering rows, and sorting data.
Data Cleansing: It provides tools to clean your data by handling missing values, removing duplicates, splitting and merging columns, and correcting data types.
Merging and Appending: You can merge (join) tables based on common columns or append (union) tables to create a unified dataset.
Conditional Columns: Power Query enables creating conditional columns based on specific logic, similar to using IF statements in Excel.
3. Advanced Data Manipulation
Grouping and Aggregation: You can group data by specific columns and aggregate data (e.g., summing, averaging) to create summary tables.
Pivoting and Unpivoting: Power Query allows pivoting rows to columns and vice versa, transforming your data into a more suitable structure for analysis.
Custom Columns: Using the M language (Power Query's formula language), you can create custom columns with complex calculations and logic.
4. Data Loading
Load to Data Model: Once the data is transformed, it can be loaded into the Power BI data model, where it can be used for creating reports and visualizations.
Direct Query vs. Import Mode: Power Query supports both Direct Query (where data is queried directly from the source) and Import Mode (where data is imported into Power BI for analysis).
5. Automation and Reusability
Query Dependencies: Power Query automatically tracks dependencies between queries, ensuring that changes in one query reflect in others that depend on it. This feature is crucial for maintaining accurate and up-to-date data models, especially in complex projects.
Reusable Steps: All transformation steps are recorded and can be modified or reused across different queries, ensuring consistency and efficiency. This capability allows users to standardize their data preparation processes and streamline workflows, which is often highlighted in Advanced Excel Classes in Mumbai to help professionals optimize their data management tasks
6. Integration with Other Power BI Features
Parameters: You can create parameters in Power Query that allow dynamic filtering and customization of data sources and queries.
Templates: Power Query transformations can be saved as templates and reused across different Power BI reports or shared with others.
7. Data Profiling
Column Quality and Distribution: Power Query provides tools to profile your data, showing column quality, value distribution, and statistics to help identify data issues early.
Error Handling: It highlights errors and outliers, allowing you to manage and clean data before loading it into the data model.
8. Performance Considerations
Query Folding: Power Query attempts to push data transformations back to the data source (query folding) whenever possible, optimizing performance by reducing the amount of data loaded into Power BI.
Example Use Cases
Sales Data Preparation: Importing sales data from multiple regional Excel files, cleaning it, and consolidating it into a single dataset for analysis.
Web Scraping: Extracting data from a web page, transforming it into a structured format, and using it in a Power BI report.
Data Integration: Combining data from an SQL Server database and a SharePoint list, transforming it, and creating a unified data model for reporting.
Steps to Access Power Query in Power BI
Open Power BI Desktop.
Go to the "Home" tab.
Click on "Transform Data" to open the Power Query Editor.
Use the various tools and options available in the Power Query Editor to connect to data sources, transform data, and prepare it for analysis.
Power Query is essential for anyone looking to perform robust data transformation and preparation in Power BI. It ensures your data is clean, well-structured, and ready for analysis, enabling better insights and decision-making. Learning Power Query is a key part of Advanced Excel Training in Mumbai, as it equips individuals with the skills needed to handle data efficiently and create powerful data models.
For more information, contact us at:
Call: 8750676576, 871076576
Email:[email protected]
Website:www.advancedexcel.net
#Excel Training in Mumbai#Advanced Excel Classes in Mumbai#Advanced Excel Training in Mumbai#advanced excel
0 notes
Text

Top 8 Data Analyst Courses In Thane With Practical Training
In today's world, analytics is not just the way of the future; it's the way of the present. Industries across the board, from airline route planning to manufacturing plant maintenance, rely on analytics for critical insights and decision-making. Even traditionally non-tech sectors like retail are leveraging analytics to enhance customer loyalty and personalize offerings. With the increasing adoption of analytics, possessing data skills has become a necessity rather than a luxury.
If you're looking to enhance your data analytics skills, Thane offers top-notch courses with practical training. Here's a curated list of the top 8 institutes offering data analyst courses in Thane:
Before we jump into our list of top data analytics courses in Thane, let's first explore what data analytics is and why it's crucial in today's business environment.
List of Institutes in Thane That Provide Data Analyst Courses
DeveLearn
DeveLearn, a prominent institute in Thane, offers comprehensive data analytics courses designed to provide students with practical skills and industry-relevant knowledge. Our curriculum focuses on hands-on training, data visualization techniques, and statistical analysis methods, ensuring students develop a strong foundation in data analytics. With experienced faculty and modern learning resources, we provides an ideal environment for aspiring data analysts to thrive and excel in the dynamic field of data analytics. Data Analyst course in Thane are available in both online and classroom formats for your convenience.
Our Course Curriculum:
Advanced Excel
The Advanced Excel course focuses on teaching advanced formulas, functions, data visualization, Pivot tables, and charts. It aims to enhance Excel skills for improved data handling and analysis in professional roles.
Data Cleaning and Preparation
Formulas and Functions
Pivot tables and Pivot charts
Data Analysis Tools
Power Query
Data Analysis and Power Pivot
Advanced Charting and Visualization
Macros and VBA
Data Annalysis with What If Analysis
Reporting and Dashboards
Python
This Python course is designed specifically for data analysts to harness Python's capabilities in data manipulation, exploration, visualization, and analysis. It equips learners with essential skills and libraries necessary for data-driven decision-making.
Python Programming Language
Data Manipulation Libraries
Data Visualization Libraries
Jupyter Notebooks
Data Cleaning and Preprocessing
SQL Integration
Statistical Analysis
Data Analysis Workflow
Web Scraping
NumPy
SQL
The SQL course provides a thorough understanding of SQL, a foundational skill for managing data and querying relational databases. It serves as an excellent starting point for beginners, enabling them to extract valuable insights and make data-driven decisions. Through hands-on learning, this course equips data analysts with the skills to efficiently query databases, perform complex data transformations, and conduct advanced data analysis using SQL.
SQL Basics
Data Manipulation
Data Aggregation and Grouping
Data Joins and Relationships
Subqueries and Derived Tables
Data Cleaning and Preparation
Window Functions (Analytical Functions)
Time Series Analysis
Pivoting and Unpivoting Data
Data Visualization with SQL
Tableau/Power BI
Tableau/Power BI course focuses on teaching users how to utilize Tableau and Power BI effectively. It covers creating interactive dashboards, charts, and reports to enhance data storytelling skills.
Data Connection and Data Source
Data Transformation and Data Modeling
Data Visualization Basics
Creating Basic Visualizations
Interactive Dashboards
Advanced Visualizations
Calculated Fields and Expressions
Table Calculations
Time Series Analysis
Level of Detail (LOD) Expressions
Course Details
Data Analyst Course in Thane
Eligibility Criteria = Fresher + Graduated
Course Duration - 1 year 2 Months
Online & Offline Training
Data Analytics Tools Covered:
R
Power BI
SQL
Python
Tableau Excel
Why Choose DeveLearn for Data Analytics Course in Thane?
🌟 Industry-Expert Instructors: Learn from seasoned professionals with hands-on experience, gaining valuable real-world insights.
📊 Cutting-Edge Curriculum: Stay updated with the latest tools and techniques in data analytics, ensuring readiness for the evolving industry.
💼 Practical Projects: Apply knowledge through hands-on projects reflecting real industry scenarios, boosting confidence and skills.
🌐 Networking Opportunities: Connect with a diverse group of learners, alumni, and industry leaders, expanding professional networks.
🔒 Seamless Career Transformation: DeveLearn offers top Data Analytics Course in Thane with Placement Assistance, facilitating a smooth entry into the dynamic analytics field.
📈 Proven Success: Benefit from a track record of successful graduates securing roles at leading companies, leveraging their data analytics expertise.
Read more - Top 8 Data Analyst Courses In Thane
0 notes
Text
What is Power Query in Power BI?
Power Query is a data transformation and preparation tool in Power BI, a business intelligence and data visualization platform developed by Microsoft. It provides a powerful and intuitive interface for connecting to various data sources, transforming and shaping data, and loading it into Power BI for analysis and visualization. Power Query is an essential component of Power BI that enables users to clean, reshape, and enrich their data easily, allowing them to extract valuable insights and make informed business decisions.
At its core, Power Query simplifies the process of data acquisition and transformation by providing a visual interface for performing common data preparation tasks. Users can connect to a wide range of data sources, including databases, files, web services, and online sources, such as Excel spreadsheets, SQL databases, CSV files, SharePoint lists, Salesforce, and more. Power Query supports both structured and semi-structured data formats, enabling users to work with diverse data sources seamlessly.
Once connected to a data source, users can use Power Query's intuitive interface to perform various data transformation operations. Power Query offers a wide range of transformation functions and operations, including filtering, sorting, grouping, aggregating, pivoting, unpivoting, merging, appending, and splitting data. Users can apply these transformations interactively using a graphical user interface, without writing any code, making it accessible to users with varying levels of technical expertise. Apart from it by obtaining Power BI Certification, you can advance your career in Power BI. With this course, you can demonstrate your expertise in Power BI Desktop, Architecture, DAX, Service, Mobile Apps, Reports, many more fundamental concepts, and many more critical concepts among others.
One of the key features of Power Query is its ability to create reusable data transformation steps, known as queries or queries. Users can define a sequence of transformation steps in Power Query and save them as a query, which can then be applied to other datasets or refreshed automatically when the underlying data changes. This allows users to build a library of reusable data transformation logic, promoting consistency and efficiency in data preparation workflows.
Power Query also offers advanced data cleaning and transformation capabilities, such as data type conversion, error handling, data deduplication, and custom column creation. Users can apply sophisticated data cleansing techniques to address common data quality issues, such as missing values, inconsistent formatting, and outliers, ensuring that the data is accurate, reliable, and consistent for analysis.
Furthermore, Power Query supports data enrichment and augmentation through integration with external data sources and services. Users can leverage Power Query's integration with Azure services, such as Azure Data Lake Storage, Azure SQL Database, and Azure Blob Storage, to access and combine data from cloud-based sources seamlessly. Additionally, Power Query provides connectors to popular third-party data services, such as Google Analytics, Facebook, and LinkedIn, allowing users to enrich their datasets with external data for deeper analysis.
Another notable feature of Power Query is its support for data profiling and exploration. Power Query includes built-in data profiling capabilities that enable users to analyze and understand the structure, distribution, and quality of their data quickly. Users can generate summary statistics, histograms, and frequency distributions for columns in their dataset, helping them identify patterns, anomalies, and data quality issues effectively.
In summary, Power Query is a powerful and versatile data transformation tool in Power BI that simplifies the process of acquiring, cleaning, and shaping data for analysis and visualization. With its intuitive interface, rich set of transformation functions, support for reusable queries, integration with external data sources, and data profiling capabilities, Power Query empowers users to prepare high-quality, actionable insights from their data, enabling them to drive informed business decisions and achieve better outcomes.
0 notes
Text
Question-74: How do you perform pivot and unpivot operations in Oracle SQL?
Interview Questions on Oracle SQL & PLSQL Development: For more questions like this: Do follow the main blog #oracledatabase #interviewquestions #freshers #beginners #intermediatelevel #experienced #eswarstechworld #oracle #interview #development #sql
Answer: Performing pivot and unpivot operations in Oracle SQL allows you to transform data from a row-based format to a column-based format and vice versa. Here’s a detailed explanation: Definition: —> Pivot: Pivot operation converts rows into columns, creating a cross-tabulation or summary table. It rotates the unique values from one column into multiple columns. —> Unpivot: Unpivot…

View On WordPress
#beginners#development#eswarstechworld#Experienced#freshers#intermediatelevel#interview#interviewquestions#oracle#oracledatabase#sql
0 notes
Text
What is M language in Power BI?
In Power BI, the M language, also known as Power Query Formula Language, is a powerful data transformation and mashup language. It is used to perform data extraction, transformation, and loading (ETL) tasks within the Power Query Editor, a data preparation tool integrated into Power BI.
The M language is designed to handle diverse data sources, allowing users to connect, extract, transform, and load data from various file formats, databases, web services, and APIs. It provides a rich set of functions and operators to perform data manipulation, filtering, aggregation, merging, and more. By obtaining Power BI Certification, you can advance your career in Power BI. With this course, you can demonstrate your expertise in Power BI Desktop, Architecture, DAX, Service, Mobile Apps, Reports, many more fundamental concepts, and many more critical concepts among others.
Power Query uses a functional programming approach, where users define a series of steps to transform and shape the data. These steps are written in the M language and are executed sequentially to create a clean and structured dataset for analysis and visualization in Power BI.
Some key capabilities of the M language in Power Query include:
Data Source Connectivity: M language supports connecting to a wide range of data sources, including databases (such as SQL Server, Oracle, and MySQL), files (such as CSV, Excel, and JSON), web services, and more.
Data Transformation: M language provides numerous functions to transform data, such as filtering rows, removing duplicates, sorting, merging or appending data, splitting columns, aggregating data, and applying transformations like pivoting and unpivoting.
Custom Functions: Users can define their own reusable functions in M language, enabling the creation of complex transformations or calculations that can be applied across multiple datasets.
Data Cleaning and Wrangling: M language offers functions for data cleaning tasks, such as removing null values, handling missing data, replacing values, and performing text manipulation or data type conversions.
Query Folding: M language has the ability to push transformations back to the data source, allowing for efficient query execution and reducing the amount of data transferred between the data source and Power BI.
The M language is used within the Power Query Editor in Power BI Desktop and can also be utilized in other Microsoft products like Excel and Power Automate (formerly known as Microsoft Flow). It empowers users to shape and transform their data in a flexible and intuitive way, enabling them to create robust and accurate data models for analysis and visualization.
In summary, the M language in Power BI is a powerful data transformation and mashup language used within the Power Query Editor. It enables users to connect to various data sources, perform data cleaning and wrangling, apply transformations, and shape the data into a structured format suitable for analysis in Power BI.
0 notes
Text
Unlocking Data Insights with SQL Pivot and Unpivot: A Comprehensive Guide
CodingSight
In today's data-driven world, the ability to transform and analyze data efficiently is crucial for making informed decisions. SQL Pivot and Unpivot operations are powerful tools that can help you restructure and manipulate data, enabling you to extract valuable insights from complex datasets. In this article, we will delve into the world of SQL Pivot and Unpivot, explaining what they are, how they work, and when to use them.
What is SQL Pivot?
SQL Pivot is a data transformation operation that allows you to rotate rows into columns, essentially changing the data's orientation. This is particularly useful when you have data in a "long" format and need to display it in a more readable "wide" format. Pivot can simplify data analysis and reporting, making it a valuable technique in various scenarios.
How does SQL Pivot Work?
To perform a Pivot operation, you need to specify the columns that you want to become new columns in the output, along with the values that will populate those columns. You typically use an aggregate function to calculate the values for each new column. Here's a simplified example:
In this example, we are pivoting the data to display total revenue for each product and each salesperson. The SUM function is used to aggregate the revenue values.
When to Use SQL Pivot
SQL Pivot is ideal when you need to transform data from a long format to a wide format for reporting or analysis. Common use cases include:
Sales and revenue reporting, as demonstrated above.
Creating cross-tabular reports for survey data.
Converting timestamped data into time series data for trend analysis.
Understanding SQL Unpivot
What is SQL Unpivot?
SQL Unpivot is the reverse of Pivot. It allows you to transform data from a wide format back into a long format, which can be more suitable for certain analytical tasks. Unpivot can be used to normalize data for further processing or to simplify data integration from multiple sources.
How does SQL Unpivot Work?
Unpivot works by selecting a set of columns to transform into rows. You also specify the column that will hold the values from the selected columns and the column that will hold the column names from the original dataset. Here's a simplified example:
In this example, we are unpivoting the data to revert to the original long format. The "Product" column values become the new rows, and the "Revenue" column holds the corresponding values.
When to Use SQL Unpivot
SQL Unpivot is valuable when you need to normalize data or when you want to combine data from different sources with varying structures. Some common use cases include:
Analyzing survey data collected in a cross-tabular format.
Combining data from different departments or databases with different column structures.
Preparing data for machine learning algorithms that require a specific input format.
Conclusion
SQL Pivot and Unpivot operations are indispensable tools for data transformation and analysis. Pivot allows you to reshape data for clearer reporting and analysis, while Unpivot helps you normalize data and integrate information from diverse sources. By mastering these techniques, you can harness the full potential of your data, enabling better decision-making and insights. Whether you are a data analyst, a business intelligence professional, or a data scientist, these SQL operations will prove to be valuable assets in your toolkit. Start exploring their capabilities today, and unlock the hidden potential of your data.
0 notes
Text
Oracle Database SQL Training
Oracle Database SQL course is an online course that assists you in preparing ng for the OCP exam. We offer a diverse oracle database SQL exam. This course covers all the features of SQL like editing and making running, running reports, transactional writing, writing short p, programs, and more. We have a batch of certified oracle trainers to assist you. It is a practically based SQL online course to help you have a full grip on Oracle database SQL.
Restricting and Sorting Data
Limit the rows that are retrieved by a query
Sort the rows that are retrieved by a query
Use substitution variables
Use the SQL row limiting clause
Create queries using the PIVOT and UNPIVOT clause
Use pattern matching to recognize patterns across multiple rows in a table
Using the Set Operators
Explain set operators
Use a set operator to combine multiple queries into a single query
Control the order of rows returned
Using Single-Row Functions to Customize Output
Describe various types of functions that are available in SQL
Use character, number, and date and analytical (PERCENTILE_CONT, STDDEV, LAG, LEAD) functions in SELECT statements
Use conversion functions
Manipulating Data
Describe the DML statements
Insert rows into a table
Update rows in a table
Delete rows from a table
Control transactions
Reporting Aggregated Data Using the Group Functions
Identify the available group functions
Use group functions
Group data by using the GROUP BY clause
Include or exclude grouped rows by using the HAVING clause
Using DDL Statements to Create and Manage Tables
Categorize the main database objects
Review the table structure
Describe the data types that are available for columns
Create tables
Create constraints for tables
Describe how schema objects work
Truncate tables, and recursively truncate child tables
Use 12c enhancements to the DEFAULT clause, invisible columns, virtual columns and identity columns in table creation/alteration
Displaying Data from Multiple Tables
Use equijoins and nonequijoins
Use a self-join
Use outer joins
Generate a Cartesian product of all rows from two or more tables
Use the cross outer apply clause
Creating Other Schema Objects
Create simple and complex views with visible/invisible columns
Retrieve data from views
Create, maintain and use sequences
Create private and public synonyms
Using Subqueries to Solve Queries
Use subqueries
List the types of subqueries
Use single-row and multiple-row subqueries
Create a lateral inline view in a query
Managing Objects with Data Dictionary Views
Query various data dictionary views
EXTRACT Managing Schema Objects
Manage constraints
Create and maintain indexes including invisible indexes and multiple indexes on the same columns
Create indexes using the CREATE TABLE statement
Create function-based indexes
Drop columns and set column UNUSED
Perform flashback operations
Create and use external tables
Controlling User Access
Differentiate system privileges from object privileges
Grant privileges on tables and on a user
View privileges in the data dictionary
Grant roles
Distinguish between privileges and roles
Manipulating Large Data Sets
Manipulate data using subqueries
Describe the features of multitable INSERTs
Use multitable inserts
Unconditional INSERT
Pivoting INSERT
Conditional ALL INSERT
Conditional FIRST INSERT
Merge rows in a table
Track the changes to data over a period of time
Use explicit default values in INSERT and UPDATE statements
Managing Data in Different Time Zones
Use various date time functions
Tz_offset
from_tz
to_timestamp
to_timestamp_tz
to_yminterval
to_dsinterval
current_date
current_timestamp
localtimestamp
dbtimezone
sessiontimezone
Generating Reports by Grouping Related Data
Use the ROLLUP operation to produce subtotal values
Use the CUBE operation to produce crosstabulation values
Use the GROUPING function to identify the row values created by ROLLUP or CUBE
Use GROUPING SETS to produce a single result set
Retrieving Data Using Subqueries
Use multiple-column subqueries
Use scalar subqueries
Use correlated subqueries
Update and delete rows using correlated subqueries
Use the EXISTS and NOT EXISTS operators
Use the WITH clause
Hierarchical Retrieval
Interpret the concept of a hierarchical query
Create a tree-structured report
Format hierarchical data
Exclude branches from the tree structure
Regular Expression Support
Use meta Characters
Use regular expression functions to search, match and replace
Use replacing patterns
Use regular expressions and check constraints
International Student Fee : 300 USD | 395 CAD | 1,125 AED | 1,125 SAR
Flexible Class Options
Corporate Group Training | Fast-Track
Week End Classes For Professionals SAT | SUN
Online Classes – Live Virtual Class (L.V.C), Online Training
0 notes
Text
Q60. What is SubQuery? What is the difference between Standalone SubQuery, Co-Related SubQuery, and Nested SubQuery in SQL? Q61. What is a Temporary Table or Temp Table in SQL? What is the difference between Local Temp Table and Global Temp Table? Q62. What is Derived Table or DT in SQL? How DT is different from Common Table Expression (CTE) in SQL? Q63. What is Common Table Expression or CTE in SQL? Q64. What is Table Variable? What is the difference between Table Variable and Temp Table in SQL? Q65. What is Table-Valued Type? What is the difference between Table Variable and Table-Valued Type in SQL? Q66. What is the difference between PIVOT and UNPIVOT Functions in SQL? Q67. What is the CASE statement in SQL? Can you use the CASE statement in the WHERE clause?
#sqlinterviewquestions#mostfrequentlyaskedsqlinterviewquestions#sqlinterviewquestionsandanswers#interviewquestionsandanswers#techpointfundamentals#techpointfunda#techpoint
1 note
·
View note
Text
Data Analyst Course Near Me, Mumbai

Are you in search of the ideal data analyst course near you in Mumbai? If you're struggling to find the perfect fit, look no further. Explore your potential through our Data Analytics certification course in Mumbai. Our practical curriculum, expertly designed, provides you with the essential skills and knowledge needed to excel in the field. Engage in real-world projects, creating a comprehensive portfolio that impresses employers and establishes your presence in the competitive IT industry. Join us on a journey toward a promising career in data analytics.
Data Analyst Course in Mumbai Overview
Are you ready to become a data analytics expert? Our collaborative course with IBM is designed to guide you through the essentials of data analysis without the jargon. Learn the latest analytics tools, SQL, and programming languages like R and Python. Gain hands-on experience in creating data visualizations and applying statistical and predictive analytics in real-world business scenarios.
Course Highlights:
Industry-Backed Learning
Practical Skill Development
Versatile Language Training: Master SQL, R, and Python
Visualization Techniques
Statistical Analysis
Live Sessions by Industry Experts
Certification for Career Advancement
Skills You’ll Learn
Enroll in our online & offline data analytics training course in Mumbai, which covers a wide range of skills, including:
Python
Data Analysis
SQL
Data Visualisation
Advanced Excel
Tools Covered
You will gain proficiency in employing a diverse set of tools and technologies commonly utilized by data analysts, including:
Excel
MySQL
Tableau
Python & R
Business Statistics
Power BI
Data Analyst Course in Mumbai Curriculum
Begin a transformative journey with our Data Analyst Course in Mumbai, thoughtfully designed to provide essential skills for the dynamic field of data analytics. This hybrid program offers flexibility with both online and offline learning options, ensuring accessibility for all. Our curriculum covers a spectrum of topics, including statistical analysis, data visualization, programming languages like Python and R, database management, and the use of cutting-edge tools such as Tableau and Power BI. Engage in real-world projects to refine practical skills and construct a compelling portfolio. What sets us apart is our commitment to your success. We offer a data analyst course in Mumbai with placement assistance to ensure you're well-prepared for a rewarding career in data analysis. Join us and explore the world of data analytics for a promising professional journey.
1. Advanced Excel
The Advanced Excel course teaches advanced formulas, functions, data visualization, Pivot tables, and charts, enhancing Excel skills for better data handling and analysis in professional roles.
Data Cleaning and Preparation
Formulas and Functions
Pivot tables and Pivot charts
Data Analysis Tools
Power Query
Data Analysis and Power Pivot
Advanced Charting and Visualization
Macros and VBA
Data Analysis with What If Analysis
Reporting and Dashboards
2. Python
This Python course is tailored for data analysts to utilize Python's power for data manipulation, exploration, visualization, and analysis, equipping them with essential skills and libraries for data-driven decision-making.
Python Programming Language
Data Manipulation Libraries
Data Visualization Libraries
Jupyter Notebooks
Data Cleaning and Preprocessing
SQL Integration
Statistical Analysis
Data Analysis Workflow
Web Scraping
NumPy
3. SQL
The SQL course offers a comprehensive understanding of SQL, a fundamental skill for data management and querying relational databases, making it an excellent starting point for beginners.
SQL Basics
Data Manipulation
Data Aggregation and Grouping
Data Joins and Relationships
Subqueries and Derived Tables
Data Cleaning and Preparation
Window Functions (Analytical Functions)
Time Series Analysis
Pivoting and Unpivoting Data
Data Visualization with SQL
4. Tableau/Power BI
This course teaches users how to use Tableau and Power BI to create interactive dashboards, charts, and reports, enhancing their data storytelling skills.d data visualization tools. Data analysts play a crucial role in transforming raw data into meaningful insights, and this course aims to equip them with the skills to create impactful visualizations that facilitate data-driven decision-making. Participants will learn to extract, clean, and visualize data effectively, enabling them to communicate complex information visually and intuitively.
Data Connection and Data Source
Data Transformation and Data Modeling
Data Visualization Basics
Creating Basic Visualizations
Interactive Dashboards
Advanced Visualizations
Calculated Fields and Expressions
Table Calculations
Time Series Analysis
Level of Detail (LOD) Expressions
Data Analyst Certificate
Unlock the potential of data with our comprehensive Data Analyst Certification Course in Mumbai. Earn the valued Develearn Certificate, proving your practical skills and understanding in data analysis. This certification is more than just a badge; it signifies your hands-on expertise and knowledge of essential data analysis concepts, tools, and methods.
#Data Analyst Certification Course in Mumbai#Data Analyst Course in Mumbai#Data Analyst Course#Data Analyst institute in Mumbai
0 notes
Photo

DATA INTEGRATION WITH ORACLE WAREHOUSE BUILDERABOUT THIS COURSELearn concepts of Oracle Warehouse Builder 11g.
This training starts you at the beginner level and concludes with knowledge of advanced concepts and end-to-end implementation of data integration and ETL through Oracle Warehouse Builder.COURSE DETAILS & CURRICULUMInstalling and Setting Up the Warehouse Builder Environment
Oracle Warehouse Builder Licensing and Connectivity Options
Supported operating systems (OS), sources, targets, and optional components
What Is Oracle Warehouse Builder?
Using the Repository Assistant to Manage Workspaces
OWBSYS Schema
Using OWB 11.2 with Database 10g R2
Installing Oracle Warehouse Builder 11.2
Basic Process Flow of Design and Deployment
Getting Started with Warehouse Builder
Locations Navigator and Global Navigator panels
Logging In to OWB Design Center
Overview of Objects within a Project
Setting Projects Preferences: Recent Logons
OWB Projects
Overview of the Design Center
Organizing Metadata Using Foldering
Overview of Objects within an Oracle Module
Understanding the Warehouse Builder Architecture
Overview of Configurations, Control Centers, and Locations
Warehouse Builder Development Cycle
Registering an Oracle Workflow User
Registering DB User as an OWB User
Roles and Privileges of Warehouse Builder Users
Creating Target Schemas
Overview of the Architecture for Design, Deployment, Execution
Defining Source Metadata
Difference Between Obtaining Relational and Flat File Source Metadata
Data warehouse implementation: Typical steps
Creating an Oracle Module
Sampling Simple Delimited File
Creating Flat File Module
Sampling Multi-record Flat File
Selecting the Tables for Import
Defining ETL Mappings for Staging Data
Mapping Editor Interface: Grouping, Ungrouping, and Spotlighting
Creating External Tables
Purpose of a Staging Area
Set loading type and target load ordering
Define OWB Mappings
Levels of Synchronizing Changes
Using the Automapper in the Mapping Editor
Create and Bind process
Using the Data Transformation Operators
Lookup Operator: Handling Multiple Match Rows
Component Palette
Using the Aggregator, Constant, Transformation, and Pre/Post Mapping Operators
Pivot and Unpivot Operators
Using the Set, Sequence, and Splitter Operators
Using the Subquery Filter Operator
Using a Joiner
Deploying and Executing in Projects Navigator Panel
Cleansing and Match-Merging Name and Address Data
Name and Address Data Cleansing
Using the Match Merge Operator in a Mapping
Name and Address Software Providers
Reviewing a Name and Address Mapping
Settings in the Name and Address Operator
Consolidating Data Using the Match Merge Operator
Name and Address Server
Integrating Data Quality into ETL
Using Process Flows
Types of Activities: Fork, And, Mapping, End Activity
Creating Transitions Between Activities
Some More Activities: Manual, SQLPLUS, Email
Process Flow Concepts
Creating a Process Flow Module, a Process Flow Package and a Process Flow
Generating the Process Flow Package
Deploying and Reporting on ETL Jobs
Deployment Concepts
Repository Browser
Starting OWB Browser Listener and the Repository Browser
Browsing Design Center and Control Center Reports
Setting Object Configuration
Logical Versus Physical Implementation
Invoking the Control Center Manager
Deploy Options and Preferences
Using the Mapping Debugger
Preparing the testing environment and test data
Overview of the Mapping Debugger
Initializing a Mapping Debugging Session
Evaluating the flow of data to detect mapping errors
Setting breakpoints and watch points
Enhancing ETL Performance
Performance-Related Parameters in ETL Design
Configuring Indexes, Partitions, Constraints
Setting Tablespace Properties and Gathering Schema Statistics
Configuring Mappings for Operating Modes, DML Error Logging, Commit Control, and Default Audit Levels
Enabling Partition Exchange Loading (PEL) for Targets
Enabling Parallelism and Parallel DML
Performance-Related Parameters in Schema Design
Performance Tuning at Various Levels
Managing Backups, Development Changes, and Security
Overview of Metadata Loader Utilities (MDL)
Graphical UI for Security Management
Managing Metadata Changes by Using Snapshots
Object-Level Security
Using Change Manager
Version Management of Design Objects
Setting Security Parameters
Integrating with Oracle Business Intelligence Enterprise Edition (OBI EE)
Converting the UDML File for OBI EE
Oracle BI Admin and Answers Tool
Integrating with OBI EE and OBI SE
Business Justification: Tools Integration
Deploying the BI Module
Transferring BI Metadata to OBI EE Server
Setting Up the UDML File Location
Deriving the BI Metadata (OBI EE)
Administrative Tasks in Warehouse Builder
Multiple Named Configurations: Why and How
Enterprise ETL License Extends Core In-Database ETL
Creating an OWB Schedule
Using Configuration Templates
Using Multiple Named Configurations
Steps for Setting Up OWB in a RAC Environment
Managing Metadata
Using Pluggable Mappings
Advanced Activity Types in Process Flows
Using the Change Propagation Dialog
User-Defined Properties, Icons, and Objects
Invoking Lineage and Impact Analysis
Using Lineage and Impact Analysis Diagrams
Heterogeneous Predefined SQL Transformations
Native Relational Object Support
Accessing Non-Oracle Sources
Defining New Integration Platforms in OWB
Location of Seeded Code Templates
Extensible Framework of OWB 11g Release 2
Benefits of Extensible Code Templates
Creating New Code Templates
Designing Mappings with the Oracle Data Integration Enterprise Edition License
Convert a Classic Mapping to a CT Mapping That Utilizes Data Pump
Execution View Versus Logical View
Traditional Versus Code Template (CT) Mappings
Assigning a Code Template to an Execution Unit
Execution Units in a CT Mapping
CT Mappings Deploy to Control Center Agents
Right-Time Data Warehousing with OWB
Starting CDC Capture Process
What Refresh Frequency Does OWB Support
Building a Trickle Feed Mapping
What Is Meant by Real-Time Data Warehousing
Using Advanced Queues in Trickle Feed Mappings
Using CDC Code Templates in Mappings for Change Data Capture
Defining Relational Models
Defining a Cube
Using the Create Time Dimension Wizard
Binding Dimension Attributes to the Implementation Table
Defining Dimensions Using Wizards and Editors
Specifying a Cube's Attributes and Measures
Designing Mappings Using Relational Dimensions and Cubes
Defining Dimension Attributes, Levels, and Hierarchies
More Relational Dimensional Modeling
Initial Versus Incremental Data Warehouse Loads
Capturing Changed Data for Refresh
Creating a Type 2 Slowly Changing Dimension
Updating Data and Metadata
Choosing the DML Load Type
Support for Cube-Organized Materialized Views
How OWB Manages Orphans
Setting Loading Properties
Modeling Multidimensional OLAP Dimensions and Cubes
Dimensional Modeling Using OWB
Multidimensional Data Types
What Is OLAP
OWB Calculated Measures
Analytic Workspace
For any questions, simply contact us at -
Call: +44 7836 212635 WhatsApp: +44 7836 212635 Email: [email protected] https://training.uplatz.com
0 notes
Link
SQL Server step by step for beginners ##Edx #Beginners #Server #SQL #Step SQL Server step by step for beginners It has 20 labs which covers the below syllabus. Lab 1:- Basic Fundamentals Database, Tables, rows and columns. Lab 2:- Primary key, foreign key, referential integrity and constraints. Lab 3 :- Database Normalization (1st, 2nd and 3rd normal forms). Lab 4: - SQL basics(Select, Insert, Update and Delete) Lab 5 :- DDL (Data definition language) Queries. Lab 6: - ISNULL and Coalesce functions. Lab 7: - Row_Number, Partition, Rank and DenseRank Lab 8: - Triggers, inserted and deleted tables Lab 9: - Instead of and after triggers. Lab 10: - Denormalization, OLTP and OLAP Lab 11: - Understanding Star schema and Snow flake design. Lab 12: - SQL Server 8 kb pages. Lab 13 :- Index and performances Lab 14 :- Page Split and indexes Lab 15 :- Clustered vs non-clustered Lab 16: - Stored procedures and their importance. Lab 17: - Change Data Capture. Lab 18: - Explain Columnstore Indexes? Lab 19: - SQL Server agent Lab 20: - How can we implement Pivot & Unpivot in SQL Server? Who this course is for: Developers who want to become SQL Server developers 👉 Activate Udemy Coupon 👈 Free Tutorials Udemy Review Real Discount Udemy Free Courses Udemy Coupon Udemy Francais Coupon Udemy gratuit Coursera and Edx ELearningFree Course Free Online Training Udemy Udemy Free Coupons Udemy Free Discount Coupons Udemy Online Course Udemy Online Training 100% FREE Udemy Discount Coupons https://www.couponudemy.com/blog/sql-server-step-by-step-for-beginners/
0 notes