#Sensor Data Analytics Size
Explore tagged Tumblr posts
Visit Tumblr Blog
Explore Tumblr blogs with no restrictions, modern design and the best experience.
Last Seen Tumblr Blogs


Fun Fact
Tumblr’s website traffic is steadily declining.
Text

Quick sketch for Piers’ bionic arm.

Design Features
•Aesthetics: Streamlined, ergonomic design with a minimalist look, often featuring a matte or metallic finish.
•Materials: Lightweight composites like carbon fiber and titanium, providing durability without sacrificing mobility.
•Color Options: Customizable colors or finishes, including options for skin-like textures or futuristic metallics.
Technology
•Actuation: Advanced motors and actuators that enable precise, fluid movement mimicking natural limb motion.
•Sensors: Integrated sensors (e.g., myoelectric sensors) to detect muscle signals for intuitive control and movement.
•Feedback Systems: Haptic feedback mechanisms to provide users with sensory information about grip strength and object texture.
Safety and Durability
•Water and Dust Resistance: High IP ratings to protect against environmental factors.
•Emergency Features: Manual override systems or fail-safes in case of technology malfunction.
Advanced Technological Interface
•Integrated Biosensors: Built-in biosensors that can analyze blood or interstitial fluid samples to measure viral load in real time.
•Data Analytics: Utilizes algorithms to process biosensor data, providing insights on viral dynamics and trends.
•Alerts and Notifications: Real-time alerts sent to the user or healthcare provider when viral load exceeds predetermined thresholds.
•Communication System: Integrated with a communicator on the wrist, the arm serves as a reliable device for maintaining contact with his team. This system includes encrypted channels for secure communication during high-stakes operations.
•Objective Management Display: The arm features a holographic display that provides a detailed version of the communicator’s data, allowing Piers to view mission objectives and tactical data in real-time. This feature minimizes the need for external devices and keeps critical information accessible.
Augmented Reality (AR) Compatibility
•Enhanced Visualization: The arm’s display projects augmented reality overlays, allowing Piers to see additional information, such as enemy positions, weapon stats, or tactical directions, directly in his line of sight.
•Environmental Scanning: The arm can analyze the surroundings for potential threats, detect biological or chemical hazards, and provide alerts for safer navigation through hostile environments.
Electricity Conduction and Control
•Energy Conduit Design: The bionic arm acts as a conductor for the constant electrical energy generated by Piers’ mutation. It includes specialized channels and circuits designed to manage this energy flow, allowing Piers to use his mutation’s electrical pulse without it spiraling out of control.
•Dielectric Structures: The arm’s design incorporates materials that mimic the dielectric properties of his mutated tissue, particularly in the finger joints and bones. These dielectric components help regulate and contain the high voltage his body produces, diffusing excess energy safely throughout the arm.
•Controlled Release Mechanism: To avoid overload, the arm features a controlled release system that allows Piers to release pulses of energy strategically, whether in combat or to alleviate the internal buildup. This system prevents the arm from overheating or sustaining damage from prolonged electrical activity.
Containment and Compression of the Mutation
•Compression Framework: The prosthetic was specially designed by UMBRELLA engineers to act as a containment “net” around his mutation. It includes a flexible, reinforced framework that compresses the mutated tissue, keeping it in check and preventing further growth or erratic shifts in form.
•Adaptive Pressure System: As the mutation strains against the arm, sensors detect any changes in size or energy output, triggering adaptive responses. The arm tightens or loosens as necessary to hold the mutation back, functioning almost like a high-tech brace that adjusts in real-time to maintain Piers’ arm in a stable form.
•Automatic Safety Lock: In the event of a significant spike in mutation activity or electrical output, the arm engages an emergency lock to keep the mutation from expanding. This feature is a safeguard against sudden bursts of energy that could cause the arm to revert to its mutated state.
Dependency and Risks of Removal
•Rapid Mutation Onset: Without the prosthetic in place, Piers’ arm begins to mutate almost immediately, returning to its original, unstable form. The electrical pulse that his body generates becomes unrestrained, emitting a continuous, breath-like rhythm that is both painful and dangerous, with energy leaking through protruding bones and exposed tissue.
•Uncontrollable Pulse: When uncontained, the electrical pulse from his mutation surges in intensity, lacking any natural “closure” or stopping point. This pulse causes rapid fluctuations in his vital signs and risks systemic overload, leading to loss of control over his mutation and putting him at severe physical risk.
Miscellaneous Details
•The arm has a unique serial code engraved on an inner plate, serving as an identifier for UMBRELLA technicians. This code also links to Piers’ personal health records, mutation data, and arm specifications for quick access during maintenance or in emergencies.
•Due to the intense electrical pulses generated by his mutation, the arm is equipped with an internal cooling system. Micro-fans and heat-dissipating channels prevent overheating during extended use, keeping the arm at a safe, comfortable temperature. If the arm overheats, an internal alarm alerts Piers to prevent any potential damage.
•The outer layer is treated with a UV-resistant coating to protect it from environmental damage and exposure. This ensures that prolonged exposure to sunlight or harsh conditions doesn’t wear down the arm’s exterior, making it more durable in diverse climates and situations.
•Designed for various operational environments, the arm is fully waterproof and corrosion-resistant. It functions normally underwater, which is crucial for aquatic missions or when exposed to rain, mud, or corrosive substances.
•The holographic display can be customized to show additional details, such as weather, GPS navigation, or tactical maps. Piers can also set personal preferences, like color schemes or alert tones, for a more intuitive user experience. This flexibility lets him prioritize the information he finds most critical during missions.
•The communicator has an onboard language translator, enabling Piers to communicate with individuals across different languages. The arm’s display shows translated text, and a subtle earpiece can even relay audio translations, making it easier for him to gather intel and negotiate in multilingual environments.
#𝐒𝐮𝐛𝐣𝐞𝐜𝐭 𝟏𝟑#𝐌𝐮𝐬𝐞; 𝐏𝐢𝐞𝐫𝐬 𝐍𝐢𝐯𝐚𝐧𝐬#I think I very severely fucked up my lefts and rights Ngl but oh well#resident evil#resident evil 6#piers nivans#long post
46 notes
·
View notes
Text
Understanding Smart Water Metering: A Comprehensive Guide

Smart water metering is revolutionizing how individuals, businesses, and municipalities manage water usage. With its advanced technology, it provides real-time data, improves efficiency, and promotes sustainable water consumption practices. This blog delves into the essentials of smart water metering, covering critical topics, challenges, step-by-step implementation, a real-life case study, and a concluding overview.
What is Smart Water Metering?
Smart water metering refers to the use of advanced metering systems that monitor water consumption in real-time and transmit data to consumers and service providers. Unlike traditional water meters, smart meters are equipped with wireless communication technologies, offering a more interactive and efficient water management system.
Unique Topics Everyone Should Know About Smart Water Metering
1. How Smart Water Meters Work
Smart water meters rely on sensors and communication networks to collect and transmit data. These meters often use IoT (Internet of Things) technology, connecting them to centralized data systems for seamless operation.
Key Features:
Real-time monitoring
Leak detection
Usage analytics
2. Benefits of Smart Water Metering
Smart water metering offers multiple advantages:
Enhanced Accuracy: Reduces billing errors.
Water Conservation: Identifies wasteful practices.
Convenience: Provides users with detailed consumption reports.
Cost Savings: Promotes efficient water use, lowering bills.
3. Applications of Smart Water Meters
Smart water meters are used across various sectors:
Residential Areas: Encouraging homeowners to adopt water-saving habits.
Commercial Buildings: Monitoring high water usage.
Municipal Systems: Managing city-wide water distribution.
Challenges in Smart Water Metering
While smart water metering presents many benefits, it also has challenges:
1. High Initial Investment
The cost of installing smart meters can be prohibitive, especially for large-scale projects.
2. Data Security Concerns
Since smart meters rely on digital communication, they are susceptible to cyber threats.
3. Infrastructure Requirements
Implementing smart water meters requires robust communication networks and integration with existing systems.
4. Resistance to Change
Some users may resist transitioning from traditional meters due to unfamiliarity or skepticism.
Step-by-Step Guide to Implementing Smart Water Metering
Step 1: Assess Requirements
Evaluate the specific needs of the property or area. Consider water usage patterns and infrastructure compatibility.
Step 2: Choose the Right Technology
Select smart water meters that align with your objectives, such as those offering real-time analytics or advanced leak detection.
Step 3: Plan the Deployment
Create a comprehensive plan outlining the installation process, data management protocols, and training requirements.
Step 4: Install and Integrate
Install the smart water meters and integrate them with your existing water management systems.
Step 5: Monitor and Optimize
Regularly monitor the performance of the smart meters and optimize their settings to maximize efficiency.
Case Study: Smart Water Metering in Urban Communities
Background
A mid-sized city faced challenges with water waste and inaccurate billing due to outdated water meters. The local government decided to implement smart water metering across residential and commercial zones.
Implementation
Conducted a city-wide assessment to identify high-priority areas.
Chose smart meters with real-time data transmission and leak detection capabilities.
Trained staff and launched an awareness campaign to educate residents.
Results
Reduction in Water Waste: Decreased water loss by 25% within the first year.
Improved Billing Accuracy: Resolved 90% of previous billing disputes.
Enhanced User Engagement: Residents actively monitored and reduced their water usage.
Conclusion
Smart water metering represents a significant step toward efficient and sustainable water management. By providing real-time insights, reducing waste, and promoting conservation, it benefits individuals, businesses, and municipalities alike. Despite initial challenges such as cost and infrastructure needs, the long-term advantages outweigh the hurdles. Adopting smart water metering not only ensures better resource management but also fosters a culture of accountability and sustainability.
Whether you are a homeowner looking to monitor your water usage or a city planner aiming to optimize municipal water distribution, smart water metering is the future of water management. Start exploring your options today to make a difference for tomorrow.
By implementing the concepts discussed, leveraging the step-by-step guide, and learning from successful case studies, you can effectively embrace the revolution of smart water metering. Together, we can work towards a smarter and more sustainable future.
2 notes
·
View notes
Text
Vertical Farming Market Recent Trends and Growth Analysis Report 2024 – 2030
The global vertical farming market size is expected to reach USD USD 24.95 billion by 2030, according to a new report by Grand View Research, Inc. It is expected to expand at a CAGR of 20.1% from 2023 to 2030. Increased use of Internet of Things (IoT) sensors for producing crops is likely to spur market demand over the forecast period. Information obtained from the sensors is stored on the cloud and analyzed to perform the required actions. The growing automation in agriculture and increasing use of big data and predictive analytics for maximizing yields are also likely to drive the market.
Vertical farming is effective in ensuring stability in crop production and maintaining reliability even in adverse climatic conditions. It provides multiple benefits over the traditional farming technique, such as less use of water, the lesser need for agrochemicals, and low dependence on agricultural labor. Vertical farming makes use of metal reflectors and artificial lighting to maximize natural sunlight.
Genetically modified organisms and the environmental and health effects of pesticides and other non-natural substances that are used for increasing agricultural production have encouraged consumers to adopt organic foods. According to the Organic Trade Association, the U.S. organic industry sales increased by around 5% in 2019 owing to the increased investment in infrastructure and education. As per the Organic Foods Production Act of 1990, the handlers and growers of organic products need to comply with the regulations.
Gather more insights about the market drivers, restrains and growth of the Vertical Farming Market
Detailed Segmentation:
Market Concentration & Characteristics
The vertical farming market growth stage is high. The vertical farming market is witnessing a significant degree of innovation, marked by the adoption of advanced technologies such as sensors and cameras in order to enhance resource efficiency, increase yields, and address challenges such as limited space and environmental constraints. Also, technologies such as hydroponics, aeroponics, LED grow lights, and automation systems are commonly employed to enhance efficiency and crop quality.
Market Dynamics
The growth of the vertical farming market is attributed to factors such as steady population growth, government incentives, limited availability of cultivable land, and the increasing demand for high-quality and fresh food. Moreover, the increasing consumer demand for organic food is positively impacting the growth of the vertical farming market, creating favorable business opportunities. With consumers placing a higher value on organic products, vertical farming is a viable solution to meet this demand.
Component Insights
On the basis of components, vertical farming market is segmented into hardware, software, and services. The hardware segment accounted for the largest market share in 2022. Hardware plays a significant role in maintaining an environment in vertical farming. The segment is further categorized into lighting, hydroponic components, climate control, and sensors. The lighting segment led the market and accounted for more than 44.46% of global hardware revenue in 2022. A large share of the lighting segment can be attributed to the dependence of vertical farms on artificial lighting. Artificial lights provide sufficient light intensities required for crop growth. The climate control segment is expected to register the highest CAGR of 20.6% over forecast period. Increasing adoption of hydroponic components by farmers to minimize weight load and infrastructure needed to support equipment is anticipated to drive demand for hydroponic components.
Growing Mechanism Insights
The Hydroponics segment registered the largest market share in 2022 and is expected to remain dominant between 2023 and 2030. Hydroponics is a popular growth mechanism due to low installation costs and ease of operations. It is a method of growing plants without soil, where soil is replaced by mineral solution inserted around plant roots. Additionally, the hydroponics method removes the risk of soil organisms causing diseases.
Crop Category Insights
The fruits, vegetables, & herbs segment registered the largest market share in 2022 and is expected to remain dominant between 2023 and 2030. Increasing cultivation of commonly grown fruits and vegetables in vertical farming is driving segment growth. Crops grown in vertical farming provide maximum profit to companies involved in their cultivation. At the same time, vertical farming improves biodiversity as it does not cause land disturbances. As such, vertical farming is in high demand for growing different types of crops. Further, fruits, vegetables, & herbs are segmented into tomato, lettuce, bell, chili peppers, strawberry, cucumber, leafy greens (excluding lettuce), herbs, and others. Among which tomatoes segment led the market and accounted for more than 24.23% of global fruits, vegetables, & herbs revenue in 2022.
Structure Insights
The shipping container segment dominated the market with a share of about 53.32% in 2022 and is expected to remain dominant between 2023 and 2030. This growth is attributed to the ability of structure to help grow crops irrespective of geographic location. One of the primary benefits of container-based farming is that container farms are easy to transport, and one doesn't require a large piece of land or dedicated building to start cultivating.
Regional Insights
In terms of revenue, Europe dominated the vertical farming market in 2022 with a share of approximately 31.7% and is expected to remain dominant between 2023 and 2030. Growing awareness regarding the importance of alternative farming owing to less availability of fertile agricultural land and increasing population in the region is the key factor anticipated to spur the demand.
Browse through Grand View Research's Next Generation Technologies Industry Research Reports.
• The global synthetic data generation market size was valued at USD 218.4 million in 2023 and is projected to grow at a CAGR of 35.3% from 2024 to 2030.
• The global service virtualization market size was valued at USD 786.0 Million in 2023 and is projected to grow at a compound annual growth rate (CAGR) of 17.4% from 2024 to 2030.
Key Companies & Market Share Insights
Some of the key players operating in the market include Agrilution GmbH; Aerofarm; Brightfarms Inc.; Everlight Electronics Co., Ltd; Freight Farms; GrowUp Urban Farms Ltd.; Green Sense Farms, LLC; Vertical Farm Systems.
• Vertical Farm Systems is engaged in the development of fully automated growing systems with reusable medium and energy efficient climate cells. The company utilizes artificial intelligence (AI) and automation for optimized growing conditions.
• Brightfarms Inc., is an indoor farming company that provides fresh packaged salad. The company sells their product locally that are grown in controlled environment. The company is inclined towards development of efficient vertical farming system with a focus on resource efficiency and sustainable practices.
Key Vertical Farming Companies:
• AeroFarms (U.S.)
• Illumitex, Inc. (U.S.)
• American Hydroponics (U.S.)
• Agrilution GmbH
• Brightfarms Inc.
• Everlight Electronics Co., Ltd.
• Freight Farms
• GrowUp Urban Farms Ltd.
• Green Sense Farms, LLC
• Vertical Farm Systems.
Vertical Farming Market Segmentation
Grand View Research has segmented the global vertical farming market report based on structure, growing mechanism, crop category and region
Vertical Farming Structure Outlook (Revenue, USD Million, 2017 - 2030)
• Shipping Container
• Building-based
Vertical Farming Component Outlook (Revenue, USD Million, 2017 - 2030)
• Hardware
o Lighting
o Hydroponic components
o Climate control
o Sensors
• Software
• Services
o System Integration & Consulting
o Managed Services
o Assisted Professional Services
Vertical Farming Growing Mechanism Outlook (Revenue, USD Million, 2017 - 2030)
• Hydroponics
• Aeroponics
• Aquaponics
Vertical Farming Crop Category Outlook (Revenue, USD Million, 2017- 2030)
• Fruits Vegetables, & Herbs
o Tomato
o Lettuce
o Bell & Chili Peppers
o Strawberry
o Cucumber
o Leafy Greens (excluding lettuce)
o Herbs
o Others
• Flowers & Ornamentals
o Perennials
o Annuals
o Ornamentals
• Others (Cannabis, Microgreens)
Vertical Farming Regional Outlook (Revenue, USD Million, 2017 - 2030)
• North America
o U.S.
o Canada
o Mexico
• Europe
o Germany
o U.K.
o France
o Italy
o Spain
• Asia Pacific
o China
o Japan
o India
o Singapore
o South Korea
• South America
o Brazil
• Middle East and Africa (MEA)
Order a free sample PDF of the Vertical Farming Market Intelligence Study, published by Grand View Research.
Recent Developments
• In March 2023, BrightFarms, a pioneer in the indoor farming industry, is growing by establishing four additional regional greenhouse centers that introduce sustainably farmed leafy greens to a broader audience in the Eastern and Central United States. The newly built greenhouse centers are expected to meet the rising demand for organic food and initiate distribution to retailers by 2024. With this expansion, the company is expecting 10x revenue growth by 2024.
• In February 2023, AeroFarms and Public Investment Fund (PIF), a wealth funding body of Saudi Arabia, announced a joint venture to establish indoor vertical farms in the Middle East and Saudi Arabia.
#Vertical Farming Market#Vertical Farming Market size#Vertical Farming Market share#Vertical Farming Market analysis#Vertical Farming Industry
2 notes
·
View notes
Text
Market Report on Vertical Farming Products: Understanding Size, Share, and Growth Trajectories
The global vertical farming market size is expected to reach USD USD 24.95 billion by 2030, according to a new report by Grand View Research, Inc. It is expected to expand at a CAGR of 20.1% from 2023 to 2030. Increased use of Internet of Things (IoT) sensors for producing crops is likely to spur market demand over the forecast period. Information obtained from the sensors is stored on the cloud and analyzed to perform the required actions. The growing automation in agriculture and increasing use of big data and predictive analytics for maximizing yields are also likely to drive the market.
Vertical farming is effective in ensuring stability in crop production and maintaining reliability even in adverse climatic conditions. It provides multiple benefits over the traditional farming technique, such as less use of water, the lesser need for agrochemicals, and low dependence on agricultural labor. Vertical farming makes use of metal reflectors and artificial lighting to maximize natural sunlight.
Genetically modified organisms and the environmental and health effects of pesticides and other non-natural substances that are used for increasing agricultural production have encouraged consumers to adopt organic foods. According to the Organic Trade Association, the U.S. organic industry sales increased by around 5% in 2019 owing to the increased investment in infrastructure and education. As per the Organic Foods Production Act of 1990, the handlers and growers of organic products need to comply with the regulations.
Artificial lighting helps in extending the hours of natural daylight, which further increases the health, growth rate, and yield of the plants. Artificial lighting such as high-pressure sodium lighting and LED lighting can extend the availability of crops (throughout a season). LED lighting systems produce a dual-band color spectrum and generate low heat. They are anticipated to witness significant growth over the forecast period.
A hydroponic system is a method of growing plants without soil. A hydroponic system eliminates the need for pesticides and artificial ripening agents and helps in producing nutritionally-rich vegetables. However, factors such as high initial investment and fewer crop varieties are likely to restrain the market growth.
For More Details or Sample Copy please visit link @: Vertical Farming Market Report
Vertical Farming Market Report Highlights
The escalating production of biopharmaceutical products is anticipated to drive the market
The shipping container segment accounted for the largest market share in 2022. Shipping container-based farming uses less water than traditional farming with drip irrigation. Shipping containers can be easily stacked, modified, recycled, and refurbished at a lower cost. Additionally, the excess availability of unused shipping containers across the region will likely influence segment growth over the forecast period
The hardware segment accounted the largest market share in 2022. The hardware plays a significant role in maintaining the environment of the indoor farms. The segment is further categorized into climate control systems, lighting systems, sensors, and irrigation systems, which enables the cultivation of indoor-grown crops
The fruits vegetables, & herbs segment is also expected to have considerable growth over the forecast period. The increasing cultivation of commonly grown fruits and vegetables in greenhouses is driving the segment growth. Crops grown in vertical farming provide maximum profit to companies involved in their cultivation
Based on offering, the climate control segment is expected to witness high growth over the forecast period as the growth of crops can be controlled by monitoring and adjusting the concentrations of minerals
By growing mechanism, the aeroponics segment is expected to observe considerable growth over the forecast period as the aeroponics facilitate fast growth in plants (under normal conditions)
The North American regional market is expected to witness significant growth over the forecast period owing to the expansion of small-scale, commercial vertical farms
Gain deeper insights on the market and receive your free copy with TOC now @: Vertical Farming Market Report
We have segmented the global vertical farming market report based on structure, growing mechanism, crop category and region.
#VerticalFarming#UrbanAgriculture#SustainableFarming#AgTech#Hydroponics#Aeroponics#SmartFarming#ControlledEnvironmentAgriculture#FoodSecurity#GreenTech#UrbanFarming#CropProduction#InnovativeAgriculture#SustainableDevelopment#ClimateSmartAgriculture#AgriTechTrends#VerticalFarmingGrowth#AgriculturalInnovation#FutureFarming#ResourceEfficientFarming
2 notes
·
View notes
Text
Global Incontinence and Ostomy Care Products Market Size & Forecast 2031

The Global Incontinence and Ostomy Care Products Market size was estimated at USD 17.32 billion in 2022 and is expected to hit around USD 27.04 billion by 2031, poised to grow at a compound annual growth rate (CAGR) of 5.42% from 2022 to 2031.
The landscape of products designed to address incontinence and ostomy care within the global healthcare market is collectively known as the global incontinence and ostomy care products market. These products play a crucial role in enhancing the quality of life for individuals dealing with urinary or fecal incontinence and those who have undergone ostomy procedures. The market encompasses a diverse range of offerings, including adult diapers, disposable undergarments, catheters, ostomy bags, skin barriers, and other related accessories.
The demand for incontinence and ostomy care products has witnessed a significant upsurge in recent years, driven by factors such as an aging population, increased prevalence of chronic diseases, and a growing awareness of the importance of maintaining dignity and comfort for patients with such conditions. The market caters to a broad spectrum of consumers, including elderly individuals, patients recovering from surgeries, and those managing chronic health issues, creating a need for technologically advanced and user-friendly products.
As healthcare systems around the world continue to evolve, the global incontinence and ostomy care products market is adapting to meet the changing needs of patients and healthcare providers. Innovations in material technologies, design improvements, and sustainability initiatives are becoming prominent features of these products. Manufacturers are focusing on creating discreet, comfortable, and environmentally friendly solutions to enhance user experience and address concerns related to waste management.
One notable trend influencing the market is the integration of smart technologies into incontinence and ostomy care products. This includes the development of connected devices and wearable sensors designed to provide real-time health monitoring and data analytics for better management of patient care. These technological advancements contribute to personalized and proactive healthcare solutions, fostering independence and convenience for individuals with incontinence and ostomy needs.
Moreover, the market is witnessing a growing emphasis on the development of skincare solutions and products with enhanced moisture management properties. Skin health is a critical aspect for individuals using incontinence and ostomy care products, and manufacturers are investing in formulations that promote skin integrity, reduce irritation, and prevent complications associated with prolonged product use.
Download Free Sample Report
Recent Developments:
One notable advancement in the global incontinence and ostomy care products market is the integration of sustainable and eco-friendly materials. Manufacturers are increasingly adopting biodegradable and compostable materials to address environmental concerns and reduce the ecological impact of disposable products. This reflects a broader industry commitment to sustainability and responsible product development.
Additionally, the market is witnessing a rise in telehealth initiatives and digital platforms that offer personalized guidance and support for individuals managing incontinence and ostomy care at home. This shift towards digital healthcare solutions aims to improve patient education, provide remote consultations, and enhance overall accessibility to expert advice and resources.
In conclusion, the global incontinence and ostomy care products market continues to evolve, driven by a combination of demographic changes, technological innovations, and a growing emphasis on sustainability. As healthcare providers and manufacturers collaborate to meet the diverse needs of patients, the market is expected to witness further advancements in product design, materials, and integrated healthcare solutions.
Click : https://organicmarketresearch.com/global-incontinence-and-ostomy-care-products-market
Market Segmentation:
Market Breakup: By Product Type Incontinence Care Products Ostomy Care Products
Market Breakup: By Application Bladder Cancer Colorectal Cancer Crohn’s Disease Kidney Stone Chronic Kidney Failure Others
Regional Analysis The size and scope of the global Incontinence and Ostomy Care Products Market vary by region and are important and expanding. Below is a quick summary of the market’s regional analysis:
North America: In North America, the incontinence and ostomy care products market is witnessing significant traction due to a rapidly aging population and a high prevalence of chronic diseases. The region’s advanced healthcare infrastructure and a strong focus on patient comfort contribute to the adoption of innovative incontinence and ostomy care solutions. The United States, in particular, is a key player in driving market growth, with a considerable demand for technologically advanced and discreet products. Ongoing research and development efforts emphasize enhanced absorbency, skin-friendliness, and eco-friendly materials.
Europe: The European market for incontinence and ostomy care products reflects a diverse landscape, with varying levels of awareness and acceptance across different countries. Western European nations, including Germany and the United Kingdom, lead in terms of technological advancements and adoption of premium care products. Strict regulatory standards and a growing emphasis on sustainable materials shape product development in the region. Additionally, an aging population and increased healthcare spending contribute to the expanding market for incontinence and ostomy care products.
Asia-Pacific: The Asia-Pacific region is emerging as a key growth area for the incontinence and ostomy care products market. Rising healthcare awareness, an aging population, and improving economic conditions drive the demand for these products in countries such as China, India, and Japan. The market dynamics in this region showcase a preference for cost-effective solutions, leading to a surge in the adoption of locally produced incontinence and ostomy care products. Innovations targeting comfort, discretion, and ease of use are gaining traction among consumers.
South America: South America’s incontinence and ostomy care products market is characterized by a mix of established players and a burgeoning startup ecosystem. Increasing healthcare infrastructure development, particularly in countries like Brazil and Argentina, is fueling the demand for advanced care solutions. Economic factors, affordability, and compliance with regulatory standards influence the product landscape. Scalability and adaptability to diverse consumer needs are becoming crucial factors for success in this evolving market.
Middle East and Africa: The Middle East and Africa are witnessing a steady growth in the incontinence and ostomy care products market, driven by a growing focus on healthcare infrastructure and an expanding aging population. Countries such as South Africa and the United Arab Emirates are at the forefront of adopting innovative products to address the evolving healthcare landscape. Cloud-based solutions for inventory management and a heightened emphasis on product security and hygiene are becoming integral aspects of incontinence and ostomy care in the region.
Market Breakup By Region
North America
Europe
Asia Pacific
Latin America
Middle East and Africa
Competitive Landscape The Incontinence and Ostomy Care Products Market competitive landscape provides details by competitor. Details included are company outline, company financials, revenue generated, market potential, investment in research and development, new market initiatives, worldwide occurrence, production sites and facilities, production capacities, company strengths and weaknesses, product launch, product width and breadth, application dominance. The overhead data points providing are only related to the businesses’ focus related to Incontinence and Ostomy Care Products marketplace.
Contact Us: Mob : +91 9319642100 Noida One Tower Sec 62 Noida 201301 Sales : [email protected] Website : https://www.organicmarketresearch.com
1 note
·
View note
Text
What are the latest warehouse automation technologies?
Gone are the days of manual labour and static, inefficient operations. Today, we stand at the forefront of a revolution driven by the latest warehouse automation technologies. These innovations reshape how businesses handle inventory, fulfil orders, and optimize supply chains.
From autonomous robots and artificial intelligence to the Internet of Things (IoT) and advanced data analytics, we'll explore how these technologies enhance efficiency, reduce costs, and ensure seamless operations in modern warehouses.
1-Robotic Process Automation (RPA): RPA involves using software robots to automate repetitive tasks like data entry, order processing, and inventory tracking. The robots interact with various systems and applications to streamline workflows.
2-Autonomous Mobile Robots (AMRs): Robotic vehicles called AMRs navigate and operate in warehouses without fixed infrastructure, such as conveyor belts or tracks. They perform tasks like picking, packing, and transporting goods.
3-Automated Guided Vehicles (AGVs): AGVs are similar to AMRs but typically follow fixed paths or routes guided by physical markers or magnetic tape. They are commonly used for material transport in warehouses and distribution centres.
4-Goods-to-Person Systems: This approach involves bringing the items to the workers rather than having workers travel throughout the warehouse to pick items. Automated systems retrieve and deliver goods to a workstation, reducing walking time and improving efficiency.
5-Automated Storage and Retrieval Systems (AS/RS): AS/RS systems use robotics to store and retrieve items from racks or shelves automatically. These systems can significantly increase storage density and optimize space utilization.
6-Collaborative Robots (Cobots): Cobots are designed to work alongside human workers. They can assist with tasks like picking, packing and sorting, enhancing efficiency and safety.
7-Warehouse Management Systems (WMS): While not a physical automation technology, modern WMS software uses advanced algorithms and AI to optimize inventory management, order fulfilment, and warehouse processes.
8-Vision Systems and Machine Learning: Computer vision technology combined with machine learning can be utilized for tasks such as object recognition, inventory movement tracking, and quality control.
9-IoT and Sensor Networks: Internet of Things (IoT) devices and sensors collect real-time data on inventory levels, environmental conditions, equipment health, and more, enabling better decision-making and predictive maintenance.
10-Voice and Wearable Technologies: Wearable devices and voice-guided picking systems can provide workers with real-time information and instructions, improving accuracy and efficiency.11-Automated Packaging Solutions: These systems automate the packaging process by selecting the appropriate box size, sealing packages, and applying labels, reducing manual labour and ensuring consistent packaging quality.

1 note
·
View note
Text
Integrated Automation System (IAS) Market, Industry Recent Developments and Latest Technology 2032 | Reports and Insights

The Reports and Insights, a leading market research company, has recently releases report titled “Integrated Automation System (IAS) Market: Global Industry Trends, Share, Size, Growth, Opportunity and Forecast 2024-2032.” The study provides a detailed analysis of the industry, including the global Integrated Automation System (IAS) Market Share, size, trends, and growth forecasts. The report also includes competitor and regional analysis and highlights the latest advancements in the market.
Report Highlights:
How big is the Integrated Automation System (IAS) Market?
The integrated automation system (IAS) market is expected to grow at a CAGR of 5.6% during the forecast period of 2024 to 2032.
What are Integrated Automation System (IAS)?
An Integrated Automation System (IAS) is an advanced technological solution engineered to unify and enhance diverse industrial processes within a single integrated framework. Through the integration of control systems, sensors, actuators, and software applications, IAS enables smooth communication and coordination among various components and subsystems, facilitating efficient monitoring, management, and control of activities such as production, logistics, and quality assurance. With its capacity to consolidate data, offer real-time insights, and automate repetitive tasks, IAS boosts productivity, lowers operational expenses, and enhances overall efficiency across a broad spectrum of industrial operations.
Request for a sample copy with detail analysis: https://www.reportsandinsights.com/sample-request/1880
What are the growth prospects and trends in the Integrated Automation System (IAS) industry?
The integrated automation system (IAS) market growth is driven by various factors. The market for Integrated Automation Systems (IAS) is experiencing swift expansion, fueled by the growing demand for efficient industrial automation and streamlined operational workflows. With businesses increasingly prioritizing enhanced productivity and cost-effectiveness, IAS solutions have become indispensable across diverse sectors such as manufacturing, energy, automotive, and healthcare. These systems offer seamless integration of control mechanisms, sensors, and software applications, facilitating optimized production, logistics, and quality control processes. Moreover, the increasing adoption of Industry 4.0 principles and the Internet of Things (IoT) further accelerates the IAS market growth, as organizations acknowledge the benefits of centralized data management, real-time monitoring, and predictive maintenance capabilities provided by these sophisticated automation systems. Hence, all these factors contribute to integrated automation system (IAS) market growth.
What is included in market segmentation?
The report has segmented the market into the following categories:
By Component:
Hardware
Software
Services
Type:
Distributed Control System (DCS)
Programmable Logic Controller (PLC)
Supervisory Control and Data Acquisition (SCADA)
Human Machine Interface (HMI)
Others
Industry Vertical:
Manufacturing
Oil and Gas
Energy and Utilities
Automotive
Aerospace and Defense
Chemicals
Pharmaceutical and Healthcare
Food and Beverage
Others
End User:
Small and Medium Enterprises (SMEs)
Large Enterprises
Application:
Process Automation
Discrete Automation
Connectivity:
Wired
Wireless
Functionality:
Plant Automation
Machine Automation
Deployment:
On-premises
Cloud-based
End-Use:
Industrial
Commercial
Solution:
Control Systems
Robotics
MES (Manufacturing Execution System)
Industrial IoT (Internet of Things)
Others
Service:
Consulting
Integration and Implementation
Maintenance and Support
Industry 4.0 Enabler:
Big Data Analytics
Artificial Intelligence
Industrial Cybersecurity
Cloud Computing
Segmentation By Region:
North America:
United States
Canada
Europe:
Germany
The U.K.
France
Spain
Italy
Russia
Poland
BENELUX
NORDIC
Rest of Europe
Asia Pacific:
China
India
Japan
South Korea
Australia
New Zealand
ASEAN
Rest of Asia Pacific
Latin America:
Brazil
Mexico
Argentina
Rest of Latin America
Middle East & Africa:
Saudi Arabia
United Arab Emirates
South Africa
Egypt
Israel
Rest of MEA.
Who are the key players operating in the industry?
The report covers the major market players including:
Siemens AG
Schneider Electric SE
Emerson Electric Co.
Honeywell International Inc.
Rockwell Automation Inc.
Mitsubishi Electric Corporation
Yokogawa Electric Corporation
Omron Corporation
Bosch Rexroth AG
General Electric Company
Johnson Controls International plc
Fanuc Corporation
Schneider Electric SE
Hitachi Ltd.
View Full Report: https://www.reportsandinsights.com/report/Integrated Automation System (IAS)-market
If you require any specific information that is not covered currently within the scope of the report, we will provide the same as a part of the customization.
About Us:
Reports and Insights consistently mееt international benchmarks in the market research industry and maintain a kееn focus on providing only the highest quality of reports and analysis outlooks across markets, industries, domains, sectors, and verticals. We have bееn catering to varying market nееds and do not compromise on quality and research efforts in our objective to deliver only the very best to our clients globally.
Our offerings include comprehensive market intelligence in the form of research reports, production cost reports, feasibility studies, and consulting services. Our team, which includes experienced researchers and analysts from various industries, is dedicated to providing high-quality data and insights to our clientele, ranging from small and medium businesses to Fortune 1000 corporations.
Contact Us:
Reports and Insights Business Research Pvt. Ltd. 1820 Avenue M, Brooklyn, NY, 11230, United States Contact No: +1-(347)-748-1518 Email: [email protected] Website: https://www.reportsandinsights.com/ Follow us on LinkedIn: https://www.linkedin.com/company/report-and-insights/ Follow us on twitter: https://twitter.com/ReportsandInsi1
0 notes
Text
Mastering Precision: The Essential Guide to Flow Control Valves
In today's industrial and instrumentation landscape, accuracy is everything. Whether you're managing chemical processes, hydraulic systems, or safe fluid handling, having the right valve for precise control makes the difference between smooth operations and costly errors. Flow control valves are at the heart of this precision, enabling exact flow adjustments in diverse applications.
From complex instrumentation systems to heavy-duty industrial pipelines, the correct valve choice—a ball valve, manifold, or needle valve—ensures product consistency, safety, and uptime. Investing in the correct valve saves money, prevents system failures, and supports operational reliability.
Understanding the Valve Types
Flow Regulator Valves
Built for steady pressure and flow control, flow regulator valves maintain consistent fluid output despite inlet variations. They're essential in heating, cooling, and process systems where accuracy equals quality.
Instrumentation Valves
Instrumentation valves, used in pressure instruments, analysers, and gas or liquid sampling, help manage flow to delicate sensors. Their accuracy guarantees data precision and secures component functionality safety.
Manifold Valves
These multi-port valves allow controlled sampling, calibration, and pressure testing in a compact unit. Manifold valves streamline instrumentation systems and reduce leak points.
Industrial Ball Valves & Stainless-Steel Valves
Industrial ball valves are the most used shut-off valves, providing fast operation and a tight seal sealing. Stainless steel valves, often made with corrosion-resistant materials, support chemical, food, and pharmaceutical applications.
Needle Valve Flow Control
Needle valves allow fine tuning, and their tapered stems are perfect for low‑flow, high‑pressure adjustments. Needle valve flow control provides remarkable precision in laboratory and analytical settings.
Picking the Right Valve for Your Application
Process Requirements: Know your maximum flow rate, pressure range, and fluid characteristics.
System Type: Use a ball valve for shut off; for precise control, choose needle, regulator, or manifold valves.
Material Compatibility: Ensure a corrosion-resistant match through stainless steel valves if working with harsh chemicals or extreme temperatures.
Timing and precision matter. Choose a valve that meets functional needs and endures wear, pressure, and environmental conditions.
Why Quality Valve Manufacturers Matter
Valve performance depends on manufacturing consistency. Manufacturers of flow control valves and ball valves must follow rigorous standards and quality assurance. Precision machining, proper sealing, and thorough testing all impact valve reliability.
Certification to international standards (e.g., ISO, API, ANSI) and adherence to material specs (ASTM) help ensure valves meet process requirements and regulatory standards.
Working with Local Suppliers
Partnering with trusted flow control valve suppliers makes maintenance easier. Look for suppliers who offer:
Technical support for sizing, installation, and maintenance
Quick access to replacement parts
Options from stock and customization as needed
A reliable supplier, not just a vendor, becomes a strategic ally in your operations.
Valves in Action: Real-World Examples
Cooling Systems Steady coolant flow is key. A diaphragm-type flow control valve stabilizes temperature even when input pressure varies.
Chemical Dosing Metering pumps rely on instrumentation and needle valves for accurate flow into reactors, ensuring product clarity and yield.
High-Pressure Hydraulic Lines Heavy-duty industrial ball and stainless-steel valves maintain performance under pressure in machinery and offshore systems.
Gas Sampling Loops Compact manifold valves make sampling setups leak-resistant and maintenance-friendly, which is ideal for field analysers.
Keeping Your Valves in Top Shape
Set up Clean Systems: Debris poses the greatest threat to a valve.
Follow Torque Specs: Over-tightening can break seals.
Regular Inspection: Look for wear, leaks, or pressure changes.
Invest in Leaflet Documentation: Proper guidelines help with maintenance and replacement.
With correct usage and upkeep, valves can last for years and deliver stable performance.
Trends in Valve Technology
New developments are pushing valve tech forward:
Smart Valves: Equipped with built-in sensors that check position, temperature, torque, and flow, providing remote diagnostics.
Eco Materials: Innovative alloys and nickel-temperable steels enhance resistance to corrosion and chemicals.
Modular Manifolds: Offer quick assembly and flexible configurations for streamlining complex setups.
These innovations ensure systems stay responsive and adaptable to evolving operational demands.
Choosing the right flow control valves is more than a technical detail—it’s a strategic decision that affects performance, safety, and costs. Partnering with reputable flow control valves manufacturers and suppliers ensures reliable products, expert guidance, and system resilience.
To secure your operations with tested, high-quality valves and expert support, Arek Solutions offers a wide range of valves including manifold valves, regulators, and industrial-grade fittings—all backed by precision and service.
0 notes
Text
Top 5 Innovations in Test Cricket Equipment
1. Advanced Helmets with Neck Guards
Modern cricket helmets have evolved far beyond their early designs. Today’s helmets are:
Made of high-grade polycarbonate shells
Equipped with reinforced grills for enhanced face protection
Often come with additional neck guards (especially after the tragic incident involving Phillip Hughes)
Neck guards are now a standard addition for most international players, significantly reducing the risk of life-threatening injuries from short-pitched deliveries.
2. Lightweight, High-Performance Bats
While the shape and size of Test bats remain within regulations, bat technology has seen significant advancement:
Use of lightweight English willow for better pickup and control
Thicker edges and larger sweet spots to support aggressive stroke play
Improved pressing techniques that maintain both power and durability
These innovations help players score faster without sacrificing the ability to bat for long durations.
3. Smart Wearable Sensors
Fitness and biomechanics are crucial in modern Test cricket. Players and coaching staff now rely on:
GPS vests and smart wearables to track workload, movement, and on-field activity
Bat sensors that monitor swing speed, angle, and impact timing
Detailed data analytics to fine-tune performance and manage player fatigue
Though often invisible to spectators, these technologies offer a new edge in training and match preparation.
4. Moisture-Wicking and Protective Clothing
Today's Test cricketers wear gear designed for both comfort and safety:
Moisture-wicking fabrics keep players dry during long spells on the field
Impact-resistant padding is now integrated into trousers and shirts for protection
Breathable, stretchable materials allow free movement without compromising safety
These improvements are essential for enduring the rigors of five-day cricket in varying weather conditions.
5. High-Performance Footwear
Modern cricket shoes are built for precision, comfort, and performance:
Custom spike configurations for different pitch types
Enhanced ankle support and shock-absorbing soles to reduce injury risk
Designed to help players maintain stability and grip during long innings or bowling spells
Footwear innovation has become an important part of an athlete's on-field success.
0 notes
Text
North America Wearable Sensor Market Size, Key Players Analysis, Business Growth, Regional Trends, Development Status (2021-2028)
The North America Wearable Sensor market is expected to reach US$ 1,244.11 million by 2028 from US$ 585.77 million in 2021. The North America wearable sensor market is estimated to grow at a CAGR of 11.4% from 2021 to 2028.
North America Wearable Sensor Market Overview
Smart wearable devices, encompassing smartwatches, fitness trackers, VR headsets, smart wristbands, activity trackers, and sports watches, are becoming increasingly sophisticated through integration with artificial intelligence (AI) and the Internet of Things (IoT). These innovations allow users to seamlessly access their health information on their smartphones, tablets, or computers, which are linked to these devices. With growing consumer awareness, the adoption of smart wearable devices is experiencing a significant boom in the healthcare sector. Wearable systems such as Fitbits, smartwatches, and pulse oximeters are now incorporating optical sensors to provide real-time patient health tracking solutions.
There's a notable demand for photoplethysmography (PPG) sensors, essential for monitoring heart and respiration rates. For example, in late 2021, Moto G, Realme, and Apple all released smartwatches featuring inbuilt PPG sensors. Realme watches particularly stand out with their wide-ranging health functions, including blood-oxygen-level and top-level PPG heart rate sensors. Moreover, in October 2020, Mobvoi launched its new PPG sensor-enabled TicWatch Pro 3 smartwatch in India.
Download our Sample PDF Report
@ https://www.businessmarketinsights.com/sample/BMIRE00025225
North America Wearable Sensor Market Strategies
Strategic insights for the North America Wearable Sensor market provide a data-driven analysis of the industry landscape, covering current trends, key players, and regional nuances. These insights offer actionable recommendations, enabling readers to distinguish themselves from competitors by identifying untapped segments or developing unique value propositions. Leveraging data analytics, these insights help industry players—whether investors, manufacturers, or other stakeholders—anticipate market shifts. A future-oriented perspective is crucial, helping stakeholders to foresee market changes and strategically position themselves for long-term success in this dynamic region. Ultimately, effective strategic insights empower readers to make informed decisions that drive profitability and achieve their business objectives within the market.
North America Wearable Sensor Market Insights
The geographic scope of the North America Wearable Sensor market refers to the specific areas where a business operates and competes. Understanding local distinctions—such as diverse consumer preferences (e.g., demand for specific plug types or battery backup durations), varying economic conditions, and regulatory environments—is critical for tailoring strategies to specific markets. Businesses can broaden their reach by identifying underserved areas or adapting their offerings to meet local demands. A clear market focus allows for more effective resource allocation, targeted marketing campaigns, and better positioning against local competitors, ultimately driving growth in those targeted areas.
North America Wearable Sensor Market Segmentation
The North America wearable sensor market is analyzed on the basis of sensor type, application, vertical, and country. Based on sensor type, the market is segmented into accelerometer, gyroscope, position sensor, motion sensor, image sensor, pressure and force sensor, touch sensor, and others. The accelerometer segment dominated the market in 2020.
Based on application, the market is segmented into smart wristwear, smart glass, smart bodywear, and smart footwear. The smart wristwear segment led the market in 2020.
Based on vertical, the market is segmented into consumer electronics, healthcare, and industrial and enterprise. The consumer electronics segment dominated the market in 2020.
Based on country, The market is segmented into the US, Mexico, and Canada. In 2020, the US was the leading country market for wearable sensors in the region.
Texas Instruments Incorporated, NXP Semiconductor, Analog Devices Inc, STMicroelectronics, Infineon Technology, Sensirion AG, Robert Bosch GmbH, Panasonic Corporation, TE Connectivity Corporation, and TDK corporation are the leading companies in North America Wearable Sensor market.
About Us:
Business Market Insights is a market research platform that provides subscription service for industry and company reports. Our research team has extensive professional expertise in domains such as Electronics & Semiconductor; Aerospace & Defense; Automotive & Transportation; Energy & Power; Healthcare; Manufacturing & Construction; Food & Beverages; Chemicals & Materials; and Technology, Media, & Telecommunications
0 notes
Text
Global Geospatial Analytics Market – $33B (2024) to $56B by 2029, 11.1% CAGR
Segmentation Overview The geospatial analytics market is segmented by:
Type: Surface & field analytics; Geovisualization; Network analysis; Artificial neural networks; Others
Technology: Remote sensing; GPS; GIS; Others
Solutions: Geocoding & reverse geocoding; Reporting & visualization; Thematic mapping & spatial analysis; Data integration & ETL; Others
Applications: Surveying; Disaster risk reduction & management; Medicine & public safety; Climate change adaptation; Predictive asset management; Others
End-Users: Agriculture; Defense & intelligence; Utilities & communication; Automotive; Government; Travel & logistics; Others
Regions: North America; Latin America; Europe; Asia-Pacific; Middle East & Africa To buy the report, click on https://www.datamintelligence.com/buy-now-page?report=geospatial-analytics-market
Market Size & Forecast
The global geospatial analytics market is projected to expand at a CAGR of 12.8% between 2024 and 2031.
Other projections estimate market growth from USD 32.97 billion in 2024 to USD 55.75 billion by 2029.
A broader estimate values the market at USD 114.3 billion in 2024, expected to reach over USD 226.5 billion by 2030.
Introduction & Definition
Geospatial analytics is the process of gathering, interpreting, and visualizing location-based data—drawn from satellites, GPS, mobile devices, sensors, and social media—using GIS, AI, and computer vision. This powerful fusion helps governments and businesses gain real-time insights into transportation, urban planning, agriculture, disaster response, defense, utilities, and logistics.
Market Drivers & Restraints
Key Drivers:
Smart City Expansion: The proliferation of IoT sensors and connected devices in urban infrastructure drives demand for spatial analytics to manage traffic, utilities, public safety, and emergency planning.
Technological Integration: Advances in AI, 5G, satellite imaging, and edge computing enable high-resolution, real-time spatial decision-making.
Enterprise Adoption: Widespread demand for location intelligence across sectors—such as agriculture, defense, utilities, transportation, and retail—boosts comprehensive geospatial integration.
Restraints:
Privacy & Security: Handling sensitive spatial data raises concerns over surveillance, data protection, and regulatory compliance.
Data Complexity: Integrating varied data sources—maps, sensors, satellite imagery—remains a challenge due to formatting and standardization issues.
Cost & Skills Gap: High initial investment and talent shortages for GIS and AI expertise hinder full-scale adoption.
Segmentation Analysis
By Type: Surface & field analytics lead due to applications in topography, hydrology, and asset monitoring. Geovisualization supports urban planning and stakeholder communication.
By Technology: GIS dominates software solutions; GPS and remote sensing—particularly LiDAR, radar, and GNSS—are key data capture technologies.
By Solutions: Thematic mapping and ETL tools are in high demand for data-driven decisions across utilities, logistics, and infrastructure.
By Applications: Surveying, disaster mitigation, climate adaptation, asset management, medicine, and public safety are major application fields.
By End-Users: Agriculture (precision farming), defense (geospatial intelligence), utilities, transportation, government services, and logistics are top verticals.To get a free sample report, click on https://www.datamintelligence.com/download-sample/geospatial-analytics-market
Geographical Insights
North America: Holds the largest market share (~34% in 2024), driven by government and defense investments, smart cities, and GIS adoption.
Europe: Adoption spans from transport and delivery logistics to environmental tracking; EU programs boost earth observation and AI integration.
Asia-Pacific: Fastest-growing region due to rapid urbanization and expansion in countries like China, India, and Japan.
Middle East & Africa: High growth supported by smart city initiatives and infrastructure investments.
Recent Trends or News
AI-Embedded Spatial Tools: Major GIS platforms are embedding AI and machine learning for predictive analysis.
Mobile Mapping & 3D Scanning: Use of LiDAR-equipped vehicles and drones is increasing rapidly in infrastructure and mapping applications.
Pandemic & Disaster Applications: The pandemic accelerated use of geospatial analytics for vaccine distribution, health mapping, and crisis response.
Competitive Landscape
Leading companies in the geospatial analytics market include:
Microsoft
Google
General Electric (GE)
SAP
Salesforce
Precisely
Oracle
RMSI
OmniSci
Maxar Technologies
Hexagon AB
TomTom
Trimble
Esri
CARTO
Orbital Insight
These companies lead through AI-powered tools, cloud-native GIS, satellite imagery, mobile solutions, and strategic acquisitions.
Impact Analysis
Economic Impact: Geospatial analytics streamlines operations—optimizing routes, reducing resource wastage, and enhancing project ROI.
Environmental Impact: Unlocks data for spatial monitoring—supporting climate modeling, land-use mapping, environmental compliance, and disaster mitigation.
Social Impact: Shapes public health response systems, emergency services, and urban planning, while challenging privacy norms.
Technological Impact: Drives growth in cloud GIS, AI-engineered mapping, real-time analytics, and sensor networks, enabling scalable spatial insights.
Key Developments
GeoAnalytics Engine by Esri: An AI-integrated GIS platform for advanced spatial querying and real-time analytics.
Hexagon Captura Launch: Optical sensor-based system enhancing spatial measurement precision.
CADLM Acquisition by Hexagon: Adds simulation and reliability modeling for enhanced engineering workflows.
Orbital Insight Growth: Enhances satellite-based analytics capabilities through new partnerships and investment.
Report Features & Coverage
This market report includes:
Global and regional market sizing (2018–2024) with forecasts to 2031
In-depth segmentation by type, technology, solution, application, industry, and region
Competitive landscape with company profiling
Key trends, opportunities, and growth challenges
SWOT analysis, Porter’s Five Forces, and market attractiveness index
Recent innovations and investment updates
About Us
We are a global market intelligence firm committed to delivering in-depth insights across emerging technologies. Our expertise in geospatial analytics helps clients unlock data-driven innovation, streamline operations, and improve strategic planning across industries. We provide accurate forecasting, custom reports, and actionable guidance tailored to enterprise and government needs.
Contact Us
Email: [email protected]
Phone: +1 877 441 4866
0 notes
Text
Exploring the Top Tools for Cloud Based Network Monitoring in 2025
With businesses increasingly implementing cloud-first programming, there has been no time when network visibility is more required. Conventional monitoring tools are no longer sufficient to monitor the performance, latency and security of the modern and distributed infrastructures.
And that is where cloud based network monitoring enters. It allows IT teams that have hybrid and cloud environments to have real-time views, remotely access them, and also have improved scalability.
Some of those tools are remarkable in terms of their features, user-friendliness, and in-depth analytics, in 2025. This is the list totaling the best alternatives that are assisting companies keep in front of the network problems prior to them affecting operations.

1. Datadog
DevOps and IT teams are fond of using Datadog due to its cloud-native architecture and extensive availability. It also provides visibility of full-stack, metrics, traces as well as logs, all on a single dashboard.
Its Network Performance Monitoring (NPM) allows identifying bottlenecks, tracing traffic and tracking cloud services such as AWS, Azure and Google cloud. It provides teams with the ability to move quickly with real-time alerts and customizable dashboards with the insights.
2. SolarWinds Hybrid Cloud Observability
SolarWinds is traditionally associated with on-prem monitoring solutions, whereas, with shifts toward hybrid cloud observability, it will find itself extremely pertinent in 2025. The platform has evolved and is able to combine conventional network monitoring with cloud insights.
It provides anomaly detection, visual mapping, deep packet inspection using AI. This aids IT teams to troubleshoot through complex environments without switching between tools.
3. ThousandEyes by Cisco
ThousandEyes specializes in digital experience monitoring, and it is especially applicable to large, distributed networks. It also delivers end to end visibility at user to application level across third party infrastructure.
Its cloud agents and the internet outage tracking ensure that businesses can find out in a short time whether a performance problem is either internal or external. The strong support of Cisco gives the accuracy and the access of its network data.
4. LogicMonitor
LogicMonitor is a simple to deploy and scale agentless platform. It is awesome when an organization needs automation and little configuration.
The tool measures bandwidth, uptime, latency and cloud performance among various providers. Its predictive analytics not only identify trends, but they also notify teams before minor problems become major ones.
5. ManageEngine OpManager Plus
OpManager Plus is a powerful tool to be used by those who require an infrastructure support combination of the traditional and cloud-based monitoring. It is compatible with hybrid networks that provide stats such as device health, traffic and application performance.
It is distinguished by the UI, which is clean, self-explanatory, and can be customized. It especially is suitable in the middle-sized IT departments who require an unobstructed glance of both physical and virtual systems.
6. PRTG Network Monitor (Cloud Hosted)
The hosted version of PRTG has the same functions as its widely used desktop version, and its availability is on cloud levels. It carries sensors to keep track of server availability to network capacity and usage as well as cloud services.
It is perfect when companies require such a convenient approach as a license and payment as you go prices. Even the simpler option of the tool can be a good option to apply to the project where IT team size is smaller or you are at the beginning of the cloud migration.
What to Look for in a Monitoring Tool
When choosing a cloud network monitoring solution, it's important to focus on a few key aspects:
Ease of deployment and scalability
Multi-cloud and hybrid support
Custom alerting and reporting
Integration with your existing stack
User-friendly dashboards and automation
Each business is unique in its requirements and there is no such thing like the best tool, only the tool that suits your infrastructure, the size of your team and your response requirements.
Conclusion
With evolving infrastructure it is important to have the correct tools implemented to observe performance and availability. In 2025, the cloud based network monitoring tools will be more competitive, intelligent and responsive than ever.
Be it a Hollywood-sized company or a small IT start-up, by investing in any of these best platforms, you have the sight of keeping secure, flexible and consistent in a cloud driven planet.
0 notes
Text
Transforming Vessel Efficiency: Leveraging Data-Driven Insights for a Sustainable Future
Introduction
Optimizing vessel efficiency has become not just a competitive advantage but a necessity. Shipping companies are under increasing pressure to reduce operational costs, comply with stringent environmental regulations, and minimize their carbon footprint. As global trade continues to expand, so does the need for smarter, data-driven solutions. This is where leveraging data-driven insights comes into play, transforming vessel operations and driving the future of maritime efficiency.
The Increasing Importance of Vessel Efficiency
Vessel efficiency is essential for several critical reasons. First and foremost, cost reduction is a driving force. Fuel costs represent one of the largest operational expenses for shipping companies. In fact, optimizing vessel efficiency can lead to fuel savings of up to 15%, resulting in substantial reductions in overall operating costs. One way this is achieved is through smart propulsion systems that adjust fuel consumption in real time based on operational conditions, ensuring that vessels operate at peak efficiency.

But it’s not just about fuel savings. With stringent regulations set by the International Maritime Organization (IMO) aimed at reducing greenhouse gas emissions, operational efficiency has become critical for regulatory compliance. The IMO has set ambitious targets: a 30% reduction in emissions by 2030 and an 80%reduction by 2040. Meeting these targets will require shipping companies to focus on optimizing their vessels' operational efficiency.
On the environmental front, the shipping industry is responsible for approximately 3% of global CO2emissions. Environmental responsibility is becoming increasingly important, and improving vessel efficiency helps to lower emissions, making a significant contribution to the global effort to combat climate change.
Importance of Vessel Efficiency in Modern Shipping
As operating costs rise due to factors like high interest rates, increasing shipbuilding costs, and the extended lifespan of older vessels, the importance of vessel efficiency has become more evident than ever. However, vessel efficiency goes beyond just fuel consumption—it is a multifaceted issue that requires a holistic approach to optimize.
Vessel efficiency can be broken down into three key categories:
1. Structural Efficiency: This includes innovations like new vessel designs, retrofits, and advanced propulsion systems.
2. Maintenance Efficiency: Regular hull cleaning, engine maintenance, and proactive maintenance scheduling can significantly reduce fuel consumption and downtime.
3. Operational Efficiency: Minimizing idle time, optimizing fleet size, and adopting best practices can drastically improve operational performance.
By addressing each of these categories, shipping companies can unlock vast improvements in vessel efficiency, ultimately leading to reduced costs, improved sustainability, and a stronger competitive edge.
The Role of Data in Enhancing Efficiency
Data is at the core of optimizing vessel efficiency. With the advent of real-time monitoring and advanced analytics, shipping companies can continuously track and analyze vessel performance. Sensors on board gather data on key metrics like speed, fuel consumption, engine performance, and weather conditions. This data can be analyzed in real time to make informed decisions that improve fuel efficiency, reduce costs, and ensure regulatory compliance.
One of the most impactful ways data enhances efficiency is through dynamic route optimization. By integrating weather data, ocean currents, and other environmental factors, shipping companies can plan more efficient routes, reducing fuel consumption and travel time. This ensures vessels are always operating at their best, no matter the external conditions.
Furthermore, data enables predictive maintenance, which is crucial for avoiding costly breakdowns. By analyzing sensor data, operators can identify potential issues before they become critical, saving time and money on repairs and preventing unexpected downtime.
The Power of Data in Steering Operational Efficiency
Data-driven insights not only help companies monitor vessel performance but also provide actionable recommendations to improve efficiency. By examining historical data, operators can identify patterns and trends that reveal areas for operational improvement. For example, fuel consumption predictions become more accurate by analyzing past performance data and factoring in vessel designs and engine specifications. Routine performance evaluations through reports, KPIs, and interactive dashboards ensure that operational efficiency remains a top priority.
Additionally, the integration of machine learning algorithms allows shipping companies to automate data analysis, detect inefficiencies, and make proactive adjustments. This creates a culture of continuous refinement, ensuring vessels are always operating at peak performance.
How Can Data-Driven Insights Improve Vessel Efficiency?
There are several powerful ways data-driven insights can optimize vessel efficiency, including:
1. Fuel Efficiency Optimization
Real-Time Monitoring: Implementing IoT sensors enables operators to track fuel consumption in real time, adjusting parameters to reduce waste and optimize fuel use.
Predictive Analytics: By analyzing historical data, operators can predict future fuel needs and adjust operations accordingly, preventing overconsumption.
2. Route Optimization
Weather and Ocean Current Data: By integrating external data such as weather forecasts and ocean currents, shipping companies can optimize routes to minimize fuel consumption and improve travel times.
Dynamic Routing Algorithms: These algorithms can adapt routes in real time based on changing conditions, ensuring vessels always follow the most efficient path.
3. Performance Benchmarking
KPIs: Establishing KPIs based on past performance helps operators measure current operations against benchmarks, identifying areas for improvement.
Comparative Analysis: By analyzing performance data across similar vessels, shipping companies can adopt best practices and enhance operational efficiency.
4. Maintenance Management
Predictive Maintenance: By forecasting maintenance needs based on real-time data, companies can schedule repairs proactively, reducing unplanned downtime.
Condition Monitoring: Continuous assessment of critical components ensures that repairs are made before issues escalate, improving vessel reliability.
5. Crew Performance Enhancement
Behavioral Insights: Analyzing crew behavior can reveal opportunities to optimize vessel operations, such as improving speed management to conserve fuel.
Training Needs Assessment: By identifying skill gaps, operators can target training programs that improve operational efficiency and safety.
6. Cargo Handling Efficiency
Load Optimization: Data analytics can be used to optimize cargo configurations, ensuring efficient use of space while reducing weight distribution issues.
Turnaround Time Reduction: By analyzing port call data, operators can streamline loading and unloading processes, reducing turnaround times at ports and improving fleet utilization.
By leveraging these insights, shipping companies can significantly reduce fuel consumption, improve operational performance, and enhance sustainability.
What Are the Challenges of Implementing Data-Driven Insights in Vessel Operations?
While the benefits of implementing data-driven insights are clear, there are several challenges that shipping companies must overcome:
Data Integration: Vessels generate data from multiple sources, including navigation systems, engines, and sensors. Integrating this data into a cohesive framework is complex, particularly when different systems and equipment use non-standardized formats.
Data Quality and Accuracy: Inconsistent or inaccurate data can lead to poor decision-making, making it essential to ensure data integrity and address issues like sensor malfuzctions.
Technology Adoption: Crew members and management may resist adopting new technologies due to unfamiliarity or fear of job displacement. Overcoming this resistance requires effective training and change management strategies.
Cybersecurity Risks: The increasing reliance on digital systems exposes shipping companies to cyber threats. Protecting sensitive data and ensuring compliance with cybersecurity regulations is critical.
Cost Implications: The upfront costs of implementing data-driven technologies, such as IoT sensors, telematics systems, and analytics platforms, can be significant. However, these investments typically pay off in the form of improved efficiency and cost savings.
Data Overload: The sheer volume of data generated can overwhelm operators, making it difficult to extract actionable insights. Prioritizing the most relevant data and implementing effective analytics tools can help mitigate this challenge.
What Technologies Are Essential for Collecting Data on Vessel Efficiency?
To collect and analyze data effectively, shipping companies rely on several key technologies:
IoT Sensors: These sensors provide real-time monitoring of critical metrics like fuel consumption, engine performance, and weather conditions.
Telematics Systems: By combining GPS, sensors, and software, telematics systems offer a comprehensive view of fleet operations and predict maintenance needs.
Cloud Computing: Cloud platforms enable the storage and processing of vast amounts of data, allowing operators to analyze and act on it in real time.
Big Data Analytics: Big data tools help analyze large datasets, identifying patterns and trends that optimize performance.
Advanced Communication Systems: Modern telemetry systems ensure secure, real-time transmission of data from vessels to shore-based operations, enhancing decision-making capabilities.
Conclusion: Charting a Course for the Future with the Power of Data-Driven Efficiency in Maritime Operations
The future of vessel efficiency lies in the power of data. By leveraging real-time monitoring, predictive analytics, and machine learning, shipping companies can unlock significant operational improvements, reduce costs, and meet environmental goals. As the maritime industry continues to evolve, adopting data-driven insights will be the key to staying competitive, sustainable, and profitable in an increasingly complex landscape.
For companies seeking to harness the power of data for vessel efficiency, the right technology solutions can make all the difference. From IoT sensors to advanced analytics platforms, investing in these technologies will enable shipping companies to not only enhance their operations but also contribute to a greener, more efficient future for the maritime industry.
For shipping companies aiming to unlock vessel efficiency and stay competitive, Envision Enterprise Solutions offers cutting-edge technologies like IoT sensors, real-time monitoring, predictive analytics, and machine learning. These solutions help optimize operations, reduce costs, and ensure compliance with environmental standards.
Explore how Envision can help your business enhance vessel performance and sustainability by visiting our website and discovering the full potential of data-driven insights.
#ai powered solutions#envision#ctos#operating systems#container#terminals#logistics#digitaltransformation#data analytics#iotsolutions#maritime
0 notes
Text
Edge Intelligence Unified Architecture for Predictive Maintenance
Digital transformation is accelerating the evolution of computing frameworks. With data increasingly generated outside centralized cloud environments, enterprises are turning to edge computing and fog architecture to process information closer to its source. This has led to a growing need for cohesion among these systems. Edge intelligence unified architecture offers a strategic model for integrating edge devices, fog nodes, and cloud infrastructure, enabling real-time insights, operational continuity, and scalable deployment. It ensures that data is not only collected but acted upon at the right layer of the computing ecosystem.

Understanding the Need for Unified Architecture Today’s computing needs are no longer served by a one-size-fits-all cloud approach. Applications in manufacturing, healthcare, autonomous vehicles, and smart cities require ultra-low latency and contextual awareness. A unified architecture ensures that intelligence exists not just in the cloud, but across all computing layers—optimizing both speed and scalability. Without a unified model, edge and fog systems risk becoming siloed, increasing complexity and reducing data reliability.
The Role of Edge Intelligence in Modern IT Edge intelligence enables devices at the edge of the network—like sensors, gateways, and embedded systems—to process and analyze data locally. This reduces the dependency on cloud infrastructure for every computational need. It improves response times, minimizes bandwidth usage, and allows enterprises to make faster decisions. When this edge intelligence is integrated within a unified architecture, its value scales exponentially through coordinated communication with fog and cloud layers.
Why Edge Intelligence Unified Architecture Matters A fragmented approach to edge and fog computing can lead to inefficiencies, security gaps, and integration headaches. Edge intelligence unified architecture provides a blueprint for harmonizing data flows, orchestrating workloads, and synchronizing analytics across distributed environments. It ensures seamless transitions between edge, fog, and cloud systems, giving enterprises the agility to deploy intelligent solutions where they are most needed—without reinventing the wheel for each layer.
Edge vs. Fog vs. Cloud: Clarifying the Layers Edge computing occurs directly on or near the devices that generate data, enabling real-time responses. Fog computing sits between the edge and the cloud, adding a layer of localized processing and orchestration. Cloud computing offers centralized processing and long-term storage but is limited by latency. A unified architecture blends these layers so that each plays a complementary role, with edge handling immediate reactions, fog managing coordination, and cloud focusing on historical analysis and scalability.
Benefits of a Unified Approach to Edge Intelligence With a unified model, enterprises can streamline data processing, enhance security by minimizing data transit, and maintain consistent governance across all layers. It also simplifies application deployment by offering a standardized platform for running AI models, managing connectivity, and scaling services. The result is a more resilient and responsive digital infrastructure that meets modern expectations of speed, personalization, and reliability.
Scenarios Where Edge Intelligence Unified Architecture Thrives Industries such as autonomous transportation, smart grids, retail analytics, and predictive maintenance benefit from this architecture. In each of these domains, milliseconds matter, and a centralized cloud approach cannot meet operational demands. Edge intelligence unified architecture allows these systems to analyze, adapt, and act locally, while still contributing to the broader enterprise intelligence framework.
Challenges and Considerations in Implementing Unified Architectures Despite its advantages, implementing a unified architecture is not without challenges. Organizations must consider interoperability between hardware and software platforms, edge-specific security concerns, and the complexity of orchestrating hybrid deployments. Success requires choosing flexible frameworks, investing in edge-ready AI tools, and establishing policies for governance and lifecycle management.
For more info https://bi-journal.com/edge-intelligence-unified-architecture/
Conclusion As enterprises strive to make faster, smarter, and more localized decisions, edge intelligence unified architecture becomes the backbone of modern computing strategies. It brings clarity to an increasingly complex digital landscape by integrating edge, fog, and cloud into a coordinated system that delivers on performance, scalability, and innovation. By investing in a unified model, businesses position themselves to harness real-time intelligence while maintaining the agility and resilience needed in a data-driven world.
#Edge Computing#Edge Intelligence#Fog Computing#BI Journal#BI Journal news#Business Insights articles
0 notes
Text
Understanding the Role of an Ultrasonic Smart Water Meter in Modern Water Management
Efficient water management is becoming increasingly essential in both urban and rural settings. With growing concerns around water scarcity, leakage, and the need for accurate consumption tracking, traditional mechanical water meters are no longer sufficient. This is where the Ultrasonic Smart Water Meter plays a vital role in transforming how utilities and households monitor water usage.
What Is an Ultrasonic Smart Water Meter?
An ultrasonic smart water meter is a device that uses ultrasonic waves to measure the flow of water. Unlike traditional mechanical meters, it has no moving parts. Instead, it calculates water flow by detecting the time difference between ultrasonic pulses transmitted and received through the water. This results in higher accuracy, lower maintenance, and a longer lifespan.
Key Features
High Accuracy: The meter provides precise readings even at low flow rates, reducing billing discrepancies.
No Moving Parts: Since it doesn’t rely on mechanical components, wear and tear are minimal.
Long-Term Reliability: The absence of internal movement ensures consistent performance over time.
Real-Time Data Monitoring: With smart connectivity, it enables real-time consumption tracking and remote reading capabilities.
Tamper and Leak Detection: Advanced sensors can detect tampering or leakages early, preventing water loss and unauthorized use.
Applications
The Ultrasonic Smart Water Meter is used across various sectors:
Residential Buildings: To monitor individual water consumption in apartments and houses.
Commercial Spaces: For businesses that require detailed water usage analytics for operations.
Industrial Units: Where precise water usage tracking can directly impact costs and process control.
Utility Providers: For automated meter reading (AMR) and advanced metering infrastructure (AMI) integration.
Advantages Over Mechanical Water Meters
FeatureMechanical MeterUltrasonic Smart Water MeterAccuracyModerateHighMaintenanceFrequentLowData OutputManualDigital/RemoteLife Span5–7 years10–15 yearsLeakage DetectionNoYes
By offering real-time insights and reducing the need for manual intervention, these meters make water distribution systems more efficient and transparent.
Integration with Smart Infrastructure
With the adoption of IoT (Internet of Things) in utilities, the Ultrasonic Smart Water Meter fits seamlessly into digital water management systems. It enables:
Remote data collection via LoRaWAN, NB-IoT, or GPRS.
Data analytics for consumption trends.
Alerts for unusual patterns or faults.
Reduced non-revenue water (NRW) loss.
Such features are especially useful for municipal bodies aiming to digitize their water supply network or industries looking to meet sustainability standards.
Environmental and Regulatory Compliance
In India and globally, governments are encouraging the use of smart metering systems for better resource control and environmental protection. Ultrasonic smart meters help in achieving compliance with regulations related to:
Smart City Missions
Water conservation mandates
Sustainable resource planning
The adoption of such meters also aligns with SDG (Sustainable Development Goal) 6: Clean Water and Sanitation.
How to Choose the Right Meter
Before selecting a smart water meter, consider:
Pipe size and flow rate requirements
Communication protocol (e.g., LoRa, NB-IoT)
Application type (residential, industrial, municipal)
Data security and encryption standards
Local calibration and certification needs
For optimal performance, always choose a model that adheres to local guidelines such as BIS (Bureau of Indian Standards) or MID certification.
Final Thoughts
The Ultrasonic Smart Water Meter is a step toward modernizing water management through data-driven insights and reliable performance. As cities and organizations move toward smarter infrastructure, the adoption of such meters will not only improve operational efficiency but also contribute to long-term water sustainability goals.
If you're considering implementing ultrasonic smart metering solutions for your home, business, or municipality, make sure to evaluate the specifications and support options provided by the manufacturer or supplier.
FAQs
Q1. Are ultrasonic smart meters more accurate than traditional meters? Yes, they offer high precision across a wide range of flow rates and do not degrade in accuracy over time.
Q2. Can these meters detect leaks? Yes, most models come with built-in leak detection that alerts users to abnormal flow patterns.
Q3. How is the data from the meter accessed? Through wireless communication technologies like LoRa, NB-IoT, or Bluetooth, allowing remote access and integration with dashboards.
Q4. Do these meters require regular maintenance? No, they are virtually maintenance-free due to the absence of moving parts.
Q5. Are ultrasonic water meters suitable for industrial use? Yes, they are widely used in industrial applications for process control and water usage auditing.
0 notes
Text
The Future of Analytics: How Video As A Sensor is Redefining Data Capture
The global Video As A Sensor Market, estimated at USD 71.50 billion in 2024, is forecast to reach USD 114,664.7 million by 2030, exhibiting a Compound Annual Growth Rate (CAGR) of 8.4% from 2025 to 2030. This growth is propelled by rapid technological advancements that have transformed conventional video systems and recording tools into sophisticated, intelligent decision-making instruments.
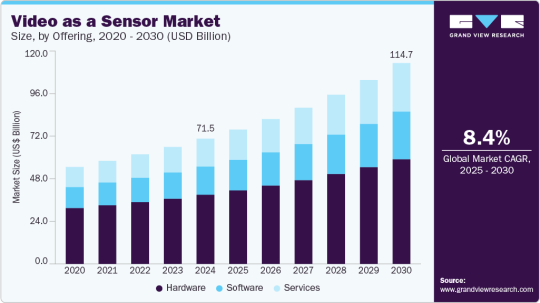
A significant catalyst for VaaS adoption is the technology's capacity to deliver real-time insights, including capabilities like facial recognition, anomaly detection, and behavior prediction. These features render VaaS highly suitable for contemporary security and surveillance systems, where prompt threat identification is crucial. Beyond security applications, the versatility of video sensors is increasingly evident across various sectors. In smart city initiatives, they play a vital role in enhancing urban infrastructure, contributing to public safety, optimizing energy consumption, and improving waste management efforts.
Key Market Trends & Insights:
North American Dominance: North America led the market with a 35.5% share in 2024. This leadership is driven by substantial investments in advanced surveillance systems and the early adoption of cutting-edge technologies such as Artificial Intelligence (AI) and machine learning.
U.S. Market Expansion: The video as a sensor market in the U.S. is experiencing notable growth, corresponding with increasing regional demand. The accelerating pace of industrialization and the integration of advanced technologies are key factors driving this market's expansion.
Video Surveillance Product Leadership: By product type, video surveillance accounted for the largest market revenue share in 2024. This segment's dominance is primarily due to escalating security concerns across residential, commercial, and public domains, coupled with rapid advancements in technologies like AI-driven analytics, cloud computing, and high-resolution imaging.
Security & Surveillance Application Dominance: In terms of application, the security and surveillance segment held the largest market revenue share in 2024. This is attributed to VaaS's ability to automate real-time threat detection, significantly reduce false alarms, and efficiently manage large volumes of video footage, thereby lessening the workload on security personnel.
Commercial End-Use Sector Growth: The commercial segment accounted for the largest market revenue share in 2024. This is driven by the growing need for enhanced security and surveillance solutions in commercial environments, including office buildings and retail establishments, to protect assets and ensure safety.
Order a free sample PDF of the Video As A Sensor Market Intelligence Study, published by Grand View Research.
Market Size & Forecast
2024 Market Size: USD 71.50 Billion
2030 Projected Market Size: USD 114,664.7 Million
CAGR (2025-2030): 8.4%
North America: Largest market in 2024
Asia Pacific: Fastest growing market
Key Companies & Market Share Insights
Leading firms in the Video As A Sensor (VaaS) market are employing a range of strategic initiatives to expand their market presence. These primarily include product launches and developments, alongside expansions, mergers and acquisitions, contracts, agreements, partnerships, and collaborations. Companies are leveraging diverse techniques to enhance market penetration and strengthen their competitive standing.
Axis Communications, a prominent player, specializes in network video surveillance and intelligent security solutions. Their comprehensive offerings, including a wide array of cameras, video management software, analytics, and access control systems, enable businesses and smart cities to utilize video as a sensor for real-time insights, improved safety, and enhanced operational efficiency. Axis's commitment to innovation, sustainability, and fostering a robust partner ecosystem underpins their goal of contributing to a smarter and safer global environment.
Hikvision is a significant force in video-centric IoT solutions, with a strong focus on advanced video-as-a-sensor technologies for both security and intelligent monitoring. By integrating state-of-the-art AI, deep learning, and high-performance video analytics, Hikvision delivers real-time surveillance, environmental sensing, and actionable insights. Their solutions are deployed across various sectors globally, including smart cities, transportation systems, and commercial enterprises.
Key Players
Axis Communications AB
Hangzhou Hikvision Digital Technology Co., Ltd.
Bosch Sicherheits systeme GmbH
Dahua Technology Co., Ltd.
Sony Corporation
Honeywell International Inc.
Sportradar AG
i-PRO
Johnson Controls
OMNIVISION
Browse Horizon Databook for Global Video As A Sensor Market Size & Outlook
Conclusion
The global Video As A Sensor (VaaS) market is experiencing rapid growth, driven by technological advancements transforming video into intelligent decision-making tools. Its ability to provide real-time insights makes it crucial for security, surveillance, and smart city initiatives. North America leads the market, with video surveillance and security applications dominating across commercial sectors. Leading companies are strategically innovating and collaborating to further expand their market share in this dynamic industry.
0 notes