#_uuid:d1bdb515-a54a-39f6-b24f-b8da200173ce
Text
Maximizing fantasy values when you draft in .5 and PPR leagues
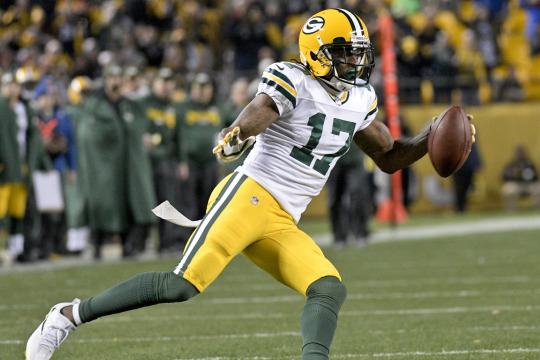
Green Bay Packers wide receiver Davante Adams presents more fantasy value at his current ADP than some running backs going earlier in .5 PPR drafts. (AP Photo/Don Wright)
Fantasy Football drafts are a combination of calculating maximum points with each pick and the expected depth of the various positions. To help guide us I used the Pro Football Reference database and adapted it to Yahoo’s new default half-point PPR scoring. Since 2012, I calculated the points on average for the top-scoring player at each position, as well as the fifth, 10th, 15th, 20th and so on.
It turns out that owners early this draft season are not acting entirely rational when they’re on the clock. They are leaving the higher probability of more wide receiver points on the table to venture too deeply into the running back pool for players who can only return the value if they beat ADP. That’s drafting uphill. Taking the receiver with those picks is drafting downhill because wideouts in that range will beat the running backs if both finish in actual positional points in accordance with where they’re being drafted.
Yes, leaving running backs on the board in the second and third rounds frightens us because it feels like RBs 20 to 40 are hopeless reaches. But is that true and if so to what extent? What kind of drop off has there been, actually? In other words, is getting, say, the 30th most points with the 30th running back drafted good enough to win in this half-point scoring format or is the loss of points too steep?
Here are the results by position (slot averages end of season scoring 2012-2017):
Quarterbacks points
QB1: 346 points QB5: 300 QB10: 271 QB15: 248
Obviously quarterback points don’t fluctuate between standard, .5 PPR or PPR, but the context with other positions is important. We’ll deal with the strategy of the QB position and whether and how long you can wait in the coming weeks.
Running back points
RB1: 333 RB5: 250 RB10: 202 RB15: 178 RB20: 161 RB25: 140 RB30: 126 RB35: 117 RB40: 109
Receiver points
WR1: 284 WR5: 243 WR10: 216 WR15: 194 WR20: 177 WR25: 163 WR30: 154 WR35: 144 WR40: 137 WR45: 127 WR50: 120 WR55: 111
Tight End points
TE1: 212 points TE5: 167 TE10: 129 TE15: 106
So what are the takeaways from this data as it relates to the current draft season? How can we use it?
Yahoo drafters are wise to draft a running back first overall and to exhaust the pool of possible RB1s at the top of the draft. But by taking the 10th running back (who on average happens at this writing to be Dalvin Cook) at 17th overall, they must have the back finish the year better than RB10 (on average 202 points in .5 PPR) to make that pick work.
So unless you think you’re getting a steal at running back, the play in the second round is to draft wide receivers. So far this year, the 10th WR is available through the end of the second round and has averaged 216 points in .5 PPR.
Receivers also have less injury risk and less projectable touch/target separation at that point of the draft. So I think they are better bets even assuming a perfect projection, which is plus-14 points for the WR10. Additionally, you need to assess whether the WR10 has a better chance to finish as the WR5 than the RB10 does RB5. I believe the answer is yes but we can put names on these players: RB10 is Dalvin Cook and WR10 is Davante Adams. Who has a better chance to finish five slots higher? Give me Adams, but in fairness that’s 48 points for Cook (250 vs. 202) and just 27 (243 vs. 216) on average for Adams.
[Yahoo Fantasy Football leagues are open: Sign up now for free!]
The receiver pool as it relates to historic scoring at the various slots degrades more slowly than running backs: Running back actual scoring declines from RB10 to RB30 about 43% more than at WR. This has been interpreted to mean that we can afford to wait longer to draft a wide receiver than a running back.
But we can also start up to twice as many wide receivers (if you have a three-receiver league plus a flex). So rather than believing you can wait for receivers in this ADP range, I take this to mean that we should be drafting them. (Another key point here is that this data is telling you that even in half-point PPR, your default plan should be to flex a wide receiver whether you’re in a two or three WR league — that’s the cheapest way to get more points out of the flex.)
My reading of this data is that it’s perfectly fine to pick three backs from running backs 25-to-40 range of your draft. Ideally, you’re combining them with one of the five or six backs that could conceivably be an RB1 or close to it. But even if you have to start two of these guys and they just finish in scoring where you drafted them, they’ll post enough points if you bank three or four wideouts who match or beat their expected points. And that’s assuming the backs you pick finish the year where you drafted them. People who draft wide receivers aggressively and those who draft running backs aggressively do seem to agree that beating ADP with wide receivers is easier — it’s just that the floor for the wide receiver picks is also higher.
Yahoo leagues are taking the top three tight ends, who all could be plausible TE1s, around WR10 in accordance with the data. Some owners are ruling this out — preferring to focus on RBs and WRs in these spots. And Yahoo drafters are also appropriately drafting the pool of plausible TE5s, who have beaten WR25. If like me you think this group of plausible TE5s extends a few more players until about the 10th round, where George Kittle goes, that gets you all the way to WR46. I think Kittle (or Jordan Reed or Trey Burton) has a better chance of finishing TE5 than the WR46 (Danny Amendola) has of finishing in the year about 20 slots higher.
Understanding the drop in production at positions as you get further in your draft should help you maximize points and give you an advantage over your opponents.
More from Yahoo Fantasy Sports
yahoo
#_author:Michael Salfino#_category:yct:001000854#_lmsid:a077000000CFoGyAAL#_uuid:d1bdb515-a54a-39f6-b24f-b8da200173ce#_revsp:54edcaf7-cdbb-43d7-a41b-bffdcc37fb56
0 notes
Last Seen Blogs

hallpasslovers
Untitled

dadsforever
Dads Forever

yeemophantrash
Just Mike
dadsforever
Dads Forever

amypoehleralldayeveryday
Poehler And Recreation