#also figured out how to make it calculate what % of days ive logged have each mood/symptom
Text

figured out how to do a color-block mood tracker in notion i am the king of formulas
#kaylee.txt#ignore the actual content in it lmao. the depression has been kicking my ass lately#but i started a new antidepressant yday so i needed a way to track how that goes + my google sheets tracker wasnt cutting it anymore#also figured out how to make it calculate what % of days ive logged have each mood/symptom#and what the correlations are between my moods + social interaction/weather/etc#if only notion let you center text then this would be perfect. oh well
17 notes
·
View notes
Text
better day one post
today was a good day, actually
i woke up and played animal crossing (new horizons) and felt like a lifetime passed in the span of two hours that i played. i think it was from 9 to 11.
oh this is random but does anyone else feel bad when you have a 9 too close to an 11? it’s like i’m just summoning all the bad things that happened during 9/11 into my core and they just build up like fat in arteries. its not even that big of a deal because its not like im actually referencing 9/11 but still, it bothers me. not even because i was cognizantly (or however you spell that) aware during that time, i just feel vaguely guilty???
but anyway, i had fun on animal crossing. i built a garden yesterday on a mountain behind my house, and funded a slope up to it. i dont think any of my villagers will wander out that far to visit it, but its nice to have the flowers so close. im not real worried about breeding them for the rarer colors, because my most favorite colors and pink and yellow (and green, but they only have mums in that color i think), but it would be nice to share them with my friends if i do get them.
i also set up a better entrance to my airport. i like to sell things on nookazon (which is, of course, amazon for animal crossing. well actually its more like ebay but i digress), but my entrance was cramped and ugly before. i really like it now, but i forgot to lay down a pretty sidewalk. that’s alright though, because grass is pretty too.
i kind of forgot what else i did since then, but i think the outfit i dressed my villager in was very cute, too. it was a tube top and some pretty red patterned pants, and i had a flower in my hair. i wish i could wear a tube top in real life, but im scared that people will try to yank it down to show my boobs. my mom said it happened to one of her sisters once (i think?). im also scared that people will do it to make fun of my fat stomach. im not shy about being fat, but ive heard “there’s nothing wrong with being fat” enough to think theres something wrong with being fat. not to get like existential about it (is that the right word?) but its like how people say theres nothing wrong with being poc. of course there isn’t, but people think there is something wrong with it enough that we have to say its not.
lmao anyway none of that is about the corona but i guess this is a diary anyway so thats alright.
anyway!
after animal crossing, i took my dog out. she’s a yorkie chihuahua breed with really bad breath. she got her bad breath from her bad teeth, because she bit my uncle so hard that she gave him stitches. he doesnt like her, but i say its what he deserves because he kept scaring her in her cage. i wont get in on the details, but im so mad at him and my extended family too, because they decided to put her outside after that and she (surprise) ran away. luckily we got her back, but me and my mom and my sister (my family) were overseas at the time, so it was very stressful. i wasnt meant to know about it, but i overhead my mom talking to my sister about it and about having her go home early to get my dog (diamond).
anyway she has really bad teeth now, and bad breath from the teeth, but i dont think it bothers her much as long as she doesnt get a lot of food stuck in them. she likes to lick my face and make it stink as bad as her tongue lmao. plus, since she’s getting old and they were already lose from biting my uncle, her teeth are starting to fall out one by one. each loss makes her breath smell better LMAO
but anyway!! i took my dog out. it had just finished raining, i think, and diamond hates the rain. we didnt stay out long. once i came back inside, i sold the rest of my turnips (in animal crossing). i had to use turnips.exchange because (even though its not sunday) according to a turnip calculator, the sell price on my island was only going to get lower and lower. maybe it would have spiked at the end of the week, but im one of those animal crossing cheaters who time skips so i figured i’d just sell them now and time skip later.
i did time skip, and i met redd (the art seller). this is my first animal crossing game that i’ve played for longer than a day, but i think redd isnt that bad. he sells counterfeit art, but i guess we all have to make a living somehow.
outside of animal crossing, im not really sure what i do anymore. school is a bit hard because (like i said) time isnt linear anymore. one of my assignments was late, but i dont think my teacher has logged in for a while so im not sure it matters. we’re all tired, and probably scared
but i finished my work, nonetheless. most of it, although i still need to read some stories for class and give my classmates feedback. im a creative writing major. i love writing, even though im not confident in my abilities all the time. i hope i dont come off as a bad writer here. if i do, i hope nobody ever tells me lmao
now its 10:30 pm. my mom just told me to put the clothes in the dryer for her. that, and doing the dishes, is my only chore but i forgot most of the time (which is why she reminds me of course). i like sitting in the laundry room because i like the smell of the lint. its hard, though, because my mom and i, even with her reminders, are bad at washing clothes. we forget and let them pile up until they dont fit in the room anymore.
although, to be fair, we dont have a very large laundry room. it fits our washer and dryer and barely one of those laundry baskets that has wheels and a pull out handle. you know the one, probably.
anyway this is getting a little long, especially for a first post lmao. im getting distracted and starting to pull up other stuff, and my mom came in to make me pick out a different face mask to order (i think from etsy but probably name brand knowing my mom), so i guess i’ll cut myself off there.
i didnt do much else today anyway.
oh, also the mask i chose is a rainbow peace pattern! just in case anyone wanted to know.
#day one#corona#ill try to tag all of my posts with corona so that anyone can block the tag#im sure they already have though#blocked corona i mean#lmao anywayyyyyy#also im going to keep tagging simple because i am a simple girl who doesnt tag anymore#i barely use tumblr#but i was on it all day today for some reason#it reminds me of better times#anyway#see you tomorrow#long post#most of my posts are long#so you should just block me now if you see this#i love how this mostly became about animal crossing
0 notes
Note
so, ive been doing conventions for about a year and a half now but ive never really been great at keeping track of my expenses and profits. at this point i have a pretty good stock of merch and dont have to reorder/make more every con, so i have a hard time figuring out how much money i actually spend/make per convention. any tips on how i can find out what my profits actually are?
Nattosoup: Make it a point to keep better track of your sales and inventory. Seriously. Anything else is trying to put the fire out after it’s an inferno.
Maybe you’re a visual person, I sure am. I like having my merch where I can see it, so it’s stored on shelves in my studio. Every time I pass it, I can see at a glance how I’m doing. I track what sells and for how much at cons, but the visual stock reminder helps with my online sales throughout the year.
Make notes before the show how much you’re bringing of what, count how much you have left after the show. Not just your sales- stock gets damaged, sometimes stock walks, sometimes you might trade stock.
Take a page from the bullet journalists, if you like doing things by hand, and set up an inventory notebook. Or track all your sales using Square or another card reader’s app- they have options for cash transactions. Or download a spreadsheet app for your phone (or Google Docs) and keep track there.
To really understand your profits, you need to figure out:
How much you’re spending ordering new merch, and which sites/coupons offer the best deals
The amount of time you spend per piece
The amount of money you spend on materials per piece
Assign your time a monetary value, and figure out how much money each piece is costing you to create
The amount of shrink you see (damaged pieces, stolen pieces, unaccounted for pieces)
What you sell each piece for
How many of each piece you sell
Then you need to multiply Number of Pieces Sold*Amount Pieces Sell For, and deduct (Materials+Time Value Creating Piece)+(Cost of individual merch items)+(Value of Shrink) to get an estimate of your profit. This is a rough estimiate, you should also deduct table cost, food cost, time spent at con cost, hotel cost, travel cost, ect from that total.
But seriously, in between cons, please sit down and figure out what you have on hand, get that organized, and try to set up a system for recording sales. It’ll only get more difficult, the longer you wait.
Kiriska: Bookkeeping is a topic I'd like to write a really in-depth article/document about someday, but the short version is definitely do it! Track everything you can think of tracking, by whatever means works best for you.
The simplest profit formula is, of course, Total Revenue - Total Expense = Net Revenue/"Profit". You can determine this on a per-con basis or an annual basis.
Total Expense can include everything relevant to your business, including travel, lodging, supplies, merchandise, table fees/registration, promotion (website domain registration, paid ads, business cards, etc), and hell, studio space/a portion of your rent.
For expenses that are general and not for a specific con, you can count them on an annual basis, then divide evenly between the number of cons you have per year. So if in 2016 you spent $1000 on merchandise and you did 5 conventions, you can count your merch expense as $200 per con.
Do include time expenses like Becca suggested. If you spent 20 hours on a piece of work and want to be paid $20/hr, add $400 to your "production time" costs, which can be tabulated on an annual basis and divided by con.
So say your expenses specific to Convention X were $100 for hotel, $30 for gas, $100 for food, $150 for table/badge. Your per-con expenses for the year for merchandise was $200 and your per-con time expenses for the year was also $200. That's $780 of expenses for Convention X. So if you made $1000 there, your net revenue is $220.
Most artists probably don't calculate their time costs because it's the thing that can balloon costs the most. In addition to the cost of production time, you should consider other time costs, like travel time, convention selling hours, time spent doing promotion, bookkeeping, etc. These are all hours you spend on your business.
It can be worthwhile to track everything but only factor some expenses into your profit equation. For example, you can exclude all time-related expenses in your calculation -- say this comes out to $500 net revenue for Convention Y. If you spent 30 hours working the convention over the weekend and 4 hours traveling, that's 34 total hours, so your hourly rate, given your profit, would be $500 / 34 = $14.71/hr.
You can calculate all sorts of things once you have the data, but the first step is just tracking and logging everything so you have the data! Inventory-tracking aside, it shouldn't be difficult to keep all your receipts and set aside a day a month to log all of them in a spreadsheet or whatever.
Or just track as you go. That's what I do, so I don't have the opportunity to forget. I always ask for a receipt making purchases at a store (or buying coffee at a con!) and receipts only leave my wallet once I've recorded them. Email receipts stay in my inbox until they're logged, etc. Get into the habit and go from there.
–
Was this post helpful to you? Consider patronizing or following HTBACA’s contributors. It takes time and effort to write these answers, so we appreciate your support!
74 notes
·
View notes
Text
Is your home a better investment than the stock market?
Shares 169
Ill admit it: There are times that I think everything that needs to be said about personal finance has been said already, that all of the information is out there just waiting for people to find it. The problem is solved.
Perhaps this is technically true, but now and then as this morning Im reminded that teaching people about money is a never-ending process. There arent a lot of new topics to write about, thats true (this is something that even famous professional financial journalists grouse about in private), but there are tons of new people to reach, people who have never been exposed to these ideas. And, more importantly, theres a constant stream of new misinformation polluting the pool of smart advice. (Sometimes this misinformation is well-meaning; sometimes its not.)
Heres an example. This morning, I read a piece at Slate by Felix Salmon called The Millionaires Mortgage. Salmons argument is simple: Paying off your house is saving for retirement.
Now, I dont necessarily disagree with this basic premise. I too believe that money you pay toward your mortgage principle is, in effect, money youve saved, just as if youd put it in the bank or invested in a mutual fund. Many financial advisers say the same thing: Money you put toward debt reduction is the same as money youve invested. (Obviously, theyre not exactly the same but theyre close enough.)
So, yes, paying off your home is saving for retirement. Or, more precisely, its building your net worth.
But aside from a sound basic premise, the rest of Salmons article boils down to bullshit.

Lying with Statistics
Looking past the paying off your house is saving for retirement subtitle on his piece (a subtitle that was likely added by an editor, not by Salmon), we get to his actual thesis: Making mortgage payments can, in theory, be a way to accumulate wealth almost as effectively as contributing to a retirement fund.
Im glad Salmon qualified this statement with in theory and almost because this is pure unadulterated bullshit. And its dangerous bullshit. Heres how this logic works:
If you buy an urban house today for $315,000 (the average price) and it appreciates at 8 percent a year for the next 15 years, you will be living in a $1 million house by the time you pay off your 15-year mortgage, and you will own it free and clear. Which is to say: Youll be a millionaire.
For this to be true, heres what has to happen.:
Home prices in your area have to appreciate at an average of eight percent not just this year and next year, but for fifteen years.You have to take out a 15-year mortgage instead of a 30-year mortgage.You need to stay in that house (or continue to own it) for that entire fifteen years.Once youve become a millionaire homeowner, you now have to tap that equity for it to be of use. To do that, you have to sell your home, acquire a reverse mortgage, or otherwise creatively access the value locked in your home.
The real problem here, of course, are the assumptions about real estate returns. Salmon spouts huckster-level nonsense:
The 8 percent appreciation rate is aggressive, but not entirely unrealistic: Its lower than the 8.3 percent appreciation rate from 2011 through 2017, and also lower than the 9 percent appreciation rate from 1996 to 2007.
Thats right. Salmon cites stats from 1996 to 2007, then 2011 to 2017 and completely leaves out 2008 to 2010. WTF?
This as if I ran a marathon and told you that I averaged four minutes per milebut I was only counting the miles during which I was running downhill! Or I told you that Get Rich Slowly earned $5000 per monthbut I was only giving you the numbers from April. Or I logged my alcohol consumption for thirty days and told you I averaged three drinks per weekbut left out how much I drank on weekends.
This isnt how statistics work! You dont get to cherry pick the data. You cant just say, Homes in some markets appreciated 9% annually from 1996 to 2007, then 8.3% annually from 2011 to 2017. Therefor, your home should increase in value an average of eight percent per year. What about the gap years? What about the period before the (very short) 22 years youre citing? What makes you think that the boom times for housing are going to continue?
Long-Term Home Price Appreciation
In May, I shared a brief history of U.S. homeownership. To write that article, I spent hours reading research papers and sorting through data. One key piece of that post was the info on U.S. housing prices.
Let me share that info again.
For 25 years, Yale economics professor Robert Shiller has tracked U.S. home prices. He monitors current prices, yes, but hes also researched historical prices. Hes gathered all of this info into a spreadsheet, which he updates regularly and makes freely available on his website.
This graph of Shillers data (through January 2016) shows how housing prices have changed over time:

Shillers index is inflation-adjusted and based on sale prices of existing homes (not new construction). It uses 1890 as an arbitrary benchmark, which is assigned a value of 100. (To me, 110 looks like baseline normal. Maybe 1890 was a down year?)
As you can see, home prices bounced around until the mid 1910s, at which point they dropped sharply. This decline was due largely to new mass-production techniques, which lowered the cost of building a home. (For thirty years, you could order your home from Sears!) Prices didnt recover until the conclusion of World War II and the coming of the G.I. Bill. From the 1950s until the mid-1990s, home prices hovered around 110 on the Shiller scale.
For the past twenty years, the U.S. housing market has been a wild ride. We experienced an enormous bubble (and its aftermath) during the late 2000s. It looks very much like were at the front end of another bubble today. As of December 2017, home prices were at about 170 on the Shiller scale. (Personally, I believe that once interest rates begin to rise again, home prices will decline.)
Heres the reality of residential real estate: Generally speaking, home values increase at roughly the same (or slightly more) than inflation. Ive noted in the past that gold provides a long-term real return of roughly 1%, meaning that it outpaces inflation by 1% over periods measured in decades. For myself, thats the figure I use for home values too.
Crunching the Numbers
Because Im a dedicated blogger (or dumb), I spent an hour building this chart for you folks. I took the afore-mentioned housing data from Robert Shillers spreadsheet and combined it with the inflation-adjusted closing value of the Dow Jones Industrial Average for each year since 1921. (I got the stock-market data here.) If youd like, you can click the graph to see a larger version.

Let me explain what youre seeing.
First, I normalized everything to 1921. That means I set home values in 1921 to 100 and I set the closing Dow Jones Industrial Average to 100. From there, everything moves as normal relative to those values.Second, Im not sure why but Excel stacked the graphs. (Im not spreadsheet savvy enough to fix this.) They should both start at 100 in 1921, but instead the stock market graph starts at 200. This doesnt really make much of a difference to my point, but it bugs me. There are a few places 1932, 1947 where the line for home values should actually overtake the line for the stock market, but you cant tell that with the stacked graph.
As the chart shows, the stock market has vastly outperformed the housing market over the long term. Theres no contest. The blue housing portion of my chart is equivalent to the line in Shillers chart (from 1921 on, obviously).
Now, having said that, there are some things that I can see in my spreadsheet numbers that dont show up in this graph.
Because Felix Salmon at Slate is using a 15-year window for his argument, I calculated 15-year changes for both home prices and stock prices. Ill admit that the results surprised me. Generally speaking, the stock market does provide better returns than homeownership. However, in 30 of the 82 fifteen-year periods since 1921, housing provided better returns. (And in 14 of 67 thirty-year periods, housing was the winner.) I didnt expect that.
In each of these cases, housing outperformed stocks after a market crash. During any 15-year period starting in 1926 and ending in 1939 (except 1932), for instance, housing was the better bet. Same with 1958 to 1973. In other words, if you were to buy only when the market is declining, housing is probably the best bet if youre making a lump-sum investment and not contributing right along.
Another thing the numbers show is that youre much less likely to suffer long-term declines with housing than with the stock market. Sure, there are occasional periods where home prices will drop over fifteen or thirty years, but generally homes gradually grow in value over time.
The bottom line? I think its perfectly fair to call your home an investment, but its more like a store of value than a way to grow your wealth. And its nothing like investing in the U.S. stock market.
For more on this subject, see Michael Bluejays excellent articles: Long-term real estate appreciation in the U.S. and Buying a home is an investment.
Final Thoughts
Honestly, I probably would have ignored Salmons article if it werent for the attacks he makes on saving for retirement. Take a look at this:
If youre the kind of person who can max out your 401(k) every year for 30 or 40 years straight disciplined, frugal, and apparently immune to misfortune then, well, congratulations on your great good luck, and I hope youre at least a little bit embarrassed at how much of a tax break youre getting compared to people who need government support much more than you do.
Holy cats! Salmon has just equated the discipline and frugality that readers like you exhibit with good luck, and simultaneously argued that you should be embarrassed for preparing for your future. He wants you to feel guilty because youre being proactive to prepare for retirement. Instead of doing that, he wants you to buy into his bullshit millionaires mortgage plan.
This crosses the line from marginal advice to outright stupidity.
Theres an ongoing discussion in the Early Retirement community about whether or not you should include home equity when calculating how much youve saved for retirement. There are those who argue absolutely not, you should never consider home equity. (A few of these folks dont even include home equity when computing their net worth, but that fundamentally misses the point of what net worth is.)
I come down on the other side. I think its fine good, even to include home equity when making retirement calculations. But when you do, you need to be aware that the money you have in your home is only accessible if you sell or use the home as collateral on a loan.
Regardless, Ive never heard anyone in the community argue that you ought to use your home as your primary source of retirement saving instead of investing in mutual funds and/or rental rental properties. You know why? Because its a bad idea!
Shares 169
https://www.getrichslowly.org/home-investment/
0 notes
Text
Inside the Online School That Could Radically Change How Kids Learn Everywhere
Emily Duggan, 16, expends most afternoons at a dance studio tucked behind a shopping plaza near her home in Exeter, New Hampshire. Blond and doe-eyed, Duggan has been dancing since she was two, everything from tap to ballet. She puts in about 12 hours a week at the studio, including class and rehearsals with the dance team for weekend competitors. Duggan also prides herself on get good grades in school. But two years ago, the stress of managing both dance and academics overwhelmed her.
She was depleted and losing weight. Some nights, Duggan faced four hours of homework after a day of school and dancing that stretched into the evening, I would just break down crying and telling, I cant do this anymore! she recalled.
Her mothers concurred. In January 2015, Duggan enrolled in New Hampshires self-paced Virtual Learning Academy Charter School, joining about 200 full-time middle and high school students and about 10,000 part-timers from brick-and-mortar schools statewide who take online VLACS courses a la carte. There is no entrance exam, screening or application required to attend VLACS, which is free for any New Hampshire student.
A week afterward, theres a follow-up bellow. Thats when I ask students why theyre taking my course, and what their goals are, told Kent. Some students simply need the course credit, of course, but others have a fitness target, struggle with obesity or are athletes who want to increase their strength or overcome an injury.
Students do the bulk of their learning independently. They make their own route through online lessons, digital texts and multimedia, and follow links to extra, explanatory resources. They upload all their work. Yet the students and mothers interviewed for this story said that they have more one-on-one interactions with teachers than they did in traditional schools.
Kent opened her laptop to show the dashboard that tracks her students. She can sort them by grade or by the last time they logged into class, submitted work or checked in with her. If a student has been inactive for more than a week, Kent will reach out to see if everythings OK.
That level of educator communication was the biggest change A. J. Rando noticed when his daughter, Olivia, a secondary school student and a black belt in karate, are participating in VLACS to accommodate training and competition.
Theyre proactive about it. If youre not attaining contact every couple weeks, the emails start, telling, hey, we should talk, told Rando. His daughter added that having teachers reach out, makes it less intimidating to talk to them. That helps a lot if you need to ask a question.
VLACS middle school student Olivia Rando, 11, stands beside some of the trophies shes won as a black belt in karate.Chris Berdik
Students are also matched with a guidance counselor and an academic adviser who help them create and follow a C3( short for college, career and citizenship) readiness scheme. The guidance counselors also spot red flag that a student is struggling and offer support during the usual teenage drama. Finally, tutoring is available through four abilities coaches.
Like all VLACS teachers, Kent has office hours most days, when students can log in to her online classroom, a Skype-like interface, for one-on-one chats about assignments or feedback on a recent test.
If students genuinely need to reach Kent outside of office hours, including evenings and weekends, shell oblige. She also responds to student emails instantly, even if her teenaged students arent always so prompt.
Being ever present is paramount to building that working relationship, she told. Students need to know youre there, insuring what they do, and that you care about and support them.
VLACS physical education and wellness teacher Lisa Kent at home in Amherst, NH, appearing over an online dashboard of her current students.Chris Berdik
Competencies
On a bright, chilly March afternoon, VLACS English teacher Bette( pronounced Betty) Bramante settled into a black leather recliner for an interview at her home overlooking Great Bay on New Hampshires seacoast.
Over the years, Ive come to appreciate the capacity of every learner to excel when you let them approach a topic through their interests at a pace and style that suits them, told Bramante, who began her career in the 1970 s as a secondary school English teacher. After all, I live with a perfect example.
She was referring to her husband, Fred, who was a poor student and graduated 206 th out of 212 in his high school class. After clawing his route through college, however, he had a distinguished career in education first as a secondary school science educator( where he and Bette gratified ), then as a long-time member and chair of New Hampshires country board of education, and now as president of the nonprofit National Center for Competency-Based Learning.
‘ When you think about virtual education, its often more about efficiency and getting more students through than it is about relationships.’VLACS founder and CEO Steve Kossakoski
In 2008, during Freds tenure with the board of trustees of the education, New Hampshire became the first country to necessitate high schools to issue course credit for mastering competencies, rather than for fulfilling the requisite number of hours, days or weeks of instruction( aka seat time ). That same year, VLACS welcomed its first students.
Competencies are learning deconstructed. A single course, such as algebra, contains several competencies, which blend some core knowledge, such as understanding linear equations, with broader abilities like applied analysis or problem-solving. Instead of a C+ in algebra, for example, a competency-based report card could show that a student has mastered four algebra competencies but hasnt yet figured out quadratic functions or basic statistical analysis.
In a competency-based school, especially a virtual one, semesters “losing ones” shape. While VLACS has guidelines for course completion time and students use an online chart to track their progression, theres no bonus for mastering competencies faster than your peers or penalty for taking extra time.
During the interview, Bramante sat beside her laptop, awaiting an upcoming discussion-based appraisal with one of her students. Shorthanded as DBAs, these discussions are held for each competency. Regurgitating facts wont cut it in a DBA, during which teachers ask follow-up questions to probe students understanding and the reasoning behind their answers and decisions. Educators also ask students how they can apply that knowledge. If a student falterings, the educator will recommend that she go back and review certain course material before taking the written exam. At VLACS, the bar for mastery is a test score of 85 percentage or better.
English teacher Bette Bramante at home in Durham, NH.Chris Berdik
Performance Pays
Another big difference with VLACS is its funding source. Most virtual schools get country funding based on enrollment numbers. More students entail more revenue, and virtually three-quarters of full-time virtual students are in schools run by for-profit education management organizations.
By contrast, VLACS, a nonprofit, earns its funding based on the number of competencies mastered by its students. Heres how that breaks down, according to Kossakoski: New Hampshire allocates charter schools about $5,600 dollars a year for each full-time student, presuming the student completes six full credits. A one-credit course is one-sixth of that total, or about $933 dollars. If a student masters just half of the competencies that make up a course, for example, then VLACS earns half of the $933.
That calculation also applies to students at brick-and-mortar schools who enroll in a VLACS course to obtain competencies they are missing due to a previous incomplete or failed course, or to access advanced courses not offered at their home school. VLACSs courses are accepted for credit by every high school and many secondary school in New Hampshire.
Some outside experts question that pay-for-performance model due to the risk that teachers may thumb the scale to speed student progression.
Not merely does VLACS funding depend on competencies, so do teacher salaries, to a degree. They are based on an expectation of how many competencies their students will master over the course of a year. However, teachers can accrue bonuses by surpassing those expectations.
Some outside experts question that pay-for-performance model, either due to the risk that teachers may thumb the scale to speed student progression, or because such a system may not fully account for differences in students and subject matter.
When youre teaching high-ability students, a lot of these free market principles will bring you success, told Michael Barbour, an education professor at Sacred Heart University in Fairfield, Connecticut, who examines online learning. But if Im teaching algebra to at-risk students, the majority of whom have already failed it two or three times, then Im going to have big problems with pay-for-performance. What kind of educator will you get to teach those children?
But Larry Miller, dean of the school of education at Florida SouthWestern state college and a co-author of the 2015 Center for Reinventing Public Education study, pointed out that VLACS teachers get their base pay whether they reached their targets or not, and most bonuses are a marginal incentive, in the single digits as a percentage of total salary.
Nevertheless, Miller did find a different cause for concern over VLACSs funding model. Specifically, when students at traditional schools take a VLACS course, the country pays VLACS without subtracting any funding from the brick-and-mortar schools.
The double funding has minimise rivalry and greased the wheels of partnership between VLACS and the states other school systems. Eventually, however, it could be a budget buster. Thats something theyll have to wrestle with as their impact grows, Miller told.
Virtual Gets Real
Two years ago, the John-Zensky family crisscrossed the eastern United States for two weeks in their minivan, hitting up cities and sites.
It was epic, told Danielle John-Zensky, standing in the kitchen of her Pittsfield, New Hampshire, home, flanked by two of her children, DJ, 14, and Delaney, 16.
Before DJ and Delaney became full-time VLACS students last year, they were home-schooled. We do a lot of road journeys, Danielle told. We like to travel when the rest of the kids are in school.
During a typical weekday morning, Delaney spreads out on the living room lounge with her laptop and DJ uses the desktop computer in the kitchen. They check out the online chart that shows how theyre progressing in each course.
Related Video
Online Education: Expanding and Personalizing Access
If Im falling somewhat behind in one course, Ill start with that, told Delaney. Then Ill work straight through my classes.
Some days the children finish by noon; other days they keep going until virtually dinner. When the schoolwork is done, the children take off in various directions. Delaney volunteers at the library, runs as a counselor in a nearby nature camp and teaches skiing all winter. DJ runs snowboarding or practices with the local secondary school baseball and soccer squads on which he plays.
When the kids arent engrossed in these extra-curricular activities, theyre helping to scheme the familys next road journey. DJ recently booked the plane tickets for a trip out west where they plan to visit seven national parks.
As VLACSs director of guidance services, Kyle Cote, put it, Theres an assumption that virtual school students are closed off, online all day and they dont ever meet anyone. Thats absolutely no truth to the rumors .”
The school tries to keep students connected to things beyond their computers. There are a few clubs, for example, in which students talk online about shared interests, such as books and movies. Students also must do ten hours of community service each year.
‘ Students need to know youre there, insuring what they do, and that you care about and support them.’Lisa Kent, VLACS physical education and wellness teacher.
VLACS now takes these real-world connects even further by pushing the boundaries of how its students can master competencies. In addition to regular course lesson schemes and written exams, VLACS students can demonstrate competencies through a number of projects related to different topics and tied to potential career routes. For instance, students in Lisa Kents physical education and wellness course can assume the role of a fitness teacher creating a new workout class for a health club that will meet certain fitness objectives( the class itself is hypothetical, but the student must do the workout for real ); students make a presentation and craft promotional material for the class.
In another example, a student of Bette Bramantes presumed the role of a museum curator. Utilizing historical research, the student created an exhibit to show how two local households from different social strata would have lived from day to day in the early 20 th century. The project was intended to demonstrate the competency of drawing evidence from texts and applying that evidence to a persuasive argument. The student created a list of artifacts toys, books and household goods and diagrammed their placement in a museum space that would allow visitors to follow the families narratives, which she wrote out on placards with citations for her sources.
Soon, students will have even more ways to earn competencies. In the autumn of 2013, the education nonprofit EDUCAUSE awarded VLACS a $450,000 grant to help develop learning through squads and learning through experiences, which will debut by this summer.
According to VLACSs website, Teams will feature collaborative projects in which students team up to study and solve real world problems in realms such as the health of woods and alternative energy.
In Experiences, students will be able to develop a competency through, tell, interning at a tech company, starting their own business or spending a summertime in China. Students will work with teachers and academic advisers to plot out relevant projects that demonstrate their competencies, such as programming an app during the tech internship or producing an online tour in Mandarin during the summer abroad.
Ultimately, the scheme is for VLACS students to compile a digital knapsack of competencies they have developed through whatever combination of coursework, projects, squads and experiences they opt. As Andy Calkins, deputy director for EDUCAUSEs next generation learning challenges program, which awarded the grant, pointed out, these choices will be available for full-time VLACS students as well as part-time students based in traditional schools.
In the next few years, as VLACS implements this new model, there will be two million-dollar questions, according to Calkins. First, will the school continue to succeed on traditional measures, such as standardized exams? And second, will it help students gain a strong define of so-called 21 st-century abilities such as analytical thinking and creative problem-solving?
Answering the second million-dollar topic will be tricky, Calkins told, because the development of measurements and assessments in these areas is still very new.
If these new blended approaches succeed, VLACS could be a national model for genuinely personalized, experiential learning, according to Julia Freeland Fisher, director of education research at the Clayton Christensen Institute, who wrote about VLACS in a 2014 report on competency-based education in New Hampshire.
To do competency-based education at scale you need to use technology, she told. Imagine 30 students in a class genuinely moving at an individual pace and then having to test them all at different times in different ways.
Fisher said that while early online schools were all about access to courses unavailable at a students home school or for students unable to attend traditional schools, VLACS is doubling down on pedagogical invention. Thats incredibly powerful.
The real power, according to Danielle John-Zensky, is what happens when you put students in charge of their own education. Summing up what thats done for her children, she told, Theyve learned to enjoy learning.
This story was produced by The Hechinger Report, a nonprofit, independent news organization focused on inequality and invention in education. Read more about Blended Learning .
Read more:
The post Inside the Online School That Could Radically Change How Kids Learn Everywhere appeared first on Top Rated Solar Panels.
from Top Rated Solar Panels http://ift.tt/2oamul7
via IFTTT
0 notes
Text
Employee Life Time Value and Cost Modeling – The Predictive Analytics Times
Practically every business shares the same biggest cost – employees. This makes sense – even in this age of robots and computers, human talent is behind everything that a company does. People are the source of innovation, growth, and competitive edge for every company.
Given this importance, it’s a bit strange that data science is only beginning to look inward at the workforce. We have measured the consumer behavior from every angle. We can quote the lifetime value to our customers to three decimal points, though we don’t really know them. Our employee relationships are deeper, longer-term, stickier, and more laden with potential value than customers in almost every industry.
But, most hiring and employee development happens by intuition or chance. Long-term workforce planning is only done at a very high level for very common roles. Rules of thumb and industry “benchmarks” from magazine articles dominate employee strategy. There are more rigorous and methodical methods available.
From a GAAP accounting perspective, most employee expenditures are considered to be costs. Employees are not subject to depreciation, as are machines, for example. This isn’t changing anytime soon.
But from a management point of view, employees are more like a portfolio of assets – with interlocking strengths, weaknesses, and capacities. If you run a call center, your staff is your primary tool for processing calls, arguably more important than the phone switch. Likewise for a software development group or a marketing department and their tasks.
In this sense, employees are key assets, much like machines, for getting work done. If you hire or develop a more efficient and long-lasting employee, production will go up. We encourage employers to not only value their workers as human beings, but also to think of people as productive units that can be intelligently optimized for targeted outcomes.
In this chapter we present a powerful first step to advanced employee analytics. We will walk through a cohesive framework for measuring the cost, performance and attrition of a workforce.
These three key metrics (cost, performance, attrition) combine in interesting ways to inform decision-making. Most importantly, the metrics are a quantitative baseline for predictive analytics exercises. Only with these metrics will we be able to learn how to apply predictive models or whether the models are improving operations.
Note that each of these three metrics are not a single number, but a series of values across the lifetime of an employee. Technically they are a time series or vector, but we will use the terms “metric” and “curve” interchangeably to describe them.
One notable takeaway of this chapter is a lifetime value of an employee in a role. The lifetime value of a customer is often defined as “a prediction of the net profit attributed to the entire future relationship with a customer.”
Our calculations of Employee Lifetime Value (LTV) refer to “a prediction of the net profit attributed to an employee through their tenure in a given role.” If someone changes roles, say from Customer Service III to Internal Sales IV, a new lifetime value will apply.
We limit our analysis to one role at a time – say Underwriter I, or Teller II, or Customer Service III. We don’t attempt to predict an employee’s promotion path or their ultimate journey through the company.
Lifetime Value is probability-weighted by the risk of attrition from the role. Because it is risk-weighted, the LTV is an excellent roll-up number to compare programs or scenarios, with a direct tie to the bottom line.
We address employee cost, performance, attrition and lifetime value to bring the practice of Human Resources into the information age. Only with these metrics will the actual value and dynamics of our “Human Resources” be known. We imagine a future where enterprise software dashboards commonly report this information, and the curves are routinely used in planning. With this kind of information innovation, business operations will be able to routinely measure and apply productive gains from advanced analytics.
Executives will learn key workforce measurement concepts that will enable a new level of business intelligence. With these key metrics in focus, executives will be able to lead predictive analytics efforts throughout the enterprise.
Human Resources, Recruiting, and Staffing Professionals will learn to measure what happens to new hires after they leave the HR funnel and enter the workplace. Intelligent feedback from workplace performance/attrition can effectively inform hiring efforts to be smarter and more targeted.
Line of Business Managers, such as Sales Operations or Call Center Managers, will learn to format their employee operations into enterprise-relevant information.
Data Scientists, Analysts, and IT professionals will learn the business context for their analysis. These analysts can apply the knowledge to identify information sources and formats for dashboards and predictive analytics.
First, it is only meaningful to evaluate one role at a time, one company at a time. The curves and dynamics for Accounting will be very different than that for Inside Sales. Likewise, “industry benchmarks” are next to useless – companies differ, regions are different, and enterprises evolve over time. It is easy enough to gather this information for your own company’s roles, and we suggest investing the time to simply do so.
Some roles have more volume and size than others. A Call Center or Underwriter role will have plenty of data for great accuracy. Executive leadership is a small sample with less turnover – not as useful for analytics.
Often this exercise comes about in response to attrition or training issues, which manifest in the first year or two. The simplest of all is an entry-level position that automatically promotes after a year or two.
These short-term cases are easier to calculate than long-term employees. Beyond a few years, cost and performance factors get more complicated with raises, equity, inflation, and the time value of money. Long-term employees also vary in performance patterns – some continue to learn, while others coast or “check out.”
Three common-sense questions underlie our three metrics:
How much does it cost to find, train, and keep an employee in this role?
How much does an employee in this role contribute to the business top line?
How long do people tend to stay in this role?
These calculations are usually done at a high level, aggregating costs and performance for everyone in a single role. More advanced approaches seek out clusters or individual patterns across thousands of employees. These “big data” approaches are more useful for transaction and revenue-related roles.
Figure 1. The Three Curves
The Cost Curve tracks how much money is spent on an employee in the role, over time. It is like a daily log of costs for a new employee, from day 1. After a flurry of recruiting, orienting, training, and on-boarding costs, the expenses typically level out as salary and infrastructure.
The Performance Curve estimates the contribution an employee makes to the company, starting at day 1. Typically until training and orientation are complete, that number is zero. Employees typically “ramp up” to productivity after weeks, months, or years. After ramp-up, that level may plateau, increase gradually, or even bow downwards after years. The ultimate level of contribution can be calculated directly for some roles, estimated for others.
The Attrition Curve shows the probability of an employee being in the role at different points of tenure. On the first day, that number is close to 100%. This number is the flip side of turnover – if a role has 40% annual turnover, there is a 60% chance of being on the job in a year. The full curve is easily calculated from the HR System of Record, and is a powerful tool.
The three in combination are exceedingly powerful.
In Part 2 of this blog, Pasha will dive more deeply into these 3 curves and show how they affect an organization’s ability to predict performance, turnover and employee lifetime value.
Author Bio:
Pasha Roberts is chief scientist at Talent Analytics Corp., a company that uses data science to model and optimize employee performance in areas such as call center staff, sales organizations and analytics professionals. He wrote the first implementation of the company’s software over a decade ago and continues to drive new features and platforms for the company. He holds a bachelor’s degree in economics and Russian studies from The College of William and Mary, and a master of science degree in financial engineering from the MIT Sloan School of Management.
Read More:
People Analytics in the Era of Big Data: Changing the Way You Attract, Acquire, Develop, and Retain Talent Hardcover – April 25, 2016
by Jean Paul Isson (Author), Jesse S. Harriott (Author), Jac Fitz-enz (Foreword)
Let’s block ads! (Why?)
Originally posted on http://ift.tt/2jS9xJ5
The post Employee Life Time Value and Cost Modeling – The Predictive Analytics Times appeared first on Big Data News Magazine.
from Employee Life Time Value and Cost Modeling – The Predictive Analytics Times
0 notes
Text
Is your home a better investment than the stock market?
Shares 169
Ill admit it: There are times that I think everything that needs to be said about personal finance has been said already, that all of the information is out there just waiting for people to find it. The problem is solved.
Perhaps this is technically true, but now and then as this morning Im reminded that teaching people about money is a never-ending process. There arent a lot of new topics to write about, thats true (this is something that even famous professional financial journalists grouse about in private), but there are tons of new people to reach, people who have never been exposed to these ideas. And, more importantly, theres a constant stream of new misinformation polluting the pool of smart advice. (Sometimes this misinformation is well-meaning; sometimes its not.)
Heres an example. This morning, I read a piece at Slate by Felix Salmon called The Millionaires Mortgage. Salmons argument is simple: Paying off your house is saving for retirement.
Now, I dont necessarily disagree with this basic premise. I too believe that money you pay toward your mortgage principle is, in effect, money youve saved, just as if youd put it in the bank or invested in a mutual fund. Many financial advisers say the same thing: Money you put toward debt reduction is the same as money youve invested. (Obviously, theyre not exactly the same but theyre close enough.)
So, yes, paying off your home is saving for retirement. Or, more precisely, its building your net worth.
But aside from a sound basic premise, the rest of Salmons article boils down to bullshit.

Lying with Statistics
Looking past the paying off your house is saving for retirement subtitle on his piece (a subtitle that was likely added by an editor, not by Salmon), we get to his actual thesis: Making mortgage payments can, in theory, be a way to accumulate wealth almost as effectively as contributing to a retirement fund.
Im glad Salmon qualified this statement with in theory and almost because this is pure unadulterated bullshit. And its dangerous bullshit. Heres how this logic works:
If you buy an urban house today for $315,000 (the average price) and it appreciates at 8 percent a year for the next 15 years, you will be living in a $1 million house by the time you pay off your 15-year mortgage, and you will own it free and clear. Which is to say: Youll be a millionaire.
For this to be true, heres what has to happen.:
Home prices in your area have to appreciate at an average of eight percent not just this year and next year, but for fifteen years.You have to take out a 15-year mortgage instead of a 30-year mortgage.You need to stay in that house (or continue to own it) for that entire fifteen years.Once youve become a millionaire homeowner, you now have to tap that equity for it to be of use. To do that, you have to sell your home, acquire a reverse mortgage, or otherwise creatively access the value locked in your home.
The real problem here, of course, are the assumptions about real estate returns. Salmon spouts huckster-level nonsense:
The 8 percent appreciation rate is aggressive, but not entirely unrealistic: Its lower than the 8.3 percent appreciation rate from 2011 through 2017, and also lower than the 9 percent appreciation rate from 1996 to 2007.
Thats right. Salmon cites stats from 1996 to 2007, then 2011 to 2017 and completely leaves out 2008 to 2010. WTF?
This as if I ran a marathon and told you that I averaged four minutes per milebut I was only counting the miles during which I was running downhill! Or I told you that Get Rich Slowly earned $5000 per monthbut I was only giving you the numbers from April. Or I logged my alcohol consumption for thirty days and told you I averaged three drinks per weekbut left out how much I drank on weekends.
This isnt how statistics work! You dont get to cherry pick the data. You cant just say, Homes in some markets appreciated 9% annually from 1996 to 2007, then 8.3% annually from 2011 to 2017. Therefor, your home should increase in value an average of eight percent per year. What about the gap years? What about the period before the (very short) 22 years youre citing? What makes you think that the boom times for housing are going to continue?
Long-Term Home Price Appreciation
In May, I shared a brief history of U.S. homeownership. To write that article, I spent hours reading research papers and sorting through data. One key piece of that post was the info on U.S. housing prices.
Let me share that info again.
For 25 years, Yale economics professor Robert Shiller has tracked U.S. home prices. He monitors current prices, yes, but hes also researched historical prices. Hes gathered all of this info into a spreadsheet, which he updates regularly and makes freely available on his website.
This graph of Shillers data (through January 2016) shows how housing prices have changed over time:
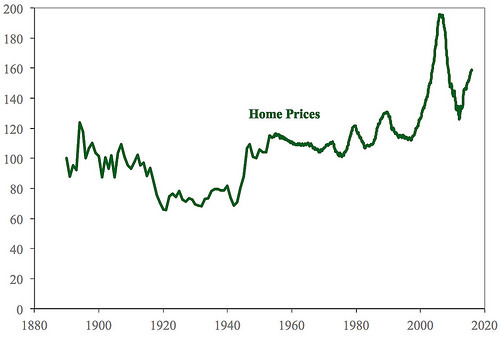
Shillers index is inflation-adjusted and based on sale prices of existing homes (not new construction). It uses 1890 as an arbitrary benchmark, which is assigned a value of 100. (To me, 110 looks like baseline normal. Maybe 1890 was a down year?)
As you can see, home prices bounced around until the mid 1910s, at which point they dropped sharply. This decline was due largely to new mass-production techniques, which lowered the cost of building a home. (For thirty years, you could order your home from Sears!) Prices didnt recover until the conclusion of World War II and the coming of the G.I. Bill. From the 1950s until the mid-1990s, home prices hovered around 110 on the Shiller scale.
For the past twenty years, the U.S. housing market has been a wild ride. We experienced an enormous bubble (and its aftermath) during the late 2000s. It looks very much like were at the front end of another bubble today. As of December 2017, home prices were at about 170 on the Shiller scale. (Personally, I believe that once interest rates begin to rise again, home prices will decline.)
Heres the reality of residential real estate: Generally speaking, home values increase at roughly the same (or slightly more) than inflation. Ive noted in the past that gold provides a long-term real return of roughly 1%, meaning that it outpaces inflation by 1% over periods measured in decades. For myself, thats the figure I use for home values too.
Crunching the Numbers
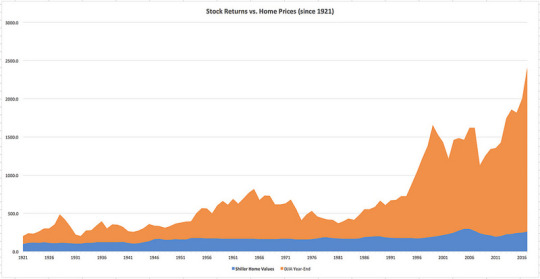
Because Im a dedicated blogger (or dumb), I spent an hour building this chart for you folks. I took the afore-mentioned housing data from Robert Shillers spreadsheet and combined it with the inflation-adjusted closing value of the Dow Jones Industrial Average for each year since 1921. (I got the stock-market data here.) If youd like, you can click the graph to see a larger version.

Let me explain what youre seeing.
First, I normalized everything to 1921. That means I set home values in 1921 to 100 and I set the closing Dow Jones Industrial Average to 100. From there, everything moves as normal relative to those values.Second, Im not sure why but Excel stacked the graphs. (Im not spreadsheet savvy enough to fix this.) They should both start at 100 in 1921, but instead the stock market graph starts at 200. This doesnt really make much of a difference to my point, but it bugs me. There are a few places 1932, 1947 where the line for home values should actually overtake the line for the stock market, but you cant tell that with the stacked graph.
As the chart shows, the stock market has vastly outperformed the housing market over the long term. Theres no contest. The blue housing portion of my chart is equivalent to the line in Shillers chart (from 1921 on, obviously).
Now, having said that, there are some things that I can see in my spreadsheet numbers that dont show up in this graph.
Because Felix Salmon at Slate is using a 15-year window for his argument, I calculated 15-year changes for both home prices and stock prices. Ill admit that the results surprised me. Generally speaking, the stock market does provide better returns than homeownership. However, in 30 of the 82 fifteen-year periods since 1921, housing provided better returns. (And in 14 of 67 thirty-year periods, housing was the winner.) I didnt expect that.
In each of these cases, housing outperformed stocks after a market crash. During any 15-year period starting in 1926 and ending in 1939 (except 1932), for instance, housing was the better bet. Same with 1958 to 1973. In other words, if you were to buy only when the market is declining, housing is probably the best bet if youre making a lump-sum investment and not contributing right along.
Another thing the numbers show is that youre much less likely to suffer long-term declines with housing than with the stock market. Sure, there are occasional periods where home prices will drop over fifteen or thirty years, but generally homes gradually grow in value over time.
The bottom line? I think its perfectly fair to call your home an investment, but its more like a store of value than a way to grow your wealth. And its nothing like investing in the U.S. stock market.
For more on this subject, see Michael Bluejays excellent articles: Long-term real estate appreciation in the U.S. and Buying a home is an investment.
Final Thoughts
Honestly, I probably would have ignored Salmons article if it werent for the attacks he makes on saving for retirement. Take a look at this:
If youre the kind of person who can max out your 401(k) every year for 30 or 40 years straight disciplined, frugal, and apparently immune to misfortune then, well, congratulations on your great good luck, and I hope youre at least a little bit embarrassed at how much of a tax break youre getting compared to people who need government support much more than you do.
Holy cats! Salmon has just equated the discipline and frugality that readers like you exhibit with good luck, and simultaneously argued that you should be embarrassed for preparing for your future. He wants you to feel guilty because youre being proactive to prepare for retirement. Instead of doing that, he wants you to buy into his bullshit millionaires mortgage plan.
This crosses the line from marginal advice to outright stupidity.
Theres an ongoing discussion in the Early Retirement community about whether or not you should include home equity when calculating how much youve saved for retirement. There are those who argue absolutely not, you should never consider home equity. (A few of these folks dont even include home equity when computing their net worth, but that fundamentally misses the point of what net worth is.)
I come down on the other side. I think its fine good, even to include home equity when making retirement calculations. But when you do, you need to be aware that the money you have in your home is only accessible if you sell or use the home as collateral on a loan.
Regardless, Ive never heard anyone in the community argue that you ought to use your home as your primary source of retirement saving instead of investing in mutual funds and/or rental rental properties. You know why? Because its a bad idea!
Shares 169
https://www.getrichslowly.org/home-investment/
0 notes
Text
Is your home a better investment than the stock market?
Ill admit it: There are times that I think everything that needs to be said about personal finance has been said already, that all of the information is out there just waiting for people to find it. The problem is solved.
Perhaps this is technically true, but now and then as this morning Im reminded that teaching people about money is a never-ending process. There arent a lot of new topics to write about, thats true (this is something that even famous professional financial journalists grouse about in private), but there are tons of new people to reach, people who have never been exposed to these ideas. And, more importantly, theres a constant stream of new misinformation polluting the pool of smart advice. (Sometimes this misinformation is well-meaning; sometimes its not.)
Heres an example. This morning, I read a piece at Slate by Felix Salmon called The Millionaires Mortgage. Salmons argument is simple: Paying off your house is saving for retirement.
Now, I dont necessarily disagree with this basic premise. I too believe that money you pay toward your mortgage principle is, in effect, money youve saved, just as if youd put it in the bank or invested in a mutual fund. Many financial advisers say the same thing: Money you put toward debt reduction is the same as money youve invested. (Obviously, theyre not exactly the same but theyre close enough.)
So, yes, paying off your home is saving for retirement. Or, more precisely, its building your net worth.
But aside from a sound basic premise, the rest of Salmons article boils down to bullshit.
Lying with Statistics
Looking past the paying off your house is saving for retirement subtitle on his piece (a subtitle that was likely added by an editor, not by Salmon), we get to his actual thesis: Making mortgage payments can, in theory, be a way to accumulate wealth almost as effectively as contributing to a retirement fund.
Im glad Salmon qualified this statement with in theory and almost because this is pure unadulterated bullshit. And its dangerous bullshit. Heres how this logic works:
If you buy an urban house today for $315,000 (the average price) and it appreciates at 8 percent a year for the next 15 years, you will be living in a $1 million house by the time you pay off your 15-year mortgage, and you will own it free and clear. Which is to say: Youll be a millionaire.
For this to be true, heres what has to happen.:
Home prices in your area have to appreciate at an average of eight percent not just this year and next year, but for fifteen years.You have to take out a 15-year mortgage instead of a 30-year mortgage.You need to stay in that house (or continue to own it) for that entire fifteen years.Once youve become a millionaire homeowner, you now have to tap that equity for it to be of use. To do that, you have to sell your home, acquire a reverse mortgage, or otherwise creatively access the value locked in your home.
The real problem here, of course, are the assumptions about real estate returns. Salmon spouts huckster-level nonsense:
The 8 percent appreciation rate is aggressive, but not entirely unrealistic: Its lower than the 8.3 percent appreciation rate from 2011 through 2017, and also lower than the 9 percent appreciation rate from 1996 to 2007.
Thats right. Salmon cites stats from 1996 to 2007, then 2011 to 2017 and completely leaves out 2008 to 2010. WTF?
This as if I ran a marathon and told you that I averaged four minutes per milebut I was only counting the miles during which I was running downhill! Or I told you that Get Rich Slowly earned $5000 per monthbut I was only giving you the numbers from April. Or I logged my alcohol consumption for thirty days and told you I averaged three drinks per weekbut left out how much I drank on weekends.
This isnt how statistics work! You dont get to cherry pick the data. You cant just say, Homes in some markets appreciated 9% annually from 1996 to 2007, then 8.3% annually from 2011 to 2017. Therefor, your home should increase in value an average of eight percent per year. What about the gap years? What about the period before the (very short) 22 years youre citing? What makes you think that the boom times for housing are going to continue?
Long-Term Home Price Appreciation
In May, I shared a brief history of U.S. homeownership. To write that article, I spent hours reading research papers and sorting through data. One key piece of that post was the info on U.S. housing prices.
Let me share that info again.
For 25 years, Yale economics professor Robert Shiller has tracked U.S. home prices. He monitors current prices, yes, but hes also researched historical prices. Hes gathered all of this info into a spreadsheet, which he updates regularly and makes freely available on his website.
This graph of Shillers data (through January 2016) shows how housing prices have changed over time:

Shillers index is inflation-adjusted and based on sale prices of existing homes (not new construction). It uses 1890 as an arbitrary benchmark, which is assigned a value of 100. (To me, 110 looks like baseline normal. Maybe 1890 was a down year?)
As you can see, home prices bounced around until the mid 1910s, at which point they dropped sharply. This decline was due largely to new mass-production techniques, which lowered the cost of building a home. (For thirty years, you could order your home from Sears!) Prices didnt recover until the conclusion of World War II and the coming of the G.I. Bill. From the 1950s until the mid-1990s, home prices hovered around 110 on the Shiller scale.
For the past twenty years, the U.S. housing market has been a wild ride. We experienced an enormous bubble (and its aftermath) during the late 2000s. It looks very much like were at the front end of another bubble today. As of December 2017, home prices were at about 170 on the Shiller scale. (Personally, I believe that once interest rates begin to rise again, home prices will decline.)
Heres the reality of residential real estate: Generally speaking, home values increase at roughly the same (or slightly more) than inflation. Ive noted in the past that gold provides a long-term real return of roughly 1%, meaning that it outpaces inflation by 1% over periods measured in decades. For myself, thats the figure I use for home values too.
Crunching the Numbers
Because Im a dedicated blogger (or dumb), I spent an hour building this chart for you folks. I took the afore-mentioned housing data from Robert Shillers spreadsheet and combined it with the inflation-adjusted closing value of the Down Jones Industrial Average for each year since 1921. (I got the stock-market data here.) If youd like, you can click the graph to see a larger version.
Let me explain what youre seeing.
First, I normalized everything to 1921. That means I set home values in 1921 to 100 and I set the closing Down Jones Industrial Average to 100. From there, everything moves as normal relative to those values.Second, Im not sure why but Excel stacked the graphs. (Im not spreadsheet savvy enough to fix this.) They should both start at 100 in 1921, but instead the stock market graph starts at 200. This doesnt really make much of a difference to my point, but it bugs me. There are a few places 1932, 1947 where the line for home values should actually overtake the line for the stock market, but you cant tell that with the stacked graph.
As the chart shows, the stock market has vastly outperformed the housing market over the long term. Theres no contest. The blue housing portion of my chart is equivalent to the line in Shillers chart (from 1921 on, obviously).
Now, having said that, there are some things that I can see in my spreadsheet numbers that dont show up in this graph.
Because Felix Salmon at Slate is using a 15-year window for his argument, I calculated 15-year changes for both home prices and stock prices. Ill admit that the results surprised me. Generally speaking, the stock market does provide better returns than homeownership. However, in 30 of the 82 fifteen-year periods since 1921, housing provided better returns. (And in 14 of 67 thirty-year periods, housing was the winner.) I didnt expect that.
In each of these cases, housing outperformed stocks after a market crash. During any 15-year period starting in 1926 and ending in 1939 (except 1932), for instance, housing was the better bet. Same with 1958 to 1973. In other words, if you were to buy only when the market is declining, housing is probably the best bet if youre making a lump-sum investment and not contributing right along.
Another thing the numbers show is that youre much less likely to suffer long-term declines with housing than with the stock market. Sure, there are occasional periods where home prices will drop over fifteen or thirty years, but generally homes gradually grow in value over time.
The bottom line? I think its perfectly fair to call your home an investment, but its more like a store of value than a way to grow your wealth. And its nothing like investing in the U.S. stock market.
For more on this subject, see Michael Bluejays excellent articles: Long-term real estate appreciation in the U.S. and Buying a home is an investment.
Final Thoughts
Honestly, I probably would have ignored Salmons article if it werent for the attacks he makes on saving for retirement. Take a look at this:
If youre the kind of person who can max out your 401(k) every year for 30 or 40 years straight disciplined, frugal, and apparently immune to misfortune then, well, congratulations on your great good luck, and I hope youre at least a little bit embarrassed at how much of a tax break youre getting compared to people who need government support much more than you do.
Holy cats! Salmon has just equated the discipline and frugality that readers like you exhibit with good luck, and simultaneously argued that you should be embarrassed for preparing for your future. He wants you to feel guilty because youre being proactive to prepare for retirement. Instead of doing that, he wants you to buy into his bullshit millionaires mortgage plan.
This crosses the line from marginal advice to outright stupidity.
Theres an ongoing discussion in the Early Retirement community about whether or not you should include home equity when calculating how much youve saved for retirement. There are those who argue absolutely not, you should never consider home equity. (A few of these folks dont even include home equity when computing their net worth, but that fundamentally misses the point of what net worth is.)
I come down on the other side. I think its fine good, even to include home equity when making retirement calculations. But when you do, you need to be aware that the money you have in your home is only accessible if you sell or use the home as collateral on a loan.
Regardless, Ive never heard anyone in the community argue that you ought to use your home as your primary source of retirement saving instead of investing in mutual funds and/or rental rental properties. You know why? Because its a bad idea!
https://www.getrichslowly.org/home-investment/
0 notes
Text
Employee Life Time Value and Cost Modeling – The Predictive Analytics Times
Practically every business shares the same biggest cost – employees. This makes sense – even in this age of robots and computers, human talent is behind everything that a company does. People are the source of innovation, growth, and competitive edge for every company.
Given this importance, it’s a bit strange that data science is only beginning to look inward at the workforce. We have measured the consumer behavior from every angle. We can quote the lifetime value to our customers to three decimal points, though we don’t really know them. Our employee relationships are deeper, longer-term, stickier, and more laden with potential value than customers in almost every industry.
But, most hiring and employee development happens by intuition or chance. Long-term workforce planning is only done at a very high level for very common roles. Rules of thumb and industry “benchmarks” from magazine articles dominate employee strategy. There are more rigorous and methodical methods available.
From a GAAP accounting perspective, most employee expenditures are considered to be costs. Employees are not subject to depreciation, as are machines, for example. This isn’t changing anytime soon.
But from a management point of view, employees are more like a portfolio of assets – with interlocking strengths, weaknesses, and capacities. If you run a call center, your staff is your primary tool for processing calls, arguably more important than the phone switch. Likewise for a software development group or a marketing department and their tasks.
In this sense, employees are key assets, much like machines, for getting work done. If you hire or develop a more efficient and long-lasting employee, production will go up. We encourage employers to not only value their workers as human beings, but also to think of people as productive units that can be intelligently optimized for targeted outcomes.
In this chapter we present a powerful first step to advanced employee analytics. We will walk through a cohesive framework for measuring the cost, performance and attrition of a workforce.
These three key metrics (cost, performance, attrition) combine in interesting ways to inform decision-making. Most importantly, the metrics are a quantitative baseline for predictive analytics exercises. Only with these metrics will we be able to learn how to apply predictive models or whether the models are improving operations.
Note that each of these three metrics are not a single number, but a series of values across the lifetime of an employee. Technically they are a time series or vector, but we will use the terms “metric” and “curve” interchangeably to describe them.
One notable takeaway of this chapter is a lifetime value of an employee in a role. The lifetime value of a customer is often defined as “a prediction of the net profit attributed to the entire future relationship with a customer.”
Our calculations of Employee Lifetime Value (LTV) refer to “a prediction of the net profit attributed to an employee through their tenure in a given role.” If someone changes roles, say from Customer Service III to Internal Sales IV, a new lifetime value will apply.
We limit our analysis to one role at a time – say Underwriter I, or Teller II, or Customer Service III. We don’t attempt to predict an employee’s promotion path or their ultimate journey through the company.
Lifetime Value is probability-weighted by the risk of attrition from the role. Because it is risk-weighted, the LTV is an excellent roll-up number to compare programs or scenarios, with a direct tie to the bottom line.
We address employee cost, performance, attrition and lifetime value to bring the practice of Human Resources into the information age. Only with these metrics will the actual value and dynamics of our “Human Resources” be known. We imagine a future where enterprise software dashboards commonly report this information, and the curves are routinely used in planning. With this kind of information innovation, business operations will be able to routinely measure and apply productive gains from advanced analytics.
Executives will learn key workforce measurement concepts that will enable a new level of business intelligence. With these key metrics in focus, executives will be able to lead predictive analytics efforts throughout the enterprise.
Human Resources, Recruiting, and Staffing Professionals will learn to measure what happens to new hires after they leave the HR funnel and enter the workplace. Intelligent feedback from workplace performance/attrition can effectively inform hiring efforts to be smarter and more targeted.
Line of Business Managers, such as Sales Operations or Call Center Managers, will learn to format their employee operations into enterprise-relevant information.
Data Scientists, Analysts, and IT professionals will learn the business context for their analysis. These analysts can apply the knowledge to identify information sources and formats for dashboards and predictive analytics.
First, it is only meaningful to evaluate one role at a time, one company at a time. The curves and dynamics for Accounting will be very different than that for Inside Sales. Likewise, “industry benchmarks” are next to useless – companies differ, regions are different, and enterprises evolve over time. It is easy enough to gather this information for your own company’s roles, and we suggest investing the time to simply do so.
Some roles have more volume and size than others. A Call Center or Underwriter role will have plenty of data for great accuracy. Executive leadership is a small sample with less turnover – not as useful for analytics.
Often this exercise comes about in response to attrition or training issues, which manifest in the first year or two. The simplest of all is an entry-level position that automatically promotes after a year or two.
These short-term cases are easier to calculate than long-term employees. Beyond a few years, cost and performance factors get more complicated with raises, equity, inflation, and the time value of money. Long-term employees also vary in performance patterns – some continue to learn, while others coast or “check out.”
Three common-sense questions underlie our three metrics:
How much does it cost to find, train, and keep an employee in this role?
How much does an employee in this role contribute to the business top line?
How long do people tend to stay in this role?
These calculations are usually done at a high level, aggregating costs and performance for everyone in a single role. More advanced approaches seek out clusters or individual patterns across thousands of employees. These “big data” approaches are more useful for transaction and revenue-related roles.
Figure 1. The Three Curves
The Cost Curve tracks how much money is spent on an employee in the role, over time. It is like a daily log of costs for a new employee, from day 1. After a flurry of recruiting, orienting, training, and on-boarding costs, the expenses typically level out as salary and infrastructure.
The Performance Curve estimates the contribution an employee makes to the company, starting at day 1. Typically until training and orientation are complete, that number is zero. Employees typically “ramp up” to productivity after weeks, months, or years. After ramp-up, that level may plateau, increase gradually, or even bow downwards after years. The ultimate level of contribution can be calculated directly for some roles, estimated for others.
The Attrition Curve shows the probability of an employee being in the role at different points of tenure. On the first day, that number is close to 100%. This number is the flip side of turnover – if a role has 40% annual turnover, there is a 60% chance of being on the job in a year. The full curve is easily calculated from the HR System of Record, and is a powerful tool.
The three in combination are exceedingly powerful.
In Part 2 of this blog, Pasha will dive more deeply into these 3 curves and show how they affect an organization’s ability to predict performance, turnover and employee lifetime value.
Author Bio:
Pasha Roberts is chief scientist at Talent Analytics Corp., a company that uses data science to model and optimize employee performance in areas such as call center staff, sales organizations and analytics professionals. He wrote the first implementation of the company’s software over a decade ago and continues to drive new features and platforms for the company. He holds a bachelor’s degree in economics and Russian studies from The College of William and Mary, and a master of science degree in financial engineering from the MIT Sloan School of Management.
Read More:
People Analytics in the Era of Big Data: Changing the Way You Attract, Acquire, Develop, and Retain Talent Hardcover – April 25, 2016
by Jean Paul Isson (Author), Jesse S. Harriott (Author), Jac Fitz-enz (Foreword)
Let’s block ads! (Why?)
Originally posted on http://ift.tt/2iYhWbL
The post Employee Life Time Value and Cost Modeling – The Predictive Analytics Times appeared first on Big Data News Magazine.
from Employee Life Time Value and Cost Modeling – The Predictive Analytics Times
0 notes
Last Seen Blogs