#catterplot
Explore tagged Tumblr posts
Visit Tumblr Blog
Explore Tumblr blogs with no restrictions, modern design and the best experience.
Last Seen Tumblr Blogs


Fun Fact
The most popular pages on Tumblr are about Minecraft, GIFs, and David J. Peterson.
Text
Catterplot
Today, we will be doing a fun little project -- playing around with the catterplot feature in R.
I saw the catterplot library and realized I needed to do something right away with cats, but what exactly? If you haven’t seen the catterplot library yet, check it out on github here. It’s probably one of my favorite useless R libraries next to the ubeR library --- for when you’re so lazy you have to order an ubeR from your console.
Obviously, if you have something that plots catterplots, you need to use cat data to play around with it. A quick google search leads me to this convenient cat data on cat weight vs. their heart weight which will be perfect for the catterplot. Below is the code used to generate our catterplot:
install.packages('devtools') library(devtools) install_github("Gibbsdavidl/CatterPlots") library(CatterPlots) install.packages('boot') library(boot) dogscats <- catplot(catsM$Bwt, catsM$Hwt, size=0.1, catcolor=c(0.7,0.7,0.7,1), cat=11, xlab="Body Weight", ylab="Heart Weight", main="Cat Body Weight vs. Heart Weight")
and here is the catterplot generated:
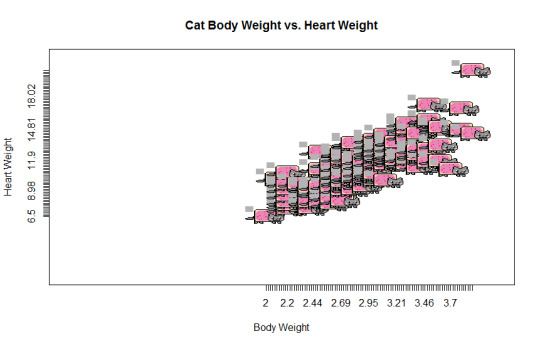
I seem to be having a mild problem with the scaling on my catterplot. I’ll update this if I ever figure it out. But I figured amidst all of the math-y posts, this would be a good filler, and also a good lead in to doing more R related stuff instead of just Python.
0 notes
