#datframes
Explore tagged Tumblr posts
Visit Tumblr Blog
Explore Tumblr blogs with no restrictions, modern design and the best experience.
Last Seen Tumblr Blogs


Fun Fact
Tumblr Inc. is funded by 13 investors.
Text
Stock Market Sentiment Prediction with OpenAI and Python
In today’s stock market, staying informed about news and events is crucial for making strategic decisions. Recognizing the impact of sentiment on market trends is essential to adjust strategies accordingly. The process begins with accessing vast amounts of market news available through various sources. Foremost among these are the requirements for data quality (such as the number of sources, data update rate, etc.) and ease of use.
Although the data is available online and easily accessible, one of the most convenient methods for our needs is to use an API endpoint to integrate market data and news directly into our code. There is a variety of financial data providers that offer API connections; they vary in the data packages, support approach, and quality of data they provide.
In this article, we are going to use the Stock Market and Financial News API provided by one of the Market Data providers named EODHD, which, in my opinion, boasts a great balance of quality and price. The API provides an endpoint for extracting insights from financial news, facilitating easy analysis of market sentiment. With its ease of use, users can query and retrieve news articles, enabling a dynamic assessment of the market’s positive or negative tones.
By showcasing the capabilities of the API, I aim to demonstrate its seamless integration into sentiment analysis, enabling us to make informed decisions based on prevailing market sentiments. In the fast-paced environment of the stock market, having access to such a resource ensures a more adaptive and strategic approach to investing.
Without further ado, let’s dive into the article.
Importing Packages
Let’s start with importing the required packages into our Python environment. We’ll be using three packages in this article which are pandas for working with dataframes, eodhd for extracting data, and langchain for building the LLM model. Apart from these, we will also be using other secondary packages like config and re. Import all the necessary packages using the following code:!pip install openai !pip install langchain !pip install eodhd !pip install config
import re import requests import pandas as pd import config as cfg from eodhd import APIClient from langchain.chains import LLMChain from langchain.prompts import PromptTemplate from langchain.chat_models import ChatOpenAI
Before importing, make sure to install the packages using the command line. Now that we have all the required packages imported into our Python environment, we can proceed to the next step which is activating the API key.
API Key Activation
It is essential to register the EODHD API key with the package in order to use its functions. If you don’t have an EODHD API key, firstly, head over to their website, then, finish the registration process to create an EODHD account, and finally, navigate to the ‘Settings’ page where you can find your secret EODHD API key. It is important to ensure that this secret API key is not revealed to anyone. You can activate the API key by following this code:api_key = '<YOUR API KEY>' api = APIClient(api_key)
The code is pretty simple. In the first line, we are storing the secret EODHD API key into api_key, and then in the second line, we are using the APIClient class provided by the eodhd package to activate the API key and stored the response in the client variable.
Note that you need to replace <YOUR API KEY> with your secret EODHD API key. Apart from directly storing the API key with text, there are other ways for better security such as utilizing environmental variables, and so on.
Extracting the Data
We are going to use the Stock Market and Financial News API by accessing the Python library provided by EODHD as follows:resp = api.financial_news(s = "AAPL.US", from_date = '2024-01-01', to_date = '2024-01-30', limit = 100) df = pd.DataFrame(resp) # converting the json output into datframe df.tail()
Let me explain the parameters in the API:
s: String. REQUIRED if parameter ‘t’ is not set. The ticker code to get news for.
t: String. REQUIRED if parameter ‘s’ is not set. The tag to get news on a given topic. you can find the provided topic list on this page: https://eodhd.com/financial-apis/stock-market-financial-news-api/
api_token: String. REQUIRED. Your api_token to access the API. You will get it after registration.
from and to: the format is ‘YYYY-MM-DD’. If you need data from Mar 1, 2021, to Mar 10, 2021, you should use from=2021–03–01 and to=2021–03–10.
limit: Number. OPTIONAL. The number of results should be returned with the query. Default value: 50, minimum value: 1, maximum value: 1000.
offset: Number. OPTIONAL. The offset of the data. Default value: 0, minimum value: 0. For example, to get 100 symbols starting from 200 you should use limit=100 and offset=200.
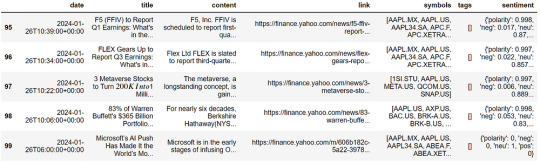
The output data has the following fields:
date: The date and time of the article are in ISO 8601 format.
title: The title of the article.
content: The full body of the article.
link: The link to the source.
symbols: The array of ticker symbols is mentioned in the article.
Cleaning the Data
Now this data is unclean and contains lots of line breaks and different commands. So we are going to clean them:#funtion to clean the textual data def clean_text(text): cleaned_text = re.sub(r'\s+', ' ', text) return cleaned_text.strip()
# Apply the replacement function to the entire column df['content'] = df['content'].apply(clean_text)
Now we have applied it to all the data and we can move forward with our chatbot.
LLM
Now we will use Langchain to form an LLM chain with the OpenAI model.llm = ChatOpenAI(model = "gpt-3.5-turbo", openai_api_key = 'YOUR OPENAI API KEY', temperature = 0)
NOTE: You should replace YOUR OPENAI API KEYwith your own OpenAI API key for the smooth functioning of the code without any errors.
This code snippet initializes the Language Model (LM) by instantiating GPT-2.5-turbo with a temperature of 0. The choice of temperature 0 ensures determinism in our model, preventing it from getting sidetracked and maintaining a focused and consistent generation.
Now, we are going to use different techniques to make it precise for our downstream task i.e. Sentiment analysis. There are lots of different ways to do it:
1) Prompt Engineering:
Prompt engineering is a growing field that involves designing and optimizing prompts to maximize the performance of large language models like GPT. As these models advance, the way we prompt them becomes increasingly important. Recent research shows that well-crafted prompts can significantly improve reliability and enable models to tackle more complex tasks than previously believed.
Following are some prompt engineering techniques that are commonly used:
Zero-shot prompting: This method enables large language models (LLMs) to handle new tasks even without prior examples or understanding of the task. It operates through a technique called ‘prompting,’ where you simply give the LLM a natural language description of the desired task.
Few-shot prompting: While large-language models demonstrate remarkable zero-shot capabilities, they still fall short on more complex tasks when using the zero-shot setting. Few-shot prompting can be used as a technique to enable in-context learning where we provide demonstrations in the prompt to steer the model to better performance. The demonstrations serve as conditioning for subsequent examples where we would like the model to generate a response.
Chain of Thought Prompting: Chain of thought prompting is a helpful technique for AI systems to simplify complex tasks by breaking them down into manageable steps. Instead of tackling a challenging problem in one go, this method promotes explaining the reasoning process by breaking the solution into a series of smaller, incremental steps. It begins by clearly defining the end goal and then considers the logical prerequisites and sub-tasks required to reach that goal.
2) Fine-tuning
Fine-tuning is a useful process that lets users tailor pre-trained language models (LLMs) for specific tasks. By fine-tuning a model on a small dataset containing task-specific data, you can enhance its performance for that particular task while keeping its overall language understanding intact.
The two main Fine-tuning Methods are as follows:
Full instruction fine-tuning: Full instruction fine-tuning is a technique used to adapt Large Language Models (LLMs) to specific tasks. The process involves adjusting all parameters of the LLM using task-specific data. This adaptation allows the model to perform more effectively on specific tasks, potentially leading to improved performance. The need for full instruction fine-tuning arises because even the most powerful pre-trained LLM might not always meet specific needs right out of the box. For instance, an application might require a unique structure or style, or the pre-trained LLM might lack knowledge about specific documents crucial to the application. Furthermore, certain domains, industries, and even particular enterprises often have unique terminologies, concepts, and structures not prominently represented in the general pretraining data. Therefore, full instruction fine-tuning is a valuable method for tailoring LLMs to more specific use cases.
Parameter-efficient fine-tuning: Parameter-efficient fine-tuning (PEFT) is a technique used to adapt large pre-trained models to various downstream applications without fine-tuning all of a model’s parameters. This is because fine-tuning all parameters can be prohibitively costly. Instead, PEFT methods only fine-tune a small number of (extra) model parameters. This significantly decreases computational and storage costs while yielding performance comparable to a fully fine-tuned model. PEFT addresses issues such as the infeasibility of full fine-tuning on consumer hardware and the high cost of storing and deploying fine-tuned models independently for each downstream task. It also overcomes the problem of catastrophic forgetting, a behavior observed during the full fine-tuning of Large Language Models (LLMs).
In this instance, we will leverage prompt engineering techniques, utilizing the Langchain template functionality, to construct an optimized prompt for conducting sentiment analysis in the stock market. The objective is to create a prompt that not only provides sentiment Analysis but also offers explanations for the model’s inferences.template = """ Identify the sentiment towards the Apple(AAPL) stocks from the news article , where the sentiment score should be from -10 to +10 where -10 being the most negative and +10 being the most positve , and 0 being neutral
Also give the proper explanation for your answers and how would it effect the prices of different stocks
Article : {statement} """
#forming prompt using Langchain PromptTemplate functionality prompt = PromptTemplate(template = template, input_variables = ["statement"]) llm_chain = LLMChain(prompt = prompt, llm = llm)
Now that we’ve established the LLM chain, let me give you an example of its inference.
Running the LLM chain :print(llm_chain.run(df['content'][13]))

Analysis
Now to to analyze the market condition of AAPL (Apple) stocks let’s analyze 100 articles and draw some conclusions.
So, first, we have to make sure we don’t cross the token limit of our model, which is 4097 for me. So we will filter out articles with a number of tokes < 3500:#A function to count the number of tokens def count_tokens(text): tokens = text.split() return len(tokens)
Counting tokes for all the rows in a dataframe:# Applying the tokenization function to the DataFrame column df['TokenCount'] = df['content'].apply(count_tokens)
Filtering the data frame according to TokenCount:# Define a token count threshold (for example, keep rows with more than 2 tokens) token_count_threshold = 3500
# Create a new DataFrame by filtering based on the token count new_df = df[df['TokenCount'] < token_count_threshold]
# Drop the 'TokenCount' column from the new DataFrame if you don't need it new_df = new_df.drop('TokenCount', axis = 1)
# Resetting the index new_df = new_df.reset_index(drop = True)
Now, this time I would change my prompt template so that I would get a concise output:template_2 = """ Identify the sentiment towards the Apple(AAPL) stocks of the news article from -10 to +10 where -10 being the most negative and +10 being the most positve , and 0 being neutral
GIVE ANSWER IN ONLY ONE WORD AND THAT SHOULD BE THE SCORE
Article : {statement} """
#forming prompt using Langchain PromptTemplate functionality prompt_2 = PromptTemplate(template = template_2, input_variables = ["statement"])
Let’s form the new LLM chain:llm_chain_2 = LLMChain(prompt = prompt_2, llm = llm)

Great, we are now able to get a concise output. Now, we are going to create a for-loop to iterate through the data and get the sentiment of each news:x = [] for i in range(0,new_df.shape[0]): x.append(llm_chain_2.run(new_df['content'][i]))
Visualization
Now let’s form some pie charts to see the market sentiment of AAPL stocks:import matplotlib.pyplot as plt
dt = pd.DataFrame(x) #Converting into Dataframe column_name = 0 # this is my column name you should change it according to your data value_counts = dt[column_name].value_counts()
# Plotting the pie chart plt.pie(value_counts, labels = value_counts.index, autopct = '%1.1f%%', startangle = 140) plt.title(f'Pie Chart') plt.axis('equal') # Equal aspect ratio ensures that the pie is drawn as a circle.

The pie chart indicates that a significant number of articles were neutral. However, to ensure accuracy, we should filter our data and focus on analyzing only the non-neutral information.
Removing neutral values:value_to_remove = '0' # Remove all rows where the specified value occurs in the column dt_new = dt[dt[0] != value_to_remove]
Visualizing the new data:value_counts = dt_new[column_name].value_counts()
# Plotting the pie chart plt.pie(value_counts, labels = value_counts.index, autopct = '%1.1f%%', startangle = 140) plt.title(f'Pie Chart') plt.axis('equal') # Equal aspect ratio ensures that the pie is drawn as a circle.

Observing the trends, the combination of +5 and +7 contributes to nearly 40% of the data. Factoring in additional values like +10, +8, and +3, the cumulative percentage of positive articles rises to 52.5%. This pattern indicates a prevailing optimistic sentiment, implying a favorable perception of Apple Inc. in recent articles. The positive outlook identified may have potential implications for shaping overall sentiments regarding Apple’s market performance.
Conclusion
In our study, we employed the Stock Market Financial News API provided by EODHD to collect stock market news articles and utilized OpenAI’s sentiment analysis model to assess the sentiments conveyed in these articles.
To ensure seamless compatibility between our data and the OpenAI model, LangChain, a language processing tool, was utilized. To refine the inputs for the OpenAI model and improve the accuracy of our sentiment analysis, we implemented prompt engineering techniques. We conducted sentiment analysis on 100 articles to gauge the current market sentiment surrounding APPL stocks.
This holistic methodology enabled us to extract meaningful insights into market trends based on the sentiments expressed in the news. With that being said, you’ve reached the end of the article. Hope you learned something new and useful today. Thank you very much for your time.
0 notes
Photo

Data Visualization is a graphical representation of information of data. It uses the visual elements like charts, graphs and maps. https://www.incegna.com/post/data-visualization Check our Info : www.incegna.com Reg Link for Programs : http://www.incegna.com/contact-us Follow us on Facebook : www.facebook.com/INCEGNA/? Follow us on Instagram : https://www.instagram.com/_incegna/ For Queries : [email protected] #datavisualization,#tableau,#datframes,#Infogram,#ChartBlocks,#histograms.#visualanalysis,#SAML,#metadata,#graphs,#maps,#advancedtableau,#worksheets https://www.instagram.com/p/B93R6LCABtN/?igshid=1sc4yjlmi9k6x
#datavisualization#tableau#datframes#infogram#chartblocks#histograms#visualanalysis#saml#metadata#graphs#maps#advancedtableau#worksheets
0 notes
Text
Big Data with Spark and Python
It’s becoming more common that most of the business face circumstances where the data amount is higher to handle on a single machine. There are Hadoop, Apache Spark, and other technologies developed to sort out the issue. The system can be quickly and directly tapped from Python by utilizing PySpark.
Apache Spark is one of the general and faster engines mainly designed for big data processing and holds built-in modules for graph processing, machine learning, SQL, and streaming. It’s also known for their user-friendliness, speed, ability to run virtually, and even for their generality.
Spark is also one of the preferred tools, especially for data scientists and data engineers. They can make use of the Spark when doing any feature extraction, model evaluation, supervised learning, and data analysis. In this blog, we will deal with some critical concepts about Python and Spark in big data technologies.

Spark: Scala or Python?
You need to know what type of Spark you need before continuing with Scala or Python. Here are some simple concepts explained so that you can choose the right one bases on your requirements.
1. Learning Spark: Scala or Python?
When it comes to the learning curve, Python stands as the premier choice as it’s user-friendly, less verbose, easy to use, and more readable when compared with Scala. It will be perfect for people who are not having much experience in the programming part. People who have little or higher programming experience can also work with Spark in Python with a good number of benefits associated with them.
2. Spark Performance: Python or Scala?
When it comes to concurrency and performance, Scala wins the debate, and this is agreed by most of the developers. They are rapid and user-friendly when compared to python.
When it comes to concurrency, the play framework and scala make the process easier to write perfect and clean asynchronous codes that are easy to reason about. Play framework is asynchronous, and therefore, there are high chances to have a different type of concurrent connections without the hindrances of threads.
It’s also simpler to make Input and output calls in parallel so that it can enable the use of streaming, server push, and real-time technologies. Apart from it, it also helps to enhance performance.
There will be no many variations between Scala and Python in the case of DataFrame API, but you need to be aware of them when working with UDFs (User Defined Functions), which is considered to be less effective when compared to the equivalents of Scala.
In case you are dealing with Python, you need to ensure not to pass your information between RDD and DatFrame unnecessarily as the deserialization, and serialization of the information transfer is expensive.
Serialization is the process of transforming an object or thing into a progression of bytes that can be lasted to a database or disk or else can be sent via streams when it comes to deserialization, it’s the vice versa of the serialization.
3. Advanced features and Spark: Scala or Python?
Many advanced features might provide a small confusion in choosing Scala or Python. When it comes to data science, you can prefer Python over Scala as it offers the user with different tools for natural language processing and machine learning like SparkMLib.
4. Type Safety and Spark: Python or Scala?
The advanced features and safety are two things that stand for both Scala and Python. When it comes to type safety, you can choose Python, and this is best when you are performing experiments in smaller ad hoc. If you are working for some more significant projects, then scala would be the right choice. The reason for this is that Scala is statically typed language, hassle-free, easier when you are refactoring.
As a whole, both languages possess the positives and drawbacks while working with Spark. You need to choose the best one based on your team capabilities and project requirements.
How to install Spark?
Installing Spark us something tedious, but you can do it if you follow the below steps in the right manner.
1. Make sure you have Java JDK installed.
2. Once you are aware that it has been installed, you can go to the download page of the spark. You need to choose the default options up to third steps, and at the fourth step, you will find a downloadable link to download it.
3. Make sure you find untar the directory in your Downloads folder.
4. Once you find the folder, move to /usr/local/spark
5. Now, open the README file from the option.
6. The next step is to build spark, and you can do this by running a command “$ build/mvn -DskipTests clean package run.”
7. The next steps are to type “./bin/pyspark” in the same folder to start working in the Spark Shell.
8. You can now start to work.
Spark APIs: DataFrame, Dataset, and RDD.
There are three distinctive APIs that would make great confusion to anyone who is just getting started with the Spark. Let’s check out about the Spark APIs in depth below.
1. RDD:
RDD, derived as the “building blocks” of the spark, is the original API that is exposed by the Spark, and it’s considered to be the higher-level APIs when compared to other ones. RDD is a set of Scala or Java objects that represent data, and this is pointed out from the perspective of a developer.
RDD has three primary specifications; namely, they are based on the Scala collections API, they are lazy, and they are compile-time type-safe. There are many advantages of RDD, but they also lack in some cases. For instance, it’s simple to develop transformation chains, but they are relatively and inefficiently slow when taking non-JVM languages like Python. Spark can not optimize them.
2. DataFrames:
To overcome the disadvantages of RDD, The API DataFrame was incorporated. It offers you the right level of abstraction, which enables you to make use of the query language to operate the data. This level of abstraction is considered to be the logic plan which indicates schema and data. It also shows that interacting with your data at the frontend is too easy. To execute this, the logical idea will be transformed into a physical plan.
DataFrames are developed on top of RDDs. The improvement and performance of DataFrame are due to a few things that you come across often when you are dealing with data frames, namely optimized execution plans and custom memory management.
3. Datasets:
DataFrame deals with one crucial drawback, namely it has lost the safety of the compile-time type, which means it will make the code more inclined to hindrances and errors. To overcome the drawback dataset was raised and this deals with getting back the type-safety and also make use of the lambda functions which indicates that you capture some benefits of RDDs and also you are not losing the optimization offered by the data frames.
Which the proper time to use the APIs?
Choose RDD when you need to perform low-level actions and transformations on any unstructured data. It indicates that you are not caring about establishing a schema while accessing or processing the attributed by column or name.
Apart from that, you need not require the performance and optimization advantages that DataSets and DataFrame provide for semi-structured data. You can also make use of the RDD when you need to handle the data with various constructs of functional programming when compared to particular domain expressions.
You can make use of the DataFrames in case you are working with PySpark as they are close to the structure of DataFrames. DataSets are not the perfect one in case of Python as it lacks compile type and time safety of the Python. The dataset API is ideal for when you need to use SQL queries, the use of lambda function on a data that is semi-structured, high-level expressions, columnar access, and more.
So what are your views on Big Data with Python and Spark? Are you interested to learn more about Spark and Python in Big Data? Let us know through the comment section below.
0 notes