#especially when it comes to statistics and data analysis........... so many ways to interpret results. there's not a right way!!
Explore tagged Tumblr posts
Visit Tumblr Blog
Explore Tumblr blogs with no restrictions, modern design and the best experience.
Last Seen Tumblr Blogs


Fun Fact
In 2020, 44% of users from Denmark used Tumblr daily.
Text
i often struggle with thinking that there's a correct answer to everything. on a physical level we have a "reality" (debatable) but anyhow beyond that all measurements and perceptions are subject to warping in some or another way and we'll never ever know what's real and what's true and Why things happen. man.
#im post#especially when it comes to statistics and data analysis........... so many ways to interpret results. there's not a right way!!#what trials of this EEG study do you keep in?? subjective decision!! hate it.
3 notes
·
View notes
Text
A primer for researchers: Exploring Research Methodologies

Academic inquiry is built into research methodologies. They create, interpret, and analyze how the actual data collection, analysis, and interpretation are done. Through an understanding of other methodologies, researchers can adopt the best approaches for research work to ensure robust results. This blog explores basic research methodologies, their benefits and drawbacks, and effective ways to implement them.
What Are Research Methodologies?
Research methodologies are the methods, procedures, and practices of gathering and analyzing data. They determine how the researchers should carry out their researches, from the conceptual design of the study to the interpretation of results. In general, methodologies can be divided into three types: qualitative, quantitative, and mixed methods.
Qualitative Research Methodologies Qualitative research methods depend on the understanding of meanings, experiences, and views of participants. They are used extensively where the situation is too complicated and data in numerical form cannot explain anything.
Characteristics
Exploratory Nature: This is typically used when there is a minimal known information regarding a particular issue. This method formulates hypotheses and builds theories instead of testing them. Subjectivity: The researcher often empathizes with the participant fully, but this brings about a lot of subjectivity; however, it enables more comprehensive data. Data Collection Techniques: Interviews, focus groups, ethnography, and content analysis are the most widely used methods. Benefits Deep Understanding: Qualitative method allows a very deep understanding of experiences lived by participants in great detail and nuances. Flexibility: The questions and methods may change according to the unfolding study; it leaves scope for findings that might have gone unnoticed initially. Understanding the Context: This method stresses the context of life participants live, and so social and cultural influences come forth in their study. Drawbacks
Limited Generalizability: Due to the small number of samples, the findings from qualitative research cannot easily be generalized to larger populations. Time-Consuming: The collection and analysis of data may be laborious and time-consuming. Subjectivity: Bias by the researcher may be present, which will determine the interpretation of data and will require careful reflexivity.
Quantitative Research Methodologies Quantitative research methodologies are those that seek to quantify the relationships, behaviors, and phenomena. They aim to find patterns, test hypotheses, and make predictions using numerical data.
Characteristics
Structured Approach: A quantitative study usually follows a set structure often in the form of a survey or experiment whose variables are known in advance. Statistical Calculation: It employs statistical technique in the analysis of data so that the researcher can deduce and make inferences about the populations. Objectivity Measurement: It stresses objectivity, where the researchers will try to minimize their impacts during the data collection. Benefits A larger sample size and random sampling approaches enhance the possibility of extending the results to larger populations. Reproducibility: The outcomes from any given quantitative investigation are simply and easily repeatable. Such therefore, goes in great heights to making them highly dependable. Confidentiality power: Due to advanced ways applied, results come out quite detailed especially some relations could be unseen if a survey would only rely on the qualitative survey method. Weaknesses Skeletal : For rich humna experiences this fails at coming up as its more 'to present ' facts of truth for any qualitative studies. Then makes good quality data fall back into digits Inflexible : One does not try out one's surprises during research. These include assumptions of normality for many statistical analyses where data is assumed to be normally distributed, which is not always the case in actual situations.
Mixed Methods Research Methodologies Mixed methods research combines qualitative and quantitative approaches. This methodology takes advantage of the benefits that both methodologies offer, allowing for a comprehensive understanding of any research questions posed.
Characteristics
Integration of Data:Qualitative and quantitative data are both collected and analyzed and then synthesize findings to draw more holistic conclusions. Flexibility in Design: The mixed methods may be designed in various forms, and it can also be explanatory - quantitative followed by qualitative. It can also be exploratory - qualitative followed by quantitative. Complementarity: Each type of data informs and enhances the other to bring a better understanding of the research problem. Benefits
Comprehensive Insights: Using both methodologies, one can answer complex questions which require multiple perspectives. Validation of Findings: Qualitative data may help explain the quantitative results and therefore enhance the validity of the research. Flexibility: Researchers can change their methodologies as their research questions evolve. Disadvantages
Complexity: It takes more time and effort to develop and conduct mixed methods research compared to using a single methodology. Resource Intensive: The expertise needed in both qualitative and quantitative methods is more resource-intensive and demands training. Integration Challenges: The analytical challenges that accompany data integration from various methodologies are enormous.
Selecting the Right Methodology
Choosing an appropriate methodology for research depends on many factors. These factors include the nature of data, research questions, and objectives. There are a few key considerations:
Define Your Research Question Your research question should determine your choice of methodology. If the question is about feelings, perceptions, or experiences, a qualitative approach may be appropriate. If the goal is to test a hypothesis or observe relationships between variables, the most appropriate choice could be quantitative.
Consider the Nature of the Data Think about the type of data you are going to need to address your research question. When you require numerical data for the purpose of statistical analysis, a quantitative approach is relevant. When you require deep meanings and context, qualitative approaches will be more useful.
Assess Resource and Time Constraints Consider the resources: time, funding, expertise available. Qualitative research often requires much data collection and analysis time, while quantitative studies need statistical software and a larger sample size.
Consider Ethical Issues Ethics are part and parcel of the research design. Each methodology should be weighed for its adherence to ethical requirements, most notably those related to informed consent, confidentiality, and risks towards respondents.
Best Practices on Implementing Research Methodologies
Clear research design A well defined research design acts as a roadmap for carrying out the research. Your objectives, methodology, data collection methods, and analysis will all guide you throughout the process.
Pilot Test Before full implementation of the methodology, pilot test your research. Carry out pilot testing; in doing so, you'll test methods applied to the collection of data while proceeding to identify potential issues that require adjustments.
Rigor and Validity For qualitative study, establish credibility through member checking, peer debriefing, and triangulation. For quantitative study, establish the internal and external validity through proper sampling methods and statistical techniques.
Maintain Ethical Standards Maintain ethical standards in your study. Obtain informed consent, ensure confidentiality, and keep study participant fully informed of your research purpose and effects. Note your method during the entire process of research, and be flexible with changes in the approach if any adjustments are required. Flexibility in a method can enhance the quality of the research and might bring out some surprise findings.
Conclusion
Research methodologies help organize the academic inquiry, providing the way for gathering and processing data. For a researcher who is using either qualitative or quantitative methods, mixed approaches or otherwise, choosing a right methodology requires an intensive consideration of purpose, question, and resource.
This understanding gives researchers informed decisions aimed at strengthening the rigor and credibility of studies. In doing so, effective methodologies in research not only impact individual scholarship but the greater good of advancements in knowledge across disciplines.
Therefore, methodology is more than mere technical detail-it forms the very process and outcome of your research. Welcome the complexity of your research question, and let your chosen methodology guide you toward meaningful insight and possible contribution to your field.
For further assistance, reach out to https://marketingteam-jsr4470.slack.com/files/U07BC2Z23PE/F07UPMNG751/blog_backlinking_task_for_writebing__1_.pdf
0 notes
Note
Thoughts on dreams response?
so i read the 19 page paper and then watched dream’s response video. don’t really know what the discourse surrounding his response is bc ✨i don’t care enough to go purposefully looking for it ✨
my overall thoughts on the Entire Situation under the cut because i talk A Lot:
first and foremost, the math in the paper is Incredibly Thorough. dream gave the Abridged Version in his video bc i doubt most people read the entire thing. but if you read the paper, you’ll see the author point out what calculations the mods did wrong and, more importantly, why they were wrong and how they fixed it. you’ll also notice that they mentioned several times that the results the author calculated did match some of that of the mods’ calculations. we love reproducibility.
questioning the credibility of the author is a waste of time and energy. they’re Anonymous for a reason. imagine getting a fucking doctorate in statistics (an additional 4-8 years of study after college in the US) and your biggest paycheck of the year comes from some dude in florida who plays minecraft for a living. jokes aside, you can argue in circles about “oh dream bribed the expert” but the intentions of the author and purpose of the paper are clearly stated in the first couple pages. before all the math stuff. people were so quick to believe the stuff in the paper the volunteer mods put out. why not believe the expert too?
there is a greater lesson here to be learned about bias. both for and against dream. it was Incredibly Concerning to see So Many People immediately jump to “dream cheated 100%” or “dream would never cheat he’s the best” before understanding all of the facts. i’ll admit, even i fell into this trap before i took a step back from the situation to look at the big picture. we all have biases, many of which we aren’t even aware of. but it’s always important to recognize those biases and account for them as much as possible before drawing conclusions, especially those that have real world implications. it’s also important to listen to Experts and those who Know More Than You. sometimes you just have to shut up and listen. you’re not going to know everything and that is Fine as long as you are open to Learning from those with credibility and knowledge. you’re going to make mistakes and have opinions you’ll later look back on and *cringe* and all of that is fine because we are all Growing and Learning.
aight let’s talk about the mods. i’ve already like vented in the tags of a post from like 2 week ago and my point still stands. statistics is Very Difficult to Do and unfortunately is an Incredibly Powerful Tool. there is No Right Way to do stats. the data is unbiased but the analysis and interpretation of that data can be. once again, that’s why it’s important to account for your biases. the mods tried. i’ll give them credit, i really do believe they Tried. but unfortunately trying sometimes just isn’t Good Enough. statistics can be weaponized to push forward an agenda, whether or not the author intended it. i know that this is “just minecraft” and it only affects “one person” but inaccurate publications or misrepresentations of data have Real Life Consequences. one Disproven and publicly denounced paper had people Believing that vaccines cause autism, contributing to the antivax movement that is Once Again having an impact during coronatime. the point is, the mods should’ve consulted a professional. someone with credentials about their math. there is no doubt in my mind that they knew the fallout that was to come. the drama this would stir up. there was Obvious, Documented bias against dream from the beginning. i’m sure there were people who wanted to take him down at least a peg or two. but once again, that’s no excuse to publish this without consulting a Credible Expert. i’m going in circles now you get the point, academic integrity is Very Important. also News Outlets have reported on this, overall shedding a pretty negative light on the minecraft speedrunning community as a whole, which also harms the mods too in my opinion.
finally, let’s talk about dream. if you don’t like him, that’s fine. it’s Okay to Not Like Someone. to Stop Watching their content. to Stop Supporting Them. dream responded incredibly immaturely to this entire situation, as we have seen him do Multiple Times before. personally, i don’t believe the excuse “i acted without thinking and i’m sorry” cuts it anymore, given his 14M subscriber count and 1M+ twitter followers. he is a grown adult and should learn to conduct himself better publicly. i have friends his age and this behavior in a professional setting, which for him twitter is because social media/ content creator is quite literally his job, would be Completely Unacceptable. it’s perfectly valid to be angry and yell about it to his friends, hell i’d be Furious. but he should know better than to tweet impulsively. feel free to draw your own conclusions on him as a CC and public figure. please do. i know “cancel culture” has deviated from it’s Original Meaning (much like the term “stan” has too) but hold content creators accountable for their actions. do not blindly defend him. at the same time, acknowledge that he is a young adult who is still growing and learning. these two ideas can and should coexist. however, ***do not accept apologies that are not yours to accept***. shut up and listen to others who know more than you about a particular thing. think for yourselves. draw your own conclusions but always be willing to Grow if/when you Learn New Information.
the world is Complicated. i’m sorry. i wish it were easier too.
in conclusion, i can’t believe *this* is the first time i’ve used statistics knowledge outside of an academic setting and in the Real World. 2020 is fucking wack. if you’ve made it this far, thank you for coming to my incoherent ted talk. no one is going to read this whole thing and i’ve accepted that.
#anon#so apparently i had a lot to say#in classic Beacon Lamp Fashion it's rambly and kinda coherent but also probably repetitive bc im not good at writing#also no one is going to read this and thats ok#discourse#discourse tw#Anonymous#also didn't proofread it before publishing so
59 notes
·
View notes
Text
Career In Bioinformatics: Is It Worth?
What is Bioinformatics?
Bioinformatics is an interdisciplinary field concerned with developing and applying methods from computer science to biological problems. For example, the Human Genome Project, which was completed in 2001, wouldn't have been possible without the contribution of intricate bioinformatic algorithms, which were critical for the assembly of millions of short sequences that are molecular.
Bioinformaticians need a background that is solid computer science but also a good understanding of biology. Since bioinformaticians work closely with biologists, they need to communicate complex topics in a way that is understandable to keep up-to-date with new developments in biology.
Studying Bioinformatics
I took part in a preparatory maths course at university before studying Bioinformatics at Saarland University. It turned out to be a smart decision to take that course for university because I realized that my high-school education was not as comprehensive as necessary to prepare me. For example, only in the preparatory time learned about proofs by induction or set theory.
I understood why the university offered preparatory maths courses: the maths lectures were brutal when I started my studies. There would usually be two lectures, each spanning two hours a week. The approach was the following in terms of teaching. The lecturer would scribble definitions and proofs onto the blackboard, and the students would try to keep up with the dizzying pace. Due to the short lecture speed, I always felt that attending the courses didn't help me learn the material.
In my Bachelor's bioinformatics curriculum, roughly 70% of the program's credit points had to be earned in computer science (e.g. programming, algorithms and data structures, concurrency) and maths courses (e.g. Analysis, algebra, stochastics). In contrast, the remainder of the credits could be obtained from the full life sciences. I felt that the first three terms at university were the hardest because each semester featured a maths and a computer science course that is basic. The semesters that are later a more significant share of Bioinformatics courses as well as more hands-on seminars.
Comparing life-science and computer-science courses, I found the life-science procedures much more straightforward and less effort. While life-science lectures just required attending the classes and passing the exam, computer-science methods involved much more work. There are weekly tutorials where the solutions to the assignments are weekly discussed. Additionally, some classes featured short (15 minutes) tests. In these classes, it was usually necessary to reach 50% of the maximum score in the assignments and tests to take the exam (either only a single exam or a mid-term and end-term exam).
What differentiates the Master's through the Bachelor's system is that it is more research-oriented and allows for much greater specialization. Including, I used my Master's to consider machine methods that can be learning as supervised learning or reinforcement learning. The Master's thesis uses up a much more significant element of the total credit points than the Bachelor's thesis. Therefore abilities such as, for instance, literary works analysis, method development, and scientific writing become even more critical in terms of research.
Job Leads as being a Bioinformatics Graduate
Learning bioinformatics, I happened to be often expected where you could act as a bioinformatician. About 80% of bioinformatics place have been in research or the public sector. The issue with research jobs is that they're usually fixed-term (age. g. two years) because these positions in many cases are financed task that is using. Into the public sector, bioinformaticians are often desired in the medical industry (e.g. in hospitals) plus in health-related federal government institutions. The benefit of roles in the public sector is the fact that they've been usually permanent. Nonetheless, employment in an organization that is the general public as being a hospital often involves method administration duties such as, for instance, starting computers and databases - tasks that have little to accomplish with bioinformatics itself. Furthermore, both research and public-sector positions provide fair salaries being low to industry.
In my estimation, no more than 20% of bioinformatics jobs come in the industry. How come the percentage therefore low? The main reason is the only industry sector that employs bioinformaticians is big pharma, within my view. Right here, bioinformaticians are expected to perform tasks such instance:
• Modeling: Estimation of protein structures and simulation of molecular interactions
• Data processing: processing and evaluating sequencing information, for example, from next-generation sequencing or sequencing that is single-cell
• Virtual screening: breakthrough of leads (prospective brand new medications) using computational practices
• Data technology: Analysis and interpretation of data
Since bioinformatics is very research-oriented and industry jobs are few, many graduates (maybe 40%) join PhD programs. The people industry joining work in non-bioinformatics roles is an example, since it consultants, software designers, solutions architects, or information scientists.
Some individuals advise against studying bioinformatics because it is difficult to find an operating task afterwards. I didn't have that experience at all, and I received a job that is numerous from recruiters. I might argue that having a bioinformatics degree, job prospects are acceptable due to the fact bioinformaticians have a particular skill, helping to make them appealing for organizations:
• Bioinformatics graduates exhibit the traits of T-shaped experts. This permits them to execute many different tasks and to behave as facilitators in interdisciplinary teams.
• Bioinformatics graduates often have more experience that is useful software than computer-science graduates.
• Bioinformatics graduates are keen learners. Their proficiency in numerous disciplines shows that they can effortlessly conform to situations being brand new.
Advice to Prospective Bioinformatics Pupils and Graduates
Whether I would study bioinformatics again, I might be torn backwards and forwards if you asked me. Regarding the one hand, I must say I liked the variety of the bioinformatics system, and, with a degree in bioinformatics, many jobs are possible. The economic truth is there are few bioinformatics roles, so when you take a non-bioinformatics work, all your specialized knowledge decreases the drain having said that. Hence, I could also imagine studying a less subject specialized as computer or data science.
If you are thinking about studying bioinformatics, here are a few bits of advice:
• Do not study Bioinformatics if you hate maths. Especially the semesters that are first maths-intensive.
• Do no study Bioinformatics that it is very similar to studying biology if you were to think. Keep in mind that bioinformatics is more associated with computer technology than biology. You will find excessively biologists, which can be a few results in the change to bioinformatics.
• if you aim to operate as a bioinformatician in industry, plan. Remember to take courses that are industry-relevant forge industry connections, for example, through internships.
• Be flexible in your career ambitions. After graduating, you could not act as a bioinformatician. Nonetheless, you won't have problems locating a place when you have good programming and information analysis abilities.
Bioinformatics Versus Data Science
• possibly the most useful definition of "bioinformatics" is processing and analyzing large-scale genomics and other biological datasets to develop biological insights. As a result, other terms are often used, such as "computational genomics" and data that are "genomic."
• Data science is a little broader, mostly a more general term whose meaning is similar to bioinformatics minus the focus of biological processing and evaluating large-scale datasets to produce insights.
• in an article in Towards Data Science by Altuna Akalin, who cites audacity.
An information scientist's primary abilities include programming, machine learning, data, data wrangling, data visualization and communication, and data intuition, which probably means troubleshooting data concerns that are analysis-related.
• What comes up in bioinformatics is domain-specific information processing and quality checking, fundamental information transformation and filtering, statistics and device learning, domain-specific analytical tools and information visualization and integration, capacity to write code (programming), the power to communicate insights which can be data-driven.
• the difference that is key in Akalin's definitions is "certain domain data." The domain is genomic, proteomic, hereditary, and healthcare-related information in life sciences. It does not necessarily add sales and data, which are economical. Another method of putting it's that a bioinformatics professional is probable an information scientist; however, a data scientist is not necessarily a bioinformatician.
Bioinformatics Facts & Figures
• Persistence Market Research recently published a report, "Global Market Study on Bioinformatics – Asia to Witness Fastest Growth by 2020," which valued the worldwide bioinformatics market at $4.110 billion in 2014 but likely to grow at an annual mixture growth (CAGR) of 20.4 % from 2014 to 2020, hitting 12.542 billion in 2020.
• The Future of Jobs Survey 2018 by the World Economic Forum estimates that 85 per cent of surveyed businesses tend or very likely to consider data analytics being big. It also indicated that the revolution that is "industrial create 133 million brand new job functions and that 75 million jobs are disappearing by 2020."
• And yes, you guessed it, many of the jobs which are now in the regions of information technology and bioinformatics. In reality, the #1 top ten job champion ended up being "data analysts and scientists" followed closely by "artificial intelligence and machine learning specialists." The number 4 spot was data that are "big," followed by "digital transformation experts" (#5), "software and applications developers and analysts" (#9) and "information technology services." (#10).
• together with job outlook for bioinformatics for 2018 to 2026? The Bioinformatics Home weblog writes, "The easy reply to this real question is that the overall outlook is excellent, the demand outweighs the supply. However, the devil is within the details as usual. Nevertheless, it's good to become a bioinformatics scientist."
Job Titles and Search Terms
• Although "bioinformatician" could be a certain job, and there are various keywords that are frequently related, including bioinformatics.
Bioengineering, computational science, pc software engineering, device learning, math, data, molecular biology, biochemistry, computer technology, biostatistics, biomedical engineering, engineering, biology, information systems, genomics, computational biology, information science, and epidemiology.
• a search that is single BioSpace developed over 100 jobs mainly using "bioinformatics." The idea being: biostatisticians in the space that is biopharma to have a good comprehension of both data science and particular aspects of the life span sciences.
• Akalin had written, you're kept with most of the information science skillset plus some more "If you eliminate the particular domain needs from the bioinformatics set of skills. Individuals who result in the switch from bioinformatics to information technology will most need that is likely to adjust to the company's information organization and circulation environment. The issues are from a different domain, so they will have to adjust to that also. But the same would be true, at the least to some degree, for the data researchers jobs that are switching various employers."
• Akalin also points out that much of the difference is regarding mindset, particularly in academia to industry. Several information researchers who switched to bioinformatics or vice versa said that the sector is more product-oriented and customer and that the models needed on the market require more maintenance. "Besides," Akalin writes, discussing Markus Schuler, "he shares the idea itself is as important in product-oriented thinking that you don't constantly select the coolest and the most useful models; other factors like operating time, execution demands, scalability and architecture fit and also interpretability for the model. However, in terms of skills, he adds that bioinformatics and data technology is very comparable if not identical."
Job Growth and Median Wages
• The Bureau of Labor Statistics doesn't execute a task that is great of down specializations like data science and bioinformatics, tending to lump everything under Mathematicians and Statisticians. The BLS claims the task outlook from 2016 to 2026 is 33 per cent, much faster than average, and that the median pay in 2017 ended up being $84,760 with a Master's Degree for that category. Statisticians were cited among the fastest-growing occupations, at 34 per cent, and epidemiologists have an improvement rate of 9 per cent and pay that is median of Master's Degree prospect of $69,660.
• In 2018, O*NET OnLine, sponsored by the U.S. Department of Labor, projected task development for bioinformatics researchers within the U.S. to be 5 to 9 % and as high as 12 % in California. They launched that from 2016 to 2026, there is 3,700 new job, and that total employment in 2016 had been 39,000 staffers. Based on the study, the same median wages in 2017 were $76,690 yearly for bioinformatics boffins and $47,700 for specialists.
While the Bioinformatics Home blog correctly notes, "In any case, median salaries give just a proven fact that is vague of because the wages differ enormously between quantities of employment."
Do you want more informational blogs Click here
1 note
·
View note
Text
Minitab boxplot

Probability Plot: This command is used to help you determine whether a particular distribution fits your data or to compare different sample distributions.Stem-and-Leaf: This command is used to examine the shape and spread of sample data.Dotplots are especially useful for comparing distributions. Dotplot: This command is used to assess and compare distributions by plotting the values along a number line.Histograms divide sample values into many intervals called bins Histogram: This command is used to examine the shape and spread of sample data.Marginal Plot: This command is used to assess the relationship between two variables and examine their distributions.Matrix Plot: This command assess the relationships between many pairs of variables at once by creating an array of scatterplots.Scatterplot: This command is used to illustrate the relationship between two variables by plotting one against the other.Let’s discuss about the commands and functions of the Graph Menu in Minitab Menu bar. Anyone looking forward towards learning in Minitab needs to have in depth knowledge on each concept. There are various commands and functions coming within Graph Menu that plays an important role in statistical applications and calculation. If you have small sample sizes (say less than 25 data points in any one group) it is safer to use an Individual Value plot.The Graph Menu in Minitab Menu Bar involves creating the common Graphs required for analysis and representation of data.Care should be taken to check how much data is contained within each group, before any observations are made, particularly with Box plots.Box plots and Individual Value plots can be used to compare groups of data, and to make general observations.This example demonstrates that Individual Value plots are particularly useful when dealing with small sample sizes. just one (much heavier) parcel has caused the large range in the Overnight sample.the sample of Overnight parcels was quite small (only 10 data points).Similar observations can be made from the Individual Value plot of the same data, but the Individual Value plot provides additional insight, because it clearly shows that: It appears that parcels sent using the Overnight service have a larger range of weights than for other services.It appears that parcels sent using the Normal service are generally heavier than those sent using the Express service.How do you interpret Box plots and Individual Value plots?īox plots and Individual Value plots make it easy to compare groups of data and to draw general observations.įor example, from the box plot shown, you could reasonably make the following observations: So, the same data looks like this (right) when shown as an Individual Value plot. Individual Value plots work in a similar way, but instead of summarising the results into boxes and whiskers, the weight of each parcel is represented as a dot on the graph. The box areas represent the middle 50% of the data in each group, the middle (horizontal) lines represent the median value and the vertical lines (whiskers) represent the total range of the group. The results have been divided into three groups that contain three different service levels (express, normal or overnight service). Box plots and Individual Value plots are graphs that are useful for comparing groups of data.įor example, the box plot on the right shows the results of parcel weights (in kilos) recorded at a courier company.
0 notes
Text
Launch Monitor Guide
If you're a keen follower of the golf equipment international then you'll have observed the multiplied use of records whilst speakme about the performance of golf clubs.
Be it ball velocity, launch perspective or spin charge, all new equipment releases come with overall performance claims primarily based on numbers a long way past surely distance.
Similarly, visit the range on a practice day of a huge golfing tournament and you'll see several small boxes covered up either behind or parallel to the professionals as they hit balls followed by using gamers finding out the facts on an array of portable gadgets.
When we spoke to Rory McIlroy about his golfing golf equipment and his swing he was quick to extol the virtues of real time facts as an invaluable device inside the current gamers' arsenal.
So where does this statistics come from and what are the bins line up on the variety? It comes from a vareity of devices collectively referred to as Launch Monitors.

What Are Launch Monitors?
In easy phrases golf launch Monitors are digital devices that measure diverse aspects of what occurs whilst a golf ball is struck with the aid of a golf cLub.
How Do They Work?
Broadly speaking there are forms of launch monitor. One’s that track the ball after effect the use of Doppler Radar era and one’s that use Camera generation to record the information at impact. The systems then use the records they report and their personal algorithms to offer a variety of statistics measurements and projections approximately the golfing shot that has simply been hit.
Doppler Radar Launch Monitor Guide
Radar primarily based launch monitors use a scientific precept known as the Doppler Effect. The display generates microwave signal this is then radiates out of the device. This signal is interfered with by a moving item, in this situation the golfing ball, that causes a few energy to be pondered and a sensor in the unit detects the meditated signal. This is the equal generation used widely in the defence enterprise for uses such as missile monitoring.
Radar primarily based systems tune the flight of the ball and the usage of assumptions mission details of the clubhead movements through the software.

Photometric Camera Launch Monitor Guide
Led by using the GC2 Smart Camera System from Foresight Sports, those launch monitors use a chain of superior excessive definition cameras to seize club and ball data at impact and then assignment the flight and distance overall performance via the software.
The GC2 additionally gives Head Measurement Technology to run alongside their launch screen to provide analysis of the membership head. Stickes carried out to the membership head are detected by the cameras and provide information including in which at the club face the ball turned into struck.
What Data Do They Provide?
All of the primary release display organizations deliver a big and varied aggregate of Ball Data and Club Data. In the primary, radar based structures degree ball flight information and venture club facts, while digicam based totally systems measure club records and task ball flight statistics.
Ball Data
Ball Speed
Launch Angle
Launch Direction
Spin Axis
Spin Rate
Smash Factor: performance of the transfer of energy from the club to the ball
Height
Carry
Side
Total
Side Total
Landing Angle
Hang Time
Club Data
Club Speed
Attack Angle
Club Path
Swing Plane
Swing Direction
Dynamic Loft
Spin Loft
Face Angle
Face-To-Path
How Accurate Are Launch Monitors?
Modern release launch monitor units paintings to a excessive degree of accuracy however there are margins for blunders. Trackman for example say that they measure the full trajectory of each shot from a 6 foot chip to a 400 backyard pressure and is correct to 1 foot over a hundred yards.

How Can Launch Monitors Help Your Game?
All this data may additionally appear beneficial to membership manufacturers or top tour pro's, but can time spent with a launch monitor assist your sport?We think it can, especially inside the benefits it can supply when you are custom match for golfing clubs. The statistics from launch video display units has allowed specialized custom fitters extra scope to ensure your golf equipment correctly in shape your recreation.
By giving precise get right of entry to to parameters along with ball speed and release attitude fitters are actually able to alter elements inclusive of the shaft to make certain a players golf equipment match the characteristics in their swings.From a gambling angle a lesson with a expert who has access to this records and the ability to interpret it'll will let you apprehend you sport at a deeper degree and let you understand your ball flight and what you can do to control and improve it.The software program that runs the launch display records is likewise incredibly visible and can be run beside video to give you a precise picture of what's happening when you hit the golfing ball which may be useful when making swing adjustments. You will also be capable of see the data change as your swing improves giving fantastic remarks that you are on the right song.
All of the Launch Monitors stated are extremely portable and can be used each inner and out to make your exercise periods greater efficient. The software program supplied through the foremost producers additionally hyperlinks in to simulation software program to will let you 'play' many guides round the sector and get greater enjoyment when you practice.One factor to word is that radar based systems are much less correct in an indoor surroundings, as they're only able to tune the small percent of a ball's flight and consequently must make greater assumptions in their results.
Wearable Swing Analysers
Top of the range launch video display units provide access to a wealth of facts but also include top give up price tags. Fortunately there are some options on the market which might be extra low-priced for regular golfers and can give you some of the equal information.Devices such as the SkyCaddie SkyPro Swing Analyser use movement and acceleration detectors to record your swing and give you some of the statistics that you would obtain from a launch screen, which include membership head pace, swing path and face attitude.
0 notes
Photo

Inhuman of The Day
November 10th - Ulysses
Ulysses Cain and young latent Inhuman whose powers were triggered into bloom by way of exposure to the Terrigen Cloud. Ulysses had grown up in Ohio and was a student at Ohio State University when he was expose to the cloud. Terrigenesis did not alter Ulysses’ physical appearance and endowed him with the ability for a specialized type of prognostication that has come to be known as ‘Diagnostic Precognition.’ Ulysses’ mind appears to take in massive amounts of ambient information. All of this data is then processed by way of statistical analysis into a variable of probability. The whole process occurs on an unconscious level and, when the analysis ascertains a significant threat, Ulysses experiences the potential future event as a visceral vision, an experience that is seen and felt. When such a future event is especially dire, the visions that Ulysses experiences are telepathically shared by anyone in his immediate vicinity so that they see and feel the same vision of the potential future.
It was impossible for Ulysses to control these visions. He was sure he was losing his mind. He was sought out by Queen Medusa and the Inhumans of New Attilan who offered to help Ulysses learn to master his newfound abilities. Ulysses accepted this offer and Medusa brought him to Karnak at the Tower of Wisdom. Karnak trained Ulysses. At first this training was quite harsh and Karnak’s grim philosophy was off-putting to Ulysses. Yet there was a method to what felt like madness… Ulysses’ visions of the future are not pure predictions but rather a complicated algorithm of analysis. Like any statistical analysis, the interpretation of the results can be confounded by personal bias and attitudes. Karnak indoctrination of Ulysses into his nihilistic outlook, his notion that all lives are equally meaningless in the end, was meant to disabuse Ulysses of bias and prejudice so that his visions might be more accurate and unencumbered by bias.

To what extent Karnak’s training has been effective is this regard remains to be seen. The meditational exercises that Karnak has taught Ulysses has allowed him to feel more in-control of his visions. With concentration, Ulysses has learned to essentially ‘pause’ his visions so to more greatly explore them, pick out specific details, and hence improve their accuracy. Shortly after this training Ulysses experienced a particularly intense vision of a potential future where the earth was ravaged by a celestial-like monster. Medusa presented Ulysses’ findings to Captain Marvel (Carol Danvers) who them mobilized the Avengers and other heroes to intercept this monster when it appeared. Having the advanced warning proved pivotal and, with he advantage of time to prepare, the heroes were able to repel the monster quickly and effectively as soon as it arrived.
Although pleased by their victory, many of the heroes remained a good deal suspicious over how this new Inhuman had been able to warn them of the oncoming threat. Iron Man (Tony Stark) was especially intrigued by the nature of Ulysses’ powers. Stark asked Jean Grey of the X-Men to read Ulysses’ mind so to assure the young man’s good intentions. Ulysses agreed to this yet it turned out that his mind was impenetrable to telepathy. Captain Marvel was convinced that Ulysses’ abilities could be utilized, while Iron Man remained suspicious.
Some time later, Ulysses experienced a new vision in which the intergalactic despot, Thanos, came to earth in search of the cosmic cube. Medusa brought Ulysses to Captain Marvel to share this vision and Danvers assembled her team of Ultimates to intercept Thanos when he arrived.
In the end, the Ultimates were able to defeat and apprehend Thanos, but the history came at a high cost. The hero, She-Hulk, was badly injured and War Machine (James Rhodes) was killed during the battle. Rhodes had been Tony Stark oldest and dearest friend and the news of his death was devastating for Stark.
Stark’s grief acted to further compound his suspicious distrust of Ulysses. Acting on rash impulse, Stark donned his Iron Man armor and broke into the royal palace of New Attilan. He abducted Ulysses and took the young man to one of his laboratories.
There Stark subjected Ulysses to a series of tests so to ascertain the exact nature of his powers. In so doing Stark learned that Ulysses’s predictions were the result of an uncanny process of statistical analysis of probability. To Stark’s thinking, this made Ulysses’ powers unreliable and too vulnerable to confounding variables. He was convinced that utilizing these powers to prevent crimes and tragedies was not a viable option.
The Ultimates and The Inhumans rescued Ulysses from Stark and Captain Marvel was able to convince Medusa to stand down and not extract immediate vengeance on Stark for his transgression (she would do so anyway later on). Stark’s misgivings notwithstanding, Danvers remained steadfast to the idea that Ulysses’ powers must be used to protect lives and avoid disasters. Ulysses worked closely with The Ultimates as Captain Marvel put together a ‘predictive justice’ initiative whereby the young man’s visions were used to prevent crimes and accidents before they happened. This initiative was largely successful and many crimes along with minor and major disasters were avoided. And yet a growing schism was manifesting among the superhero community, with many feeling that the predictive justice program was a good strategy and many others feeling that it was a bad idea and that it infringed on the civil liberties of the people it effected.

This schism came to a head when Ulysses had a vision that The Hulk (Bruce Banner) would go on a rampage that would claim hundreds of lives. The heroes converged on Banner to try to make sure that this terrible event would not occur. Banner had previously entered into a pact with Hawkeye (Clint Barton) in which Barton promised to kill Banner if he ever again lost control and turned into the Hulk. Banner had fashioned Barton with a specialized ‘gamma-arrow’ that would prove lethal to the Hulk. During the encounter with the various heroes, Banner started to become flustered. He grew angry and it looked as though he was about to transform into the Hulk. Before he could, however, Barton shot the specialized arrow and killed Bruce Banner.
Barton was eventually acquitted of the charges of murder in Banner’s death, but the whole ordeal had fully crystalized the divide among the heroes. The side led by Iron Man decided that the predictive justice program had to be shut down and this ultimately resulted in a massive battle of hero versus hero.
As this conflict unfolded and intensified, Ulysses’ powers continued to grow. Soon he was able to see not only the future, but all potential futures. His consciousness expanded beyond the human plain and his corporal form dissolved as he ascended to become a kind of cosmic god. In so doing, Ulysses essentially disappeared from earth. The conflict over whether or not to utilize his abilities for predictive justice became a moot point and the civil war between the heroes came to an end.
Most recently, Ulysses was seen amongst the pantheon of cosmic deities of the universe.

8 notes
·
View notes
Link
When it comes to customer onboarding in the financial services industry, FinTechs have been revolutionizing the minds of the customers about how they can approach a financial institution. Since customer onboarding service leaves a long-lasting impression on the customers, it becomes essential to work on simplifying the process by meeting all the regulatory requirements while providing the customers with a frictionless experience.
Why is a smooth customer onboarding process required? Imagine yourself registering an account with a bank. Due to their long and complex procedure, what would you prefer? Abandon the process in between and go for other banks that will make your life simple. The complicated onboarding process leads to customer abandonment affecting the revenue and welcoming a bad brand perception.
A fast and frictionless customer onboarding process directly affects customer loyalty, experience, referrals, and profitability. The current scenario in banks includes the involvement of multiple departments within the organization like operations, risk, credit, tax, and so on performing various functions. Every department has its own touchpoints and covering them all consumes time.
Key Challenges
Though frictionless customer onboarding is very critical for banks and financial institutions, there are still some challenges in streamlining the onboarding processes while maintaining regulatory compliance.
Unstructured process
The customer onboarding has to follow a process that involves various departments. Each department has its own interpretation of regulations. Therefore, they end up having a department-specific process within the bank. This creates confusion among the customers, especially when they are asked to provide repeated information in several situations and to different parties.
As per a survey by Forrester, the estimated time slab taken by a financial institution is between 2-34 weeks for completing the manual process of the customer onboarding.
Varying Regulations
Regulations keep changing, either on a monthly basis or on a weekly basis. Due to frequent changes in the regulations, banks need to update their systems accordingly. With banks being flooded with new regulations now and then, they need to switch to and fro between the current processes and rely on the new technology initiatives for making themselves compliant. The customers need an explanation when they come across these sudden changes and the banks buy time to ensure that these regulations are incorporated in the onboarding process.
Data Collaboration
Integrating anti-fraud and anti-money laundering systems into a single technology environment is captivating and challenging too. To gain a deep insight into customer behavior and thoughts over a service, financial institutions should be capable of combining both internal and external data of the customer. This, if done, will provide collective knowledge for enhanced customer experience by organizing the process.
Quality
The due diligence process is different for every entity and from country to country. Therefore, the experience will definitely vary at a larger scale within one financial service entity. For example, if a bank has one branch in the US and the other in France, the onboarding experience of a customer will differ at both the branches. Each entity has a country-specific process depending on the location it is present, and this needs to be addressed.
Time
The manual onboarding process demands the involvement of multiple documents, touch-points, and departments. This complex process with multiple involvements makes customer onboarding time-consuming. The involvement of various touch-points in the process changes for every entity within an organization. For instance, say a bank has three entities: retail, insurance, and corporate. All three entities are catering to the requirements of their specific customers and businesses and act accordingly. Every entity has its own onboarding process and set of regulations. If you become a customer for all three entities, you have to go through the entire customer onboarding process thrice. Isn’t it a frustrating thing!
Access
With the tech trends buzzing all around, banks are under constant pressure to provide real-time information to their customers. Whether account balance, opening a new account or hassle-less payments, customers demand access to the bank and their account irrespective of their location and time. Since many banks still rely on legacy systems, providing a digital experience to their customers still remains an unresolved challenge.
Culture
The financial sector always aims to satisfy their customers in every possible way. They intend to provide a fantabulous customer experience during the onboarding and KYC process. But due to lower investments in opportunities that are often neglected, say, customer onboarding, and the culture to analyze the customer needs and market dynamics are still absent creating a significant barrier to digital effectiveness.
In a customer-centric approach, customer onboarding becomes the first interaction with the firm. This is the moment in which the relationship-building process starts. Customer onboarding is an indicator of the FinTech industry and how they will be using financial services in the future.
If the customer onboarding goes as per the strategy and expectation, it contributes to building loyalty, trust and customer retention in the future. If you find ignoring the importance of onboarding is ideal, then as per the statistics by DBR, most financial institutions have suffered $400 in revenue from each customer as a result of a 25-40% rate of friction.
How can you provide a simplified and valuable onboarding experience?
When we say customer-centric methodologies, we need to strategize the onboarding process in such a way that the customers consider it as a single process irrespective of the channels they use.
The onboarding strategy should offer cutting-edge personalized experiences that engage the customers throughout the process across multiple channels.
One of the best practices is giving your customers the freedom of interacting via multiple channels at any point in time. This accords customers with convenience. Therefore, an omnichannel strategy has the capacity to give your customers the flexibility of starting their onboarding process and in between switching to and fro between the channels and picking up from where they left. This strategy, where you give customers the freedom of starting the onboarding anywhere, results in enhanced user experience.
To strategize an omnichannel onboarding process, you need to pen down the following points:
Desirability: What users want? Whatever I am providing, do they want it? This question will help to create a link between the onboarding and the target customers.
Viability: Shall we do it? Whatever you have strategized, this question will help you to align the new service with the strategy.
Feasibility: Is it possible for us to do it? This question will help to establish a link with the architecture of your Financial institution and its capacity.
But, implementing a new onboarding process requires the proper analysis of your business architecture. Since onboarding your customers will establish a relationship with you, i.e., the financial provider, you need to identify your business architecture by accounting for all the relevant information. This includes displaying the information, capturing data, product activation, follow-up activities like the first installment, first contact with the insurance agent, and many more. Remember your goal is to provide your customers with valuable onboarding experience and not a mere website or app.
You can provide a valuable onboarding experience by implementing the following capabilities:
Provide your users with a fully tailored, uncluttered, and simple easy-to-use front-end.
Capture all the customer’s static data and important documents.
Enhance the user experience by performing OCR on the documents.
Use advanced facial recognition using photos and videos.
Perform basic AML/CTF background checks.
Provisions for electronic signatures on the contracts between the customer and the financial institutions.
Create a perfect onboarding customer experience for your customers with the following to-dos:
Know and understand your customers : Make it a clear point! You need to know your customers in-and-out. You have to understand their obstacles, the challenges, the pain points and the solutions they are or have been accustomed to. This information helps you to tailor the onboarding experience of your customer.
Expectations should be clear : Guide your customers towards making the right expectation from your product. This helps in your sales process by qualifying the real factors for using the product. You can give a clear idea about what they can expect and what are the pain points they might go through. This will make them stay for long even in case of downfall of the product.
Show Value : Before getting excited about your product, reemphasize on the value your product will be providing to your customers. Show them use cases where your product is addressing the pain points of the customers. A documentation or maybe training can be useful in this context.
Constant Communication : To make your customers view the in-app notifications, it is essential to be in constant touch with your customers. Email is the best way as it is one of the most common mediums to engage your customers. Once your product is able to gain the trust, your customers will automatically sign-up for all in-app guides, tutorials, and notifications.
Customer-centric Goals: Create customer-centric goals as every goal and metrics will vary according to their situations. You can help them to create milestones and, later, help them to set benchmarks as well.
Don’t forget to impress : Your main aim is to impress your customers throughout the process. Deliver a stellar performance so that they publicize your brand and share with others.
Measure your success : A positive customer onboarding experience benefits both your business and the customers. To measure your business success, keep taking feedback from your customers and the traction points. This will help you to perform better and stay ahead in the competition.
Technology Trends in FinTech for Boosting Customer Onboarding
FinTech makes use of innovative technologies like AI, Machine Learning, and process automation. This enhances the customer onboarding process with more flexibility and optimized cost. FinTech aims in creating a highly personalized experience for its customers. Some of the current trends in FinTech:
Artificial intelligence (AI) – This technology will help in making decisions by predicting human behavior. Personalization is what every customer is looking for. FinTechs are trying hard to provide their customers personalized service with AI tech.
Blockchain – Customers can securely manage digital identities with Blockchain. Moreover, financial institutions and banks can easily, securely, and reliably manage customer data through blockchain-based KYC solutions.
Digital identities – Digital identities verify your identity of what you claim to be. This will promote interoperability and transparency across all the entities within the country.
Biometrics – With iris scanning, fingerprinting, voice recognition, face ID, and so on, biometrics has been buzzing around the financial sector. Though it hasn’t been accepted globally, biometrics are becoming industry standards soon for its security through the inherent characteristics of an individual. FinTechs are trying hard to switch to biometrics for strong authentication rather than just using passwords or codes to secure their financial information.
Benefits of a simplified onboarding process
With digitization, the online onboarding process promises the following benefits in addition to the reduction in processing time and cost due to process optimization:
Banking services can be accessed in a faster and more flexible way.
Get distinguished due to innovation and reinforce brand awareness.
With digitization, easily switch between in-branch and online onboarding.
Digitization makes the onboarding process take a matter of minutes.
If the onboarding becomes a matter of minutes and the process is simplified, the user-experience will automatically be enhanced.
Better user experience leads to an increase in sales and, in turn, increases the revenue.
Digitization reduces the usage of papers and thus reduces document losses and management.
Digitization promotes structured file archiving.
Since digitization reduces cost due to the optimized process, it reduces cost-to-serve as well.
Automated and accelerated costs boost operational efficiency and reduce operational cost.
The automated and accelerated process leads to the freeing up of employees. This can help them to concentrate on more valuable activities.
Wrapping up!
Digital transformation is a bridge to meet the demand of the customers and increase engagement anytime, anywhere. Digital transformation is highly driven by the pervasive nature of mobile technology in our daily lives. To transform the customer experience, banks and credit unions are trying hard to develop mobile account opening, mobile onboarding, and digital engagement tools.
Fintechs are leading the competition against the incumbent banks. Traditional banks are lagging because they are often burdened with multiple legacy systems. Since speed is the key factor, Fintechs quickly adopt the latest technologies and processes. They work on providing the onboarding process fast, immediate access to the services, and deliver these services with convenience, speed, and in a simple and functional way.
Fintech app development companies are trying to fill the gaps left by the banks and create a disruption in the financial services. Fintech institutions are providing a broad spectrum of services right from payments to wealth and asset management. These capabilities of FinTech are contributing to the rapid development of the financial sector.
0 notes
Text
Covid pandemic,social media and digital distancing

Many distress calls that we cater to nowadays are related to compulsive use of internet and social media leading to health anxiety and somatic complaints. While we have witnessed a global health threat named Covid-19 in the last few months, the spread of information about the pandemic has been much faster than the virus itself. There has not been one day since the World Health Organization declared it a public health emergency that I have not come across messages, memes or videos related to Covid going viral on social media. Added to it is the plethora of information about the outbreak statistics (number of cases, casualties in every single geographical distribution, etc.) being fed to the people 24/7 daily. As billions are isolated or quarantined in their homes in an attempt to contain the infection, digital screen time has increased. Information pollution about Covid every single day adds to the already existing uncertainty and panic about the virus and lockdown. People have often been seen with their eyes glued to their televisions, laptops or mobile screens, busy consuming news feeds related to the coronavirus. This often assumes a compulsive nature, with a need to stay updated about every single facet of the illness, which further increases the psychological discomfort and physical unrest. Role of Social Media: Contrary to popular belief, Covid-19 is not the first ‘digital infodemic’. In the recent past, outbreaks of Zika in Brazil, Ebola in Africa, Influenza in Europe and Nipah in India had similar bidirectional relationships with media. However, the degree of ‘media panic’, the amount of media consumption and the consequent change in public reaction have been much higher during Covid-19. An article by Phil Harding titled ‘Pandemics, Plagues and Panic’ (2009) in British Journalism Review highlights how the spread of an illness and the resultant human behaviour can be influenced significantly by the flow and vectors of information. Health communication and understanding of public health depends a lot on how the data about an illness is interpreted by the masses. Within every bit of news, there can be a potential admixture of fake information, with the major challenge being teasing out the truth. This health-related misinformation becomes all the more crucial during a pandemic like this when the fear of an unknown infection without a definitive cure mixes with an anxious mind that tends to easily accept fast solutions and theories, irrespective of visible loopholes in their logic and reasoning. One senseless forward of a wrong message, in the wrong hands, can snowball the spread, increasing the acceptability as it moves along the chain. Often, names of credible public health agencies like the WHO, Centre for Disease Control and Prevention (CDC), etc., are tagged along wrongly to make the piece of false news more acceptable. Similar things were being circulated during the first wave of infection in China, implicating ‘biological weaponry’ in the origin of the coronavirus.The impact that information or misinformation can have on human behaviour is remarkable. It can range from faulty treatments and non-compliance to panic, mass hysteria and competition for healthcare resources. On the other hand, relevant and timely information has shown to improve preparedness for infectious diseases and strengthen public health infrastructure. So social media can be a double-edged sword. A review by Abhay Kadam and Sachin Atre (2020) in Journal of Travel Medicine points out that social media reach has risen three times during the lockdown period in India, with Covid-19-related search spiking significantly. The inherent insecurity and lack of daily structure during the lockdown makes us feel inadequate without the constant feed of health-related information. It is indeed challenging to find a fine balance between the toxic overuse of technology and healthy and systematic harnessing of healthcare data. Many distress calls that we cater to nowadays are related to compulsive use of the internet and social media leading to health anxiety, somatic complaints, anxiety, depressive disorders, agitation and insomnia. On a different note, children and adolescents exposed to more online time tend to develop technology and gaming addiction. It is vital to remember that certain unhealthy habits will long outlast the pandemic to cause continued problems in life. Further, social media-related blame and othering can also lead to stigma, marginalisation, communalism and violence, especially at such times of crisis. People from the Northeast, certain religious communities and lower socio-economic classes like the migrants and homeless have already been victims of such stigmatisation.Digital balance and the way forward: Is information dissemination all that bad? Not at all! History has proven that continued and timely liaison between media personnel and the scientific community can help immensely for Information-Education-Communication (IEC) outreach in the community. The increased use of social media can be a powerful tool for debunking misinformation itself. The linkage of various media platforms with scientific databases like Pubmed, Google Scholar, etc., can provide appropriate search guidance. Content analysis of the search data gives useful information about the search trends, the sought-after information and unmet needs for data. Those can then be harnessed for authentic updates and fighting false news. Awareness of healthy use of technology can be spread by social media itself with administrative reforms regulating unnecessary forwards and rumour mongering.Importantly, we need to understand that we do need information, but loads of statistics about every single aspect of the virus makes no sense to the masses. This will do more harm than good.Maintaining a conscious and informed distance from social media can help increase the Covid-free time, which is so necessary for mental well-being. Technology can be used for social connectedness rather than isolating us in our own digital spaces. What all of us would want most is to prevent Covid from invading our mental peace. So, let us try and practise digital distancing. As the saying goes, “Discipline is choosing between what you want now and what you want most.” Read the full article
0 notes
Text
The budget must dispel the people’s doubts - analysis

So many different explanations are being offered for the current slowdown in the economy that budget 2020 needs to provide a level of explanation far greater than what has been done by any previous budget document. The philosophy of the government needs to be given as much space as the actual plan itself.For a start, the budget needs to explain how the government has fared on the non-economic goals it set for itself last year. The 2019 Economic Survey has some fairly good directions towards improving health care, using data better, labour market reforms, strengthening the lower judiciary and creating a significant centre for electric vehicles. A first message that would build credibility is to clearly indicate what was achieved in some of the areas. There has been a view that the appetite for investment has tapered off. At a philosophical level, animal spirits are required to drive investment. These abound only when there are meaningful opportunities for profit. The dramatic take-off in growth in the mid-90s was because opportunities for super profits existed. Inevitably, these opportunities also created oligopolies amid accusations of the disproportionate accumulation of wealth (For example: Harshad Mehta/Sukh Ram and other worthies from the past). A series of actions, starting from the overreach during the 2G scam, through to the highly priced auctions for resources, have tightened the tap on some of the routes to high profit. This has particular resonance when one expects private parties to actively participate in divestments or the sale of natural resources like coal. It would be worthwhile to indicate that the government is prepared to leave some money on the table, as that is the incentive for people to invest behind in what is an uncertain risk environment. The government needs to communicate that investment and job growth may take precedence over revenue maximisation. There is nothing wrong or unethical in making such a choice.This period of slow growth has placed a burden on State revenues, imposing fiscal pressures. Governments have traditionally sought to understate fiscal deficits, through their cash accounting mechanism — by simply not making payments. In particular, in situations where the last-mile closures of projects have not happened (in the case of highways, for example), for reasons outside the control of private parties, there needs to be an approach which ensures at least some liquidity to the bidding company. It is better to acknowledge the existence of a higher fiscal deficit, explain its causes and increase the flow of payments through the system. Credit rating agencies, who are often sensitive to fiscal shortfalls, are likely to be far more accommodating of fiscal expansions if the budget indicates why the actions taken will be useful, especially in creating jobs and stimulating demand.One response to anticipated fiscal constraints seems to have been a tightening of tax collection, resulting in anecdotal instances of the creation of a fear psychosis. The finance minister and others have correctly sent across the message that the tax department needs to be more transparent in its positions and be seen to be fair towards the assessee. Greater collections and a lower potential for harassment will come only with a simples tax code. It will be worth stating how the government wants to simplify the tax process, and what its expectations would be by way of higher revenues but greater ease of tax management, so that assessors and assesses know the behaviour expected of them. The strong mandate received by the ruling party would indicate that the efforts made towards the provision of toilets, gas connections, insurance and financial inclusion were, in some measure, successful. This constitutes an extraordinary achievement in a country of our complexity. If the government can provide third party evidence of improved outcomes, this would demonstrate that its welfare State activities have actually paid off. It is also worth explaining why these actions, if successful, have not boosted growth. This might indeed be because many of the products that were delivered to the public provide great convenience (such as the Ujala scheme), but do not necessarily induce extra consumption. But, we need to hear this from the finance minister and the chief economist.A defining feature of the past few years has been the pursuit of investigations into irregularities of various kinds. These investigations are desirable to reinforce a compliance culture, which was often largely absent. The budget must indicate a time frame to arrive at some settlement of most of these investigations. While the government cannot control the judicial processes that defendants might use, they can make clear the behaviours, in their view, violate the spirit of the law and that such violators would, in future, not meet “ fit and proper “ requirements for, say, government contracts. In a market economy, that alone would normally suffice as punishment. There is more than enough discretion in government to bring errant companies to heel by using the “ spirit of the law doctrine”. In specific situations such as the sale of stressed assets through the National Company Law Appellate Tribunal, the government could reiterate that those who take on stressed assets will not be held accountable for the misdemeanours of past owners. This is not being said often enough.Considerable debate has ensued about the quality of economic data, without which one cannot objectively assess the performance of government. Changes in statistical bases, though very well-intentioned, have allowed opponents of government action the room to make criticism that are then difficult to disprove. Greater effort could be made to explain exactly why these changes in data were made and for the government to help interpret these in a credible manner. Budgets are about choices, and by explaining the rationale underpinning these , the government will increase the conviction in the plans for the $ 5 trillion dollar economy. Govind Sankaranarayanan is former COO and CFO, Tata Capital , is currently vice chairman at ESG Fund ECube Investment AdvisorsThe views expressed are personal Read the full article
#24/7newsupdates#3newsupdates#30thnewsupdates#3awnewsupdates#5newsupdates#570newsupdates#58newsupdates#5pmnewsupdates#6newsupdate#680newsupdates#69newsupdates#7newsupdateadelaide#7newsupdategoldcoast#7newsupdateperth#7newsupdateplainsvideo#7newsupdatesydney#7newsupdatesbrisbane#7newsupdatesmelbourne#9newsfireupdates#9newslatestupdates#9newsliveupdates#9newsweatherupdates#9&10newsupdates#92newsupdatesinurdu#9janewsupdatesnow#arynewsupdates#analysis#aplatestnewsupdatesintelugu#apnewsupdates#apnewsupdatestelugu
0 notes
Text
AI & Machine Learning Learning Path: A Definitive Guide

Artificial intelligence is currently one of the hottest buzzwords in tech — with good reason. In the last few years, we have seen several technologies previously in the realm of science fiction transform into reality. Experts look at artificial intelligence as a factor of production, that has the potential to introduce new sources of growth and change the way work is done across industries. In fact, AI technologies could increase labour productivity by 40% or more by 2035, according to a recent report by Accenture. This could double economic growth in 12 developed nations that continue to draw talented and experienced professionals to work in this field. According to Gartner's 2019 CIO Agenda survey, the percentage of organizations adopting AI jumped from four to 14% between 2018 and 2019. Given the benefits that AI and machine learning (ML) enable in business analysis, risk assessment, and R&D — and, the resulting cost-savings — AI implementation will continue to rise in 2020. However, many organizations that adopt AI and machine learning don’t fully understand these technologies. In fact, Forbes points out that 40% of the European companies claiming to be ‘AI startups’ don’t use the technology at all. While the benefits of AI and ML are becoming more evident, businesses need to step up and hire people with the right skills to implement these technologies. Some are well on their way. KPMG’s recent survey of Global 500 companies shows that most of those surveyed expect their investment in AI-related talent to increase by 50 to 100% over the next three years.
Why Pursue AI and Machine Learning Courses?
As data science and AI industries continue to expand, more people are beginning to understand just how valuable it is to have a qualified AI Engineer or data scientist on their team. As a matter of fact, Indeed.com revealed that job postings for data scientists and AI rose over 29% between May 2018 and May 2019. Many people who want to get into this field, typically start with YouTube videos or other free online courses. This approach is definitely good to get your feet wet, but you can't make a career jump based on these alone. What you need is to get a handle on the fundamentals of data science is experience through hands-on projects, where you get guidance from experts. These opportunities are not generally available in the workplace, especially if your current role does not involve data science. However, there are some excellent, comprehensive courses that you can enrol in, which will provide you with all of the above. Courses like Simplilearn's Artificial Intelligence Engineer program enable you to learn, practice, and interact with expert instructors and peer, in live, online sessions. You don't even have to travel. If you’re looking for a course that keeps students up to date on the latest trends in AI and machine learning through practical projects and industry expert-led instruction, Simplilearn’s AI Engineer and Machine Learning Certification courses are excellent options. There is no better time than now to get started, especially if you want to get ahead of your peers.
Learning Path: How to Get an AI and Machine Learning Career Started
Choosing a learning path for AI and machine learning training can be overwhelming due to all the options out there, but it’s ideal to choose a program that best suits your needs and goals. Successful data scientists usually have a thorough comprehension of various tools and programming languages. They also understand what their roles are in the grand scheme of things. With these skills, you can easily stand out from the competition with potential employers. Some of the programming languages include SAS, R, and Python. What you’ll need to know depends on different variables, such as the specific project you’re working on or the company you’re working for. In order to be a well-rounded candidate that can take on any type of project, it’s critical to know all three of these programming languages. Beyond that, it’s also helpful for data scientists to learn about AI and machine learning. When you enrol in an accredited data science learning program, you’ll get comprehensive training in the field. Let’s dig into some suggested learning paths for AI and machine learning to give you a better idea of what’s available and what to expect.
Artificial Intelligence Engineer Master’s Program
Simplilearn’s Artificial Intelligence Master’s Program, co-developed with IBM, is a blend of artificial intelligence, data science, machine learning, and deep learning — facilitating the real-world implementation of advanced tools and techniques. The program is designed to give you in-depth knowledge of AI concepts including the essentials of statistics (required for data science), Python programming, and machine learning. Through these courses, you will learn how to use Python libraries like NumPY, SciPy, Scikit; as well as essential machine learning techniques, such as supervised and unsupervised learning, advanced concepts covering artificial neural networks, layers of data abstraction, and the basics of TensorFlow. Next, let’s look at the courses that are included in this program, which can also be taken separately. Data Science with Python The Data Science with Python course provides students with all-around data science instruction that includes data visualization, machine learning, data analysis, and natural language processing using Python. As a data scientist, it’s crucial to add Python to your skillset, as more and more professionals in the industry are mastering this programming language. In fact, it has been reported that with seven million people now using Python, surpassing Java as the top programing language. This course is not only suited for those wishing to pursue a career as a data scientist but can also be beneficial for anyone looking to work in data analytics or software development. Machine Learning As a data scientist, mastering machine learning is often a requirement, and the best way to do so is by enrolling in an accredited learning program and earning a machine learning certification. Although there are free online learning sources and tutorials, such as blogs and YouTube videos, these unstructured learning methods don’t always cover all aspects of ML. Also, self-learners may not be able to stay up-to-date on industry changes or receive certifications. Through our machine learning course, students are introduced to various techniques and concepts, such as mathematical and heuristic aspects, supervised and unsupervised learning, algorithm development, and hands-on modelling. This course is ideal for those who want to add to their skill set as a data scientist, or for those who wish to pursue a career as a machine learning engineer. Deep Learning with TensorFlow Deep learning is one of the most exciting and promising segments of artificial intelligence and machine learning technologies. Our Deep Learning with TensorFlow and Keras course is designed to help you master key deep learning techniques. You’ll learn how to build deep learning models using TensorFlow, the open-source software library developed by Google to conduct machine learning and deep neural networks research. It is one of the most popular software platforms used for deep learning and contains powerful tools to help you build and implement artificial neural networks. Advancements in deep learning are already showing up in smartphone applications and efficient power grids. The technology is also driving innovations in healthcare, improving agricultural yields, and helping us find solutions to climate change. With this Tensorflow course, you’ll build expertise in deep learning models, learn to operate TensorFlow to manage neural networks, and how to interpret the results. Natural Language Processing (NLP) Simplilearn’s NLP course gives you a detailed look at the science of applying machine learning algorithms to process large amounts of natural language data. You will learn the concepts of statistical machine translation and neural models, deep semantic similarity models (DSSM), neural knowledge base embedding, deep reinforcement learning techniques, neural models applied in image captioning, and visual question answering using Python’s Natural Language Toolkit (NLTK). AI Capstone Project Simplilearn’s Artificial Intelligence (AI) Capstone project gives you the opportunity to implement the skills you learned in the AI Engineer Master’s program. With dedicated mentoring sessions, you’ll learn how to solve a real industry problem. You'll also learn various AI-based supervised and unsupervised techniques like regression, multinomial Naïve Bayes, SVM, tree-based algorithms, NLP, etc. The project is the final step in the learning path and will help you to showcase your expertise to potential employers.
Bottom Line
There is no denying that the job market is competitive. In fact, the Bureau of Labor Statistics recently released a report that reveals how the job market is tightening. If you’re looking for a stable industry that isn’t going anywhere anytime soon, AI and machine learning are excellent choices. However, choosing a growing and successful industry is only half the battle when it comes to job security. There is also a competition to consider — oftentimes, many qualified candidates are vying for the same job opening. One of the best ways to ensure you stand out to recruiters and employers is to have the right credentials. Earning your certifications in AI and machine learning, or other relevant fields is a surefire way to get your resume noticed by the right people. Get started today! Read the full article
0 notes
Text
Anomaly Detection — Another Challenge for Artificial Intelligence

Image Credit: unsplash.com
It is true that the Industrial Internet of Things will change the world someday. So far, it is the abundance of data that makes the world spin faster. Piled in sometimes unmanageable datasets, big data turned from the Holy Grail into a problem pushing businesses and organizations to make faster decisions in real-time. One way to process data faster and more efficiently is to detect abnormal events, changes or shifts in datasets. Thus, anomaly detection, a technology that relies on Artificial Intelligence to identify abnormal behavior within the pool of collected data, has become one of the main objectives of the Industrial IoT .
Anomaly detection refers to identification of items or events that do not conform to an expected pattern or to other items in a dataset that are usually undetectable by a human expert. Such anomalies can usually be translated into problems such as structural defects, errors or frauds.
Examples of potential anomalies:
A leaking connection pipe that leads to the shutting down of the entire production line;
Multiple failed login attempts indicating the possibility of fishy cyber activity;
Fraud detection in financial transactions.
Why is it important?
Modern businesses are beginning to understand the importance of interconnected operations to get the full picture of their business. Besides, they need to respond to fast-moving changes in data promptly, especially in case of cybersecurity threats. Anomaly detection can be a key for solving such intrusions, as while detecting anomalies, perturbations of normal behavior indicate a presence of intended or unintended induced attacks, defects, faults, and such.
Unfortunately, there is no effective way to handle and analyze constantly growing datasets manually. With the dynamic systems having numerous components in perpetual motion where the “normal” behavior is constantly redefined, a new proactive approach to identify anomalous behavior is needed.
Statistical Process Control
Statistical Process Control, or SPC, is a gold-standard methodology for measuring and controlling quality in the course of manufacturing. Quality data in the form of product or process measurements are obtained in real-time during the manufacturing process and plotted on a graph with predetermined control limits that reflect the capability of the process. Data that falls within the control limits indicates that everything is operating as expected. Any variation within the control limits is likely due to a common cause — the natural variation that is expected as part of the process. If data falls outside of the control limits, this indicates that an assignable cause might be the source of the product variation, and something within the process needs to be addressed and changed to fix the issue before defects occur. In this way, SPC is an effective method to drive continuous improvement. By monitoring and controlling a process, we can assure that it operates at its fullest potential and detect anomalies at early stages.
Introduced in 1924, the method is likely to stay in the heart of industrial quality assurance forever. However, its integration with Artificial Intelligence techniques will be able to make it more accurate and precise and give more insights into the manufacturing process and the nature of anomalies.
Tasks for Artificial Intelligence
When human resources are not enough to handle the elastic environment of cloud infrastructure, microservices and containers, Artificial Intelligence comes in, offering help in many aspects:

Tasks for Artificial Intelligence
Automation: AI-driven anomaly detection algorithms can automatically analyze datasets, dynamically fine-tune the parameters of normal behavior and identify breaches in the patterns.
Real-time analysis: AI solutions can interpret data activity in real time. The moment a pattern isn’t recognized by the system, it sends a signal.
Scrupulousness: Anomaly detection platforms provide end-to-end gap-free monitoring to go through minutiae of data and identify smallest anomalies that would go unnoticed by humans
Accuracy: AI enhances the accuracy of anomaly detection avoiding nuisance alerts and false positives/negatives triggered by static thresholds.
Self-learning: AI-driven algorithms constitute the core of self-learning systems that are able to learn from data patterns and deliver predictions or answers as required.
Learning Process of AI Systems
One of the best things about AI systems and ML-based solutions is that they can learn on the go and deliver better and more precise results with every iteration. The pipeline of the learning process is pretty much the same for every system and comprises the following automatic and human-assisted stages:
Datasets are fed to an AI system
Data models are developed based on the datasets
A potential anomaly is raised each time a transaction deviates from the model
A domain expert approves the deviation as an anomaly
The system learns from the action and builds upon the data model for future predictions
The system continues to accumulate patterns based on the preset conditions
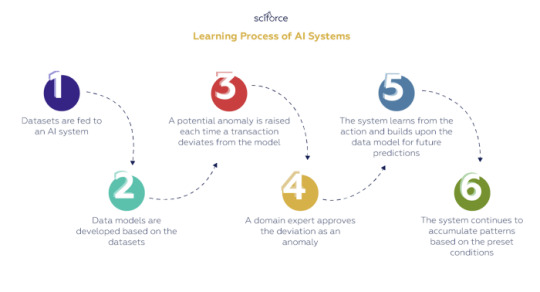
Learning Process of AI Systems
As elsewhere in AI-powered solutions, the algorithms to detect anomalies are built on supervised or unsupervised machine learning techniques.
Supervised Machine Learning for Anomaly Detection
The supervised method requires a labeled training set with normal and anomalous samples for constructing a predictive model. The most common supervised methods include supervised neural networks, support vector machine, k-nearest neighbors, Bayesian networks and decision trees.
Probably, the most popular nonparametric technique is K-nearest neighbor (k-NN) that calculates the approximate distances between different points on the input vectors and assigns the unlabeled point to the class of its K-nearest neighbors. Another effective model is the Bayesian network that encodes probabilistic relationships among variables of interest.
Supervised models are believed to provide a better detection rate than unsupervised methods due to their capability of encoding interdependencies between variables, along with their ability to incorporate both prior knowledge and data and to return a confidence score with the model output.
Unsupervised Machine Learning for Anomaly Detection
Unsupervised techniques do not require manually labeled training data. They presume that most of the network connections are normal traffic and only a small amount of percentage is abnormal and anticipate that malicious traffic is statistically different from normal traffic. Based on these two assumptions, groups of frequent similar instances are assumed to be normal and the data groups that are infrequent are categorized as malicious.
The most popular unsupervised algorithms include K-means, Autoencoders, GMMs, PCAs, and hypothesis tests-based analysis.

The most popular unsupervised algorithms
SciForce’s Chase for Anomalies
Like probably any company specialized in Artificial Intelligence and dealing with solutions for IoT, we found ourselves hunting for anomalies for our client from the manufacturing industry. Using generative models for likelihood estimation, we detected the algorithm defects, speeding up regular processing algorithms, increasing the system stability, and creating a customized processing routine which takes care of anomalies.
For anomaly detection to be used commercially, it needs to encompass two parts: anomaly detection itself and prediction of future anomalies.
Anomaly detection part
For the anomaly detection part, we relied on autoencoders — models that map input data into a hidden representation and then attempt to restore the original input from this internal representation. For regular pieces of data, such reconstruction will be accurate, while in case of anomalies, the decoding result will differ noticeably from the input.
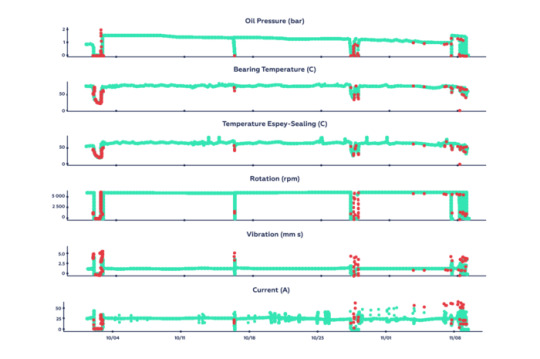
Results of our anomaly detection model. Potential anomalies are marked in red.
In addition to the autoencoder model, we had a quantitative assessment of the similarity between the reconstruction and the original input. For this, we first computed sliding window averages for sensor inputs, i.e. the average value for each sensor over a 1-min. interval each 30 sec. and fed the data to the autoencoder model. Afterwards, we calculated distances between the input data and the reconstruction on a set of data and computed quantiles for distances distribution. Such quantiles allowed us to translate an abstract distance number into a meaningful measure and mark samples that exceeded a present threshold (97%) as an anomaly.
Sensor readings prediction
With enough training data, quantiles can serve as an input for prediction models based on recurrent neural networks (RNNs). The goal of our prediction model was to estimate sensor readings in future.
Though we used each sensor to predict other sensors’ behavior, we had trained a separate model for each sensor. Since the trends in data samples were clear enough, we used linear autoregressive models that used previous readings to predict future values.
Similarly to the anomaly detection part, we computed average each sensor values over 1-min. interval each 30 sec. Then we built a 30-minute context (or the number of previous timesteps) by stacking 30 consecutive windows. The resulting data was fed into prediction models for each sensor and the predictions were saved as estimates of the sensor readings for the following 1-minute window. To expand over time, we gradually substituted the older windows with predicted values.

Results of prediction models outputs with historical data marked in blue and predictions in green.
It turned out that the context is crucial for predicting the next time step. With the scarce data available and relatively small context windows we could make accurate predictions for up to 10 minutes ahead.
Conclusion
Anomaly detection alone or coupled with the prediction functionality can be an effective means to catch the fraud and discover strange activity in large and complex datasets. It may be crucial for banking security, medicine, marketing, natural sciences, and manufacturing industries which are dependent on the smooth and secure operations. With Artificial Intelligence, businesses can increase effectiveness and safety of their digital operations — preferably, with our help.
0 notes
Text
Bayesian reasoning
Objective vs subjective Bayes
subjective Bayes: all probabilities are just opinion
the best we can do with an opinion is make sure it isn’t self contradictory
satisfying the rules of probability is a way of ensuring that.
objective Bayes: there exists a correct probability for every hypothesis given certain information
different people with the same information should make exactly the same probability judgments
In the objectivist stream, the statistical analysis depends on only the model assumed and the data analyzed. No subjective decisions need to be involved. In contrast, "subjectivist" statisticians deny the possibility of fully objective analysis for the general case.
Bayesian inference – how an ideal perfect reasoner would respond to certain pieces of information
“The essence of rationality lies precisely in the existence of some constraints.” — Ariel Caticha
“A Bayesian is one who, vaguely expecting a horse, and catching a glimpse of a donkey, strongly believes he has seen a mule.”
Bayesian methodology
use of random variables to model all sources of uncertainty
requires you to determine a prior probability distribution, taking into account all available information
the posterior distribution becomes the next prior
useful to contrast against frequentist methodology – for a frequentist, the probability of a hypothesis is either 0 or 1
by contrast, for a Bayesian, it can be in a range from 0 to 1
frequentist interpretation supports the statistical needs of experimental scientists and pollsters
probabilities can be found by a repeatable objective process, rather than by opinion
frequentist and Bayesian interpretations are not in conflict – rather, the former provides guidance for how to apply probability theory to the design of practical experiments and the gathering of evidence
A Frequentist is someone that believes probabilities represent long run frequencies with which events occur
History
Thomas Bayes first proved a special case of what’s now called Bayes’ Theorem in the mid 1700s.
It went by the name of “inverse probability”, because it infers backwards from observations to parameters, from effects to causes.
In the 1800s, Pierre-Simon Laplace introduced a general version of the theorem.
Weaknesses of Bayesian analysis
choice of prior — if your priors are bad, then your results will be bad
computationally intensive, especially for models involving many variables
Bayesian approaches often lead to an answer that is a probability statement. Something like, for example, there is a 95% probability that the population mean is between 2.3 and 4.2 (given the data I observed).
A frequentist approach to the same problem leaves an answer that is a statement of "confidence" rather than probability. Something like, for example, with 95% confidence based on the data I observed, the population mean is between 2.3 and 4.2.
I have misplaced my phone somewhere in the home. I can use the phone locator on the base of the instrument to locate the phone and when I press the phone locator the phone starts beeping.
Problem: Which area of my home should I search?
Frequentist reasoning: I can hear the phone beeping. I also have a mental model which helps me identify the area from which the sound is coming. Therefore, upon hearing the beep, I infer the area of my home I must search to locate the phone.
Bayesian reasoning: I can hear the phone beeping. Now, apart from a mental model which helps me identify the area from which the sound is coming from, I also know the locations where I have misplaced the phone in the past. So, I combine my inferences using the beeps and my prior information about the locations I have misplaced the phone in the past to identify an area I must search to locate the phone.
Suppose you have no data ("no beeps"), could you make a probabilistic inference? Yes, you can, says the Bayesian, because you have prior knowledge about where you usually leave your phone (very likely) - but no, you cannot if you are a frequentist, since only data are random. -- It is here (I find) that one sees the "beauty" and consistency of Bayesian reasoning, because probabilistic inference without new data IS natural and the Bayesian nicely integrates how new data (beeps) should influence the inference.
Tossing a coin n times and estimating the probability of a heads (denote by p). Suppose, we observe k heads. Then the probability of getting k heads is: P(k heads in n trials) = (n, k) p^k (1-p)^(n-k).
Frequentist inference would maximize the above to arrive at an estimate of p = k / n.
Bayesian would say: Hey, I know that p ~ Beta(1,1) (which is equivalent to assuming that p is uniform on [0,1]). So, the updated inference would be: p ~ Beta(1+k,1+n-k) and thus the Bayesian estimate of p would be p = 1+k / (2+n).
If n=3, then the frequentist would estimate p=0 upon seeing a result of k=0 heads, i.e., the coin is two-headed or two-tailed. The Bayesian estimate of 1/5 does allow for the possibility that it is a somewhat less biased coin.
2 notes
·
View notes
Photo

What’s that study REALLY say? How to decode research, according to science nerds. http://bit.ly/301nzgi
Academic studies aren’t going to top any “best summer reads” lists: They can be complicated, confusing, and well, pretty boring. But learning to read scientific research can help you answer important client questions and concerns… and provide the best evidence-based advice. In this article, we’ll help you understand every part of a study, and give you a practical, step-by-step system to evaluate its quality, interpret the findings, and figure out what it really means to you and your clients.
+++
Twenty-five years ago, the only people interested in studies were scientists and unapologetic, card-carrying nerds (like us).
But these days, everyone seems to care what the research says.
Because of that, we’re inundated with sensational headlines and products touting impressive sounding, “science-backed” claims.
Naturally, your clients (and mother) want to know which ones have merit, and which ones don’t.
They may want your take on an unbelievable new diet trend that’s “based on a landmark study.”
Maybe they’re even questioning your advice:
“Aren’t eggs bad for you?”
“Won’t fruit make me fat?”
“Doesn’t microwaving destroy the nutrients?”
(No, no, and no.)
More importantly, they want to know why you, their health and fitness coach, are more believable than Dr. Oz, Goop, or that ripped social media star they follow (you know, the one with the little blue checkmark).
For health and fitness coaches, learning how to read scientific research can help make these conversations simpler and more well-informed.
The more you grow this skill set, the better you’ll be able to:
Identify false claims
Evaluate the merits of new research
Give evidence-based advice
But where do you even begin?
Right here, with this step-by-step guide to reading scientific studies. Use it to improve your ability to interpret a research paper, understand how it fits into the broader body of research, and see the worthwhile takeaways for your clients (and yourself).
++++
Know what counts as research, and what doesn’t.
People throw around the phrase, “I just read a study” all the time. But often, they’ve only seen it summarized in a magazine or on a website.
If you’re not a scientist, it’s okay to consult good-quality secondary sources for nutrition and health information. (That’s why we create Precision Nutrition content.) Practically speaking, there’s no need to dig into statistical analyses when a client asks you about green vegetables.
But for certain topics, and especially for emerging research, sometimes you’ll need to go straight to the original source.
Use the chart below to filter accordingly.
Okay, so how do you find the actual research?
Thanks to the internet, it’s pretty simple.
Online media sources reporting on research will often give you a link to the original study.
If you don’t have the link, search databases PubMed and Google Scholar using the authors’ names, journal name, and/or the study title.
(Totally lost? Check out this helpful PubMed tutorial for a primer on finding research online.)
If you’re having trouble finding a study, try searching the first, second, and last study authors’ names together. They rarely all appear on more than a handful of studies, so you’re likely to locate what you’re looking for.
You’ll almost always be able to read the study’s abstract—a short summary of the research—for free. Check to see if the full text is available, as well. If not, you may need to pay for access to read the complete study.
Once you’ve got your hands on the research, it’s time to dig in.
Not all research is created equal.
Be skeptical, careful, and analytical.
Quality varies greatly among publishers, journals, and even the scientific studies themselves.
After all, is every novel a Hemingway? Is every news outlet 100 percent objective? Are all your coworkers infallible geniuses?
Of course not. When it comes to achieving excellence, research has the same challenges as every other industry. For example…
Journals tend to publish novel findings.
Which sounds more interesting to read? A study that confirms what we already know, or one that offers something new and different?
Academic journals are businesses, and part of how they sell subscriptions, maintain their cutting-edge reputations, and get cited by other publications—and Good Morning America!—is by putting out new, attention-grabbing research.
As a result, some studies published in even the most well-respected scientific journals are one-offs that don’t mean all that much when compared to the rest of the research on that topic. (That’s one of many reasons nutrition science is so confusing.)
Researchers need to get published.
In order to get funding—a job requirement for many academics—researchers need to have their results seen. But getting published isn’t always easy, especially if their study results aren’t all that exciting.
Enter: predatory journals, which allow people to pay to have their research published without being reviewed. That’s a problem because it means no one is double-checking their work.
To those unfamiliar, studies published in these journals can look just like studies published in reputable ones. We even reviewed a study from one as an example, and we’ll tell you how to spot them on your own in a bit.
In the meantime, you can also check out this list of potentially predatory journals as a cross-reference.
Results can differ based on study size and duration.
Generally, the larger the sample size—the more people of a certain population who are studied—the more reliable the results (however at some point this becomes a problem, too).
The reason: With more people, you get more data. This allows scientists to get closer to the ‘real’ average. So a study population of 1,200 is less likely to be impacted by outliers than a group of, say, 10.
It’s sort of like flipping a coin: If you do it 10 times, you might get “heads” seven or eight times. Or even 10 in a row. But if you flip it 1,200 times, it’s likely to average out to an even split between heads and tails, which is more accurate.
One caveat: Sample size only matters when you’re comparing similar types of studies. (As you’ll learn later, experimental research provides stronger evidence than observational, but observational studies are almost always larger.)
For similar reasons, it’s also worth noting the duration of the research. Was it a long-term study that followed a group of people for years, or a single one-hour test of exercise capacity using a new supplement?
Sure, that supplement might have made a difference in a one-hour time window, but did it make a difference in the long run?
Longer study durations allow us to test the outcomes that really matter, like fat loss and muscle gain, or whether heart attacks occurred. They also help us better understand the true impact of a treatment.
For example, if you examine a person’s liver enzymes after just 15 days of eating high fat, you might think they should head to the ER. By 30 days, however, their body has compensated, and the enzymes are at normal levels.
So more time means more context, and that makes the findings both more reliable and applicable for real life. But just like studying larger groups, longer studies require extensive resources that often aren’t available.
The bottom line: Small, short-term studies can add to the body of literature and provide insights for future study, but on their own, they’re very limited in what you can take away.
Biases can impact study results.
Scientists can be partial to seeing certain study outcomes. (And so can you, as a reader.)
Research coming out of universities—as opposed to corporations—tends to be less biased, though this isn’t always the case.
Perhaps a researcher worked with or received funding from a company that has a financial interest in their studies’ findings. This is completely acceptable, as long as the researcher acknowledges they have a conflict or potential bias.
But it can also lead to problems. For example, the scientist might feel pressured to conduct the study in a certain way. This isn’t exactly cheating, but it could influence the results.
More commonly, researchers may inadvertently—and sometimes purposefully—skew their study’s results so they appear more significant than they really are.
In both of these cases, you might not be getting the whole story when you look at a scientific paper.
That’s why it’s critical to examine each study in the context of the entire body of evidence. If it differs significantly from the other research on the topic, it’s important to ask why.
Your Ultimate Study Guide
Now you’re ready for the fun part: Reading and analyzing actual studies, using our step-by-step process. Make sure to bookmark this article so you can easily refer to it anytime you’re reading a paper.
Step 1: Decide how strong the evidence is.
To determine how much stock you should put in a study, you can use this handy pyramid called the “hierarchy of evidence.”
Here’s how it works: The higher up on the pyramid a research paper falls, the more trustworthy the information.
For example, you ideally want to first look for a meta-analysis or systematic review—see the top of the pyramid—that deals with your research question. Can’t find one? Then work your way down to randomized controlled trials, and so on.
Study designs that fall toward the bottom of the pyramid aren’t useless, but in order to see the big picture, it’s important to understand how they compare to more vetted forms of research.
Research reviews
These papers are considered very strong evidence because they review and/or analyze a selection of past studies on a given topic. There are two types: meta-analyses and systematic reviews.
In a meta-analysis, researchers use complex statistical methods to combine the findings of several studies. Pooling together studies increases the statistical power, offering a stronger conclusion than any single study. Meta-analyses can also identify patterns among study results, sources of disagreement, and other interesting relationships that a single study can’t provide.
In a systematic review, researchers review and discuss the available studies on a specific question or topic. Typically, they use precise and strict criteria for what’s included.
Both of these approaches look at multiple studies and draw a conclusion.
This is helpful because:
A meta-analysis or systematic review means that a team of researchers has closely scrutinized all studies included. Essentially, the work has already been done for you. Does each individual study make sense? Were the research methods sound? Does their statistical analysis line up? If not, the study will be thrown out.
Looking at a large group of studies together can help put outliers in context. If 25 studies found that consuming fish oil improved brain health, and two found the opposite, a meta-analysis or systematic review would help the reader avoid getting caught up in the two studies that seem to go against the larger body of evidence.
PubMed has made these easy to find: to the left of the search box, just click “customize” and you can search for only reviews and meta-analyses.
Your evidence-based shortcut: The position stand.
If you’re reading a research review and things aren’t adding up for you, or you’re not sure how to apply what you’ve learned to your real-life coaching practice, seek out a position stand on the topic.
Position stands are official statements made by a governing body on topics related to a particular field, like nutrition, exercise physiology, dietetics, or medicine.
They look at the entire body of research and provide practical guidelines that professionals can use with clients or patients.
Here’s an example: The 2017 International Society of Sports Nutrition Position Stand on diets and body composition.
Or, say you have a client who’s older and you’re wondering how to safely increase their training capacity (but don’t want to immerse yourself in a dark hole of research), simply look for the position stand on exercise and older adults.
To find the position stands in your field, consult the website of whatever governing body you belong to. For example, if you’re a personal trainer certified through ACSM, NASM, ACE, or NSCA, consult the respective website for each organization. They should feature position stands on a large variety of topics.
Randomized controlled trials
This is an experimental study design: A specific treatment is given to a group of participants, and the effects are recorded. In some cases, this type of study can prove that a treatment causes a certain effect.
In a randomized controlled trial, or RCT, one group of participants doesn’t get the treatment being tested, but both groups think they’re getting the treatment.
For instance, one half of the participants might take a drug, while the other half gets a placebo.
The groups are chosen randomly, and this helps to counteract the placebo effect—which occurs when someone experiences a benefit simply because they believe it’ll help.
If you’re reading a RCT paper, look for the words “double blind” or the abbreviation “DBRCT” (double blind randomized controlled trial). This is the gold standard of experimental research. It means neither the participants nor researchers know who’s taking the treatment and who’s taking the placebo. They’re both “blind”—so the results are less likely to be skewed.
Observational studies
In an observational study, researchers look at and analyze ongoing or past behavior or information, then draw conclusions about what it could mean.
Observational research shows correlations, which means you can’t take an observational study and say it “proves” anything. But even so, when folks hear about these findings on the popular morning shows, that part’s often missed, which is why you might end up with confused clients.
So what’re these types of studies good for? They can help us make educated guesses about best practices.
Again, one study doesn’t tell us a lot. But if multiple observational studies show similar findings, and there are biological mechanisms that can reasonably explain them, you can be more confident they’ve uncovered a pattern. Like that eating plant foods is probably healthful—or that smoking probably isn’t.
Scientists can also use these studies to generate hypotheses to test in experimental studies.
There are three main types of observational studies:
Cohort studies follow a group of people over a certain period of time. In fact, these studies can track people for years or even decades. Usually, the scientists are looking for a specific factor that might affect a given outcome. For example, researchers start with a group of people who don’t have diabetes, then watch to see which people develop the disease. Then they’ll try to connect the dots, and determine which factors the newly-diagnosed people have in common.
Case control studies compare the histories of two sets of people that are different in some way. For example, the researchers might look at two groups who lost 30 pounds: 1) those who successfully maintained their weight loss over time; 2) those who didn’t. This type of study would suggest a reason why that happened and then analyze data from the participants to see if might be true.
Cross sectional studies use a specific population—say, people with high blood pressure—and look for additional factors they might have in common with each other. This could be medications, lifestyle choices, or other conditions.
Case studies and reports
These are basically stories that are interesting or unusual in some way. For examples, this study reviewed the case of a patient who saw his blood cholesterol levels worsen significantly after adding 1-2 cups of Bulletproof Coffee to his daily diet.
Case studies and reports might provide detail and insight that would be hard to share in a more formal study design, but they’re not considered the most convincing evidence. Instead, they can be used to make more informed decisions and provide ideas about where to go next.
Animal and laboratory studies
These are studies done on non-human subjects—for instance, on pigs, rats, or mice, or on cells in Petri dishes—and can fall anywhere within the hierarchy.
Why are we mentioning them? Mainly, because it’s important to be careful with how much stock you put in the results. While it’s true that much of what we know about human physiology—from thermal regulation to kidney function—is thanks to animal and lab studies, people aren’t mice, or fruit flies, or even our closest relatives, primates.
So animal and cell studies can suggest things about humans, but aren’t always directly applicable.
The main questions you’ll want to answer here are: What type of animal was used? Were the animals used a good model for a human?
For example, pigs are much better models for research on cardiovascular disease and diets compared to mice, because of the size of their coronary arteries and their omnivorous diets. Mice are used for genetic studies, as they’re easier to alter genetically and have shorter reproduction cycles.
Also, context really matters. If an ingredient is shown to cause cancer in an animal study, how much was used, and what’s the human equivalent?
Or, if a chemical is shown to increase protein synthesis in cells grown in a dish, then for how long? Days, hours, minutes? To what degree, and how would that compare to a human eating an ounce of chicken? What other processes might this chemical impact?
Animal and lab studies usually don’t provide solutions and practical takeaways. Instead, they’re an early step in building a case to do experimental research.
The upshot: You need to be careful not to place more importance on these findings than they deserve. And, as always, look at how these small studies fit into the broader picture of what we already know about the topic.
Bonus: Qualitative and mixed-method studies
We haven’t mentioned one research approach that cuts across many study designs: qualitative research, as opposed to quantitative (numeric) research.
Qualitative studies focus on the more intangible elements of what was found, such as what people thought, said, or experienced. They tell us about the human side of things.
So, a qualitative study looking at how people respond to a new fitness tracker might ask them how they feel about it, and gather their answers into themes such as “ease of use” or “likes knowing how many steps taken.”
Qualitative studies are often helpful for exploring ideas and questions that quantitative data raises.
For example, quantitative data might tell us that a certain percentage of people don’t make important health changes even after a serious medical diagnosis.
Qualitative research might find out why, by interviewing people who didn’t make those changes, and seeing if there were consistent themes, such as: “I didn’t get enough info from my doctor” or “I didn’t get support or coaching.”
When a study combines quantitative data with qualitative research, it’s known as a “mixed-methods” study.
Your takeaway: Follow the hierarchy of evidence.
There’s a big difference between a double blind randomized controlled human trial on the efficacy of a weight loss supplement (conducted by an independent lab) and an animal study on that same supplement.
There’s an even bigger difference between a systematic review of studies on whether red meat causes cancer and a case report on the same topic.
When you’re looking at research, keep results in perspective by taking note of how strong the evidence can even be, based on the pyramid above.
Step 2: Read the study critically.
Just because a study was published doesn’t mean it’s flawless. So while you might feel a bit out of your depth when reading a scientific paper, it’s important to remember that the paper’s job is to convince you of its evidence.
And your job when you’re reading a study is to ask the right questions.
Here’s exactly what to look for, section by section.
Journal
High quality studies are published in academic journals, which have names like Journal of Strength and Conditioning Research, not TightBodz Quarterly.
To see if the study you’re reading is published in a reputable journal:
Check the impact factor. While not a perfect system, using a database like Scientific Journal Rankings to look for a journal’s “impact factor” (identified as “SJR” by Scientific Journal Rankings) can provide an important clue about a journal’s reputation. If the impact factor is greater than one, it’s likely to be legit.
Check if the journal is peer-reviewed. Peer-reviewed studies are read critically by other researchers before being published, lending them a higher level of credibility. Most journals state whether they require peer review in their submission requirements, which can generally be found by Googling the name of the journal and the words “submission guidelines.” If a journal doesn’t require peer review, it’s a red flag.
See how long the publisher has been around. Most reputable academic journals are published by companies that have been in business since at least 2012. Publishers that have popped up since then are more likely to be predatory.
Authors
These are the people who conducted the research, and finding out more about their backgrounds can tell you a lot about how credible a study might be.
To learn more about the authors:
Look them up. They should be experts in the field the study deals with. That means they’ve contributed research reviews and possibly textbook chapters on this topic. Even if the study is led by a newer researcher in the field, you should be able to find information about their contributions, credentials, and areas of expertise on their university or lab website.
Check out their affiliations. Just like you want to pay attention to any stated conflicts of interest, it’s smart to be aware if any of the authors make money from companies that have an interest in the study’s findings.
Note: It doesn’t automatically mean a study is bogus if one (or more) of the authors make money from a company in a related industry, but it’s worth noting, especially if there seem to be other problems with the study itself.
Abstract
This is a high-level summary of the research, including the study’s purpose, significant results, and the authors’ conclusions.
To get the most from the abstract, you want to:
Figure out the big question. What were the researchers trying to find out with this study?
Decide if the study is relevant to you. Move on to the later parts of the study only if you find the main question interesting and valuable. Otherwise, there’s no reason to spend time reading it.
Dig deeper. The abstract doesn’t provide context, so in order to understand what was discovered in a study, you need to keep reading.
Introduction
This section provides an overview of what’s already known about a topic and a rationale for why this study needed to be done.
When you read the introduction:
Familiarize yourself with the subject. Most introductions list previous studies and reviews on the study topic. If the references say things that surprise you or don’t seem to line up with what you already know about the body of evidence, get up to speed before moving on. You can do that by either reading the specific studies that are referenced, or reading a comprehensive (and recent) review on the topic.
Look for gaps. Some studies cherry-pick introduction references based on what supports their ideas, so doing research of your own can be revealing.
Methods
You’ll find demographic and study design information in this section.
All studies are supposed to be reproducible. In other words, another researcher following the same protocols would likely get the same results. So this section provides all the details on how you could replicate a study.
In the methodology section, you’ll want to:
Learn about the participants. Knowing who was studied can tell you a bit about how much (or how little) you can apply the study results to you (or your clients). Women may differ from men; older subjects may differ from younger ones; groups may differ by ethnicity, medical conditions may affect the results, and so on.
Take note of the sample size. Now is also a good time to look at how many participants the study included, as that can be an early indicator of how seriously you can take the results, depending on the type of study.
Don’t get bogged down in the details. Unless you work in the field, it’s unlikely that you’ll find value in getting into the nitty-gritty of how the study was performed.
Results
Read this section to find out if the intervention made things better, worse, or… the same.
When reading this section:
Skim it. The results section tends to be dense. Reading the headline of each paragraph can give you a good overview of what happened.
Check out the figures. To get the big picture of what the study found, seek to understand what’s being shown in the graphs, charts, and figures in this section.
Discussion
This is an interpretation of what the results might mean. Key point: It includes the authors’ opinions.
As you read the discussion:
Note any qualifiers. This section is likely to be filled with “maybe,” “suggests,” “supports,” “unclear,” and “more studies need to be done.” That means you can’t cite ideas in this section as fact, even if the authors clearly prefer one interpretation of the results over another. (That said, be careful not to dismiss the interpretation offhand, particularly if the author has been doing this specific research for years or decades.)
Acknowledge the limitations. The discussion also includes information about the limits of how the research can be applied. Diving deep into this section is a great opportunity for you to better understand the weaknesses of the study and why it might not be widely applicable (or applicable to you and/or your clients.)
Conclusions
Here, the authors sum up what their research means, and how it applies to the real world.
To get the most from this section:
Consider reading the conclusions first. Yes—before the intro, methodology, results, or anything else. This helps keep the results of the study in perspective. After all, you don’t want to read more into the outcome of the study than the people who actually did the research, right? Starting with the conclusions can help you avoid getting over-excited about a study’s results—or more convinced of their importance—than the people who conducted it.
Make sure the data support the conclusions. Sometimes, authors make inappropriate conclusions or overgeneralize results, like when a scientist studying fruit flies applies the results to humans, or when researchers suggest that observational study results “prove” something to be true (which as you know from the hierarchy of evidence, isn’t possible). Look for conclusions that don’t seem to add up.
Let’s take a deeper look: Statistical significance
Before researchers start a study, they have a hypothesis that they want to test. Then, they collect and analyze data and draw conclusions.
The concept of statistical significance comes in during the analysis phase of a study.
In academic research, statistical significance, or the likelihood that the study results were generated by chance, is measured by a p-value that can range from 0 to 1 (0 percent chance to 100 percent chance).
The “p” in p-value is probability.
P-values are usually found in the results section.
Put simply, the closer the p-value is to 0, the more likely it is that the results of a study were caused by the treatment or intervention, rather than random fluke.
For example:
Let’s say researchers are testing fat loss supplement X.
Their hypothesis is that taking supplement X results in greater fat loss than not taking it.
The study participants are randomly divided into two groups:
One group takes supplement X.
One group takes a placebo.
At the end of the study, the group that took supplement X, on average, lost more fat. So it would seem that the researchers’ hypothesis is valid.
But there’s a catch: Some people with supplement X lost less weight than those who took the placebo. So does supplement X help with fat loss or not?
This is where statistics and p-values come in. If you look at all the participants and how much fat they lost, you can figure out if it’s likely due to the supplement or just the randomness of the universe.
The most common threshold is a p-value under 0.05 (5 percent), which is considered statistically significant. Numbers over that threshold are not.
This threshold is arbitrary, and some types of analysis have a much lower threshold, such as genome-wide association studies that need a p-value of less than 0.00000001 to be statistically significant.
So if the researchers studying supplement X find that their p-value is 0.04, that means: 1) There’s a very small chance (4 percent) that supplement X has no effect on fat loss, and 2) there’s a 96 percent chance of getting the same results (or greater) if you replicated the study.
A couple of important things to note about p-values:
The smaller the p-value does NOT mean the bigger the impact of supplement X. It just means the effect is consistent and likely ‘real.’
The p-value doesn’t test for how well a study is designed. It just looks at how likely the results are due to chance.
Why are we explaining this in such detail?
Because if you see a study that cites a p-value of higher than 0.05, the results aren’t statistically significant.
That means either 1) the treatment had no effect, or 2) if the study were repeated, the results would be different.
So in the case of supplement X, if the p-value were higher than 0.05, you couldn’t say that supplement X helped with fat loss. This is true even if you can see that, on average, the group taking supplement X lost 10 pounds of fat. (You can learn more here.)
The takeaway: Ask the right questions.
We’re not saying you should read a study critically because researchers are trying to trick you.
But each section of a study can tell you something important about how valid the results are, and how seriously you should take the findings.
If you read a study that concludes green tea speeds up your metabolism, and:
the researchers have never studied green tea or metabolism before;
the researchers are on the board of a green tea manufacturer;
the introduction fails to cite recent meta-analyses and / or reviews on the topic that go against the study’s results;
and the study was performed on mice…
… then you should do some further research before telling people that drinking green tea will spike their metabolism and accelerate fat loss.
This isn’t to say green tea can’t be beneficial for someone trying to lose weight. After all, it’s a generally healthful drink that doesn’t have calories. It’s just a matter of keeping the research-proven benefits in perspective. Be careful not to overblow the perks based on a single study (or even a few suspect ones).
Step 3: Consider your own perspective.
So you’ve read the study and have a solid idea of how convincing it really is.
But beware:
We tend to seek out information we agree with.
Yep, we’re more likely to click on (or go searching for) a study if we think it will align with what we already believe.
This is known as confirmation bias.
And if a study goes against what we believe, well, we might just find ourselves feeling kind of ticked off.
You will bring some biases to the table when you read and interpret a study. All of us do.
But the truth is, not everyone should be drawing conclusions from scientific studies on their own, especially if they’re not an expert in the field. Because again, we’re all a little bit biased.
Once you’ve read a study, use this chart to determine how you should approach interpreting the results.
The takeaway: Be aware of your own point of view.
Rather than pretending you’re “objective” and “logical,” recognize that human brains are inherently biased.
A warning sign of this built-in bias: if you’re feeling especially annoyed or triumphant after reading a study.
Remember, science isn’t about being right or wrong; it’s about getting closer to the truth.
Step 4: Put the conclusions in context.
One single study on its own doesn’t prove anything. Especially if it flies in the face of what we knew before.
(Rarely, by the way, will a study prove anything. Rather, it will add to a pile of probability about something, such as a relationship between Factor X and Outcome Y.)
Look at new research as a very small piece of a very large puzzle, not as stand-alone gospel.
That’s why we emphasize position stands, meta-analyses, and systematic reviews. To some degree, these do the job of providing context for you.
If you read an individual study, you’ll have to do that work on your own.
For each scientific paper you read, consider how it lines up with the rest of the research on a given topic.
The takeaway: Go beyond the single study.
Let’s say a study comes out that says creatine doesn’t help improve power output. The study is high quality, and seems well done.
These results are pretty strange, because most of the research on creatine over the past few decades shows that it does help people boost their athletic performance and power output.
So do you stop taking creatine, one of the most well-researched supplements out there, if your goal is to increase strength and power?
Well, it would be pretty silly to disregard the past 25 years of studies on creatine supplementation just because of one study.
Instead, it probably makes more sense to take this study and set it aside—at least until more high-quality studies replicate a similar result. If that happens, then we might take another look at it.
Getting the most out of scientific research, and potentially applying it to our lives, is more about the sum total than the individual parts.
Science definitely isn’t perfect, but it’s the best we’ve got.
It’s awesome to be inspired by science to experiment with your nutrition, fitness, and overall health routines or to recommend science-based changes to your clients.
But before making any big changes, be sure it’s because it makes sense for you (or your client) personally, not just because it’s the Next Big Thing.
Take notice of how the changes you make affect your body and mind, and when something isn’t working for you (or your client), go with your gut.
Science is an invaluable tool in nutrition coaching, but we’re still learning and building on knowledge as we go along. And sometimes really smart people get it wrong.
Take what you learn from research alone with a grain of salt.
And if you consider yourself an evidence-based coach (or a person who wants to use evidence-based methods to get healthier), remember that personal experiences and preferences matter, too.
If you’re a coach, or you want to be…
Learning how to coach clients, patients, friends, or family members through healthy eating and lifestyle changes—in a way that’s evidence-based and personalized for each individual’s lifestyle and preferences—is both an art and a science.
If you’d like to learn more about both, consider the Precision Nutrition Level 1 Certification. The next group kicks off shortly.
What’s it all about?
The Precision Nutrition Level 1 Certification is the world’s most respected nutrition education program. It gives you the knowledge, systems, and tools you need to really understand how food influences a person’s health and fitness. Plus the ability to turn that knowledge into a thriving coaching practice.
Developed over 15 years, and proven with over 100,000 clients and patients, the Level 1 curriculum stands alone as the authority on the science of nutrition and the art of coaching.
Whether you’re already mid-career, or just starting out, the Level 1 Certification is your springboard to a deeper understanding of nutrition, the authority to coach it, and the ability to turn what you know into results.
[Of course, if you’re already a student or graduate of the Level 1 Certification, check out our Level 2 Certification Master Class. It’s an exclusive, year-long mentorship designed for elite professionals looking to master the art of coaching and be part of the top 1 percent of health and fitness coaches in the world.]
Interested? Add your name to the presale list. You’ll save up to 33% and secure your spot 24 hours before everyone else.
We’ll be opening up spots in our next Precision Nutrition Level 1 Certification on Wednesday, October 2nd, 2019.
If you want to find out more, we’ve set up the following presale list, which gives you two advantages.
Pay less than everyone else. We like to reward people who are eager to boost their credentials and are ready to commit to getting the education they need. So we’re offering a discount of up to 33% off the general price when you sign up for the presale list.
Sign up 24 hours before the general public and increase your chances of getting a spot. We only open the certification program twice per year. Due to high demand, spots in the program are limited and have historically sold out in a matter of hours. But when you sign up for the presale list, we’ll give you the opportunity to register a full 24 hours before anyone else.
If you’re ready for a deeper understanding of nutrition, the authority to coach it, and the ability to turn what you know into results… this is your chance to see what the world’s top professional nutrition coaching system can do for you.
//
References
Click here to view the information sources referenced in this article.
Biau, D.J., Jolles, B.M. & Porcher, R. (2010). P Value and the Theory of Hypothesis Testing: An Explanation for New Researchers. Clinical Orthopaedics and Related Research, 468 (3), 885-892.
Head, M. L., Holman, L., Lanfear, R., Kahn, A. T., & Jennions, M. D. (2015). The extent and consequences of p-hacking in science. PLoS Biology, 13(3), e1002106.
Ehrlinger, J., Johnson, K., Banner, M., Dunning, D., & Kruger, J. (2008). Why the Unskilled Are Unaware: Further Explorations of (Absent) Self-Insight Among the Incompetent. Organizational Behavior and Human Decision Processes, 105(1), 98–121.
Greenhalgh, T. (1997a). Assessing the methodological quality of published papers. BMJ , 315(7103), 305–308.
Greenhalgh, T. (1997b). How to read a paper. Getting your bearings (deciding what the paper is about). BMJ , 315(7102), 243–246.
Greenhalgh, T. (1997c). How to read a paper. Papers that report drug trials. BMJ , 315(7106), 480–483.
Greenhalgh, T. (1997d). How to read a paper. Statistics for the non-statistician. I: Different types of data need different statistical tests. BMJ , 315(7104), 364–366.
Greenhalgh, T. (1997e). How to read a paper. Statistics for the non-statistician. II: “Significant” relations and their pitfalls. BMJ , 315(7105), 422–425.
Greenhalgh, T. (1997f). Papers that summarise other papers (systematic reviews and meta-analyses). BMJ , 315(7109), 672–675.
Greenhalgh, T., & Taylor, R. (1997). Papers that go beyond numbers (qualitative research). BMJ , 315(7110), 740–743.
Kruger, J., & Dunning, D. (1999). Unskilled and unaware of it: how difficulties in recognizing one’s own incompetence lead to inflated self-assessments. Journal of Personality and Social Psychology, 77(6), 1121–1134.
Institute of Medicine (US) Roundtable on Environmental Health Sciences, Research, and Medicine. (2011). Environmental Health Sciences Decision Making: Risk Management, Evidence, and Ethics – Workshop Summary. Washington (DC): National Academies Press (US). 21-24.
Pain, E. (2016, March 21) How to (seriously) read a scientific paper. Retrieved from http://bit.ly/2SlLv9X
Purugganan, M., & Hewitt, J. (2004) How to Read a Scientific Article. Retrieved from http://bit.ly/2VJuT0K.
Sever, P.S., Dahlöf, B., Poulter, N.R., Wedel, H., Beevers, G., Caulfield, M., …Rory Collins, McInnes, G.T., et al. (2003). Prevention of coronary and stroke events with atorvastatin in hypertensive patients who have average or lower-than-average cholesterol concentrations, in the Anglo-Scandinavian Cardiac Outcomes Trial—Lipid Lowering Arm (ASCOT-LLA): a multicentre randomised controlled trial. Lancet. 361(9364), 1149–1158.
Sullivan, G. M., & Feinn, R. (2012). Using Effect Size-or Why the P Value Is Not Enough. Journal of graduate medical education, 4(3), 279–282.
Toklu, Bora et al. (2015). Rise in Serum Lipids After Dietary Incorporation of “Bulletproof Coffee.” Journal of Clinical Lipidology. 9 (3), 462.
Wasserstein, R.L., & Lazar, N .A. (2016). The ASA’s Statement on p-Values: Context, Process, and Purpose, The American Statistician, 70 (2), 129-133.
The post What’s that study REALLY say? How to decode research, according to science nerds. appeared first on Precision Nutrition.
from Blog – Precision Nutrition http://bit.ly/2LoE4zs via IFTTT http://bit.ly/2J1nWSE
0 notes
Photo

In this post our Director of Data Science and Analytics, Dora Moldovan takes a look at the use of Search in the retail sector and examines what role it should play in addressing the challenges faced in 2019 and beyond. CHALLENGES IN THE RETAIL ENVIRONMENT. Consumer confidence has slumped to a five-year low due to external pressures impacting purchase decisions. This is creating a less buoyant retail market, particularly online, with retailers having to work harder and invest heavily to retain market share. Extreme discounting and promotions are ubiquitous, encouraging the race to the bottom pricing. Although the clothing portion of the market is in a period of growth, the challenges are significant due to the tactics of pure play retailers, aggressive with both spend and promotions. We’re seeing digital becoming the bulk source of growth in retail with omnichannel businesses reducing bricks-and-mortar operations, while most pure-play retailers are expected to open retail experience shops on the high-street by 2023. To capitalise on less competition but more-aggressive auction prices, Found believes retailers should make full use of data-driven technology. Tools such as Adthena or Hitwise, interpreting data from the Office for National Statistics or Google market information will enable them to spot opportunities for growth quickly. The example below is the home market trend with data pulled from ONS to demonstrate retail demand for the home sector: Food and Non-Food will have very different market positions throughout the year and any search performance will need to be tailored towards these changing markets. Supporting this is the BRC report for retail showing that, in December, like-for-like retail sales were down – 0.7%, but the three-month average for Non-Food showed a +7.0% growth. Footfall was down – 2.6% in the same period, with retailers struggling to convert customers to store. The result is an increased propensity for retailers to invest more online. Leveraging audience data and the increased localisation of Search will be the main areas of focus in 2019. Retailers who successfully optimise towards offline metrics are set to win in 2019/2020. With customer search journeys taking longer, there is an inherent need to understand and optimise throughout the journey. This, combined with 67% of clothing searches coming from mobile, demonstrates the need to continue with mobile first strategies. The landscape is changing not just in the context of competition, but also in the way the retailers are leveraging technology. Amazon’s move to acquire Whole Foods and the completely frictionless checkouts via Amazon Go stores, have granted access not just to new audiences but also to a wealth of data on in-store behaviour to integrate into their strategies. In many cases where Amazon Prime Now is active, this has broken down the buying objections of shopping online by providing almost-instant delivery services at low cost. With the ongoing Brexit negotiations, we note the letter of warning from the British Retail Consortium to Parliament signed by several of the major food retailers, regarding the impossibility of stockpiling fresh food, empty shelves and higher prices. It’s becoming ever-clear that the UK is very reliant on the EU for produce. MARKET CHANGE: 2019/20. Experiential commerce is becoming a driving force in delivering increased sales for brands and retailers. Consumers’ interest in online shopping is shifting from a formulaic, convenience type interaction to immersive, brand loyalty building experiences. Personalisation is still a significant player. The ability to create unique experiences for audiences is highly valuable and brands are taking advantage of the technology to engage with customers more than ever before. This is being seen through the emergence of pure-play retailers’ in-store formats, creating experiential shopping formats. The demand for delivery is making this a priority for retailers. With same-day delivery becoming the stake for grocers in competitive markets, we’re expecting to see even more investment in technology around driverless, autonomous delivery. Environmental awareness was a major trend in 2018 and we’re expecting interest in sustainability and concern in consumer behaviour’s impact on the environment to shape the retail space even further in 2019. UNDERTAKING SEARCH DIFFERENTLY IN 2019/20 VS 2018/19. Retailers are going to need to ensure that every pound is spent in line with business goals; whether that be new customer acquisition, customer retention, sales growth or profit. Data-driven strategies that focus around audiences will allow these goals, in line with profit margin by product, to be achieved more effectively. As the overall market is consolidating, retailers are in a constant battle to ‘own’ the SERPS. Maintaining or growing market share becomes more competitive. THE IMPORTANCE OF LOCAL SEARCH. With technology making instant gratification and impulsive actions very easy to perform, Google has reported a huge increase in growth for all searches related to “near me” in recent years. Consumers now expect Search technology to find the places and even specific items they want to purchase in their area so they can get what they want instantly. Source: Think with Google With that in mind, standing out in a Local Search pack to appear in traditional and Local Search or get picked up by voice assistants has become increasingly important part of the local and voice strategy. Whilst we can’t impact the consumers’ proximity to the business, we can optimise to influence the other factors such as prominence and relevance, ensuring that: GMB (Google My Business) properties are optimised and contain up-to-date information. NAP (Name, Address, Phone Number) data is accurate and truthful. Listings have positive reviews – this is becoming more important than ever. THE IMPORTANCE OF ASO (App store optimisation). The online grocery market is extremely competitive, with users not only searching through traditional search engines but also using downloaded apps to complete purchases. Frequently a store’s app may provide a better user experience and help keep consumers loyal to that brand, so being present and front of mind when downloading apps must be part of any integrated strategy. ASO can help you: Capture 100% of consumers’ attention on a branded search. Engage with a higher lifetime value customer by them obtaining the app and having a better user experience and push notifications for re-engagement. Appear in competitor searches to attract them to your brand. To gain greater positions in the app store results, an ASO strategy is required to cover keyword research, on-site optimisations and off-site signals. This includes: Choosing the right keywords for the app. Optimising titles and descriptions in line with selected target terms. Taking advantage of the screenshots so your customers know how to use it. Adding videos to provide even more detailed information about the app. Having a strategy in place to gain positive reviews and external signals to the app. THE IMPORTANCE OF VOICE SEARCH. As voice technology is maturing and becoming much more reliable, people are more comfortable using it for purchases, which is reducing the need to visit stores in person. This is especially significant both for FMCG brands and traditional retailers. Consumer demand for increased convenience in groceries is an obvious driver to start optimising for voice search. To cater for voice search, brands need to be set up to deliver multiple varieties of relevant and quality content. For grocery brands specifically, there is a great potential to influence consumer at the discovery stage of the user journey. Voice searches differ to normal search as they: Contain a higher average number of words per search. Contain ‘trigger words’ such as ‘how’, ‘why’, ‘where’. More frequently are sequential, in the form of a conversation with the voice assistant. Can be tracked less easily than a standard search. With Google yet to separate voice queries within its search console, retailers need to rely on cues to identify the types of searches that could be performed by voice. Statistics around voice search, and its importance, range from predicting it will take over 25- 50% of searches. Whilst this is a hotly debated topic, what’s clear is that voice search will hold at least some place within the market. In the case of FMCG, where billions of pounds are traded online daily, the role of voice search will not be insignificant. THE IMPORTANCE OF OMNICHANNEL. Marketing is a team effort. To win, every element of your strategy, including your Search, should work hand-in-hand and build upon each other’s strengths to power your business. In order to understand this concerted effort and the role each channel (digital or offline) is playing, the right attribution tech is essential. Complementing the tech with omnichannel data science analysis will help retailers paint the full picture as accurately as possible. THE IMPORTANCE OF TECHNOLOGY IN AUDIENCE. We know that your most complete set of data is your CRM data, and Search can use this as a powerful lever to turn new customers into brand-loyal, lifelong customers. Machine learning has sparked a new wave of interest in the application of RFM (recency/frequency modelling) analysis to deliver insights to Search, especially SEO targeting. We slice data to understand customer flow and acquisition in ecommerce as it: Links online and offline order data. Creates real-time audiences that can be utilised in Search to fine-tune strategy. Enables the assistive side of Search through AI-powered insights. By using machine learning to monitor online conversation about products/brand and to map user behaviour, brands can uncover patterns and trends that can be reflected in search strategies. HOW SEARCH CAN PLAY A ROLE IN ADDRESSING THE CHALLENGES FOR RETAIL. Search can be a significant tool in any retailers kit to overcome the many challenges ahead. We believe they need to embrace the following within their Search strategies: Understand the changing needs of consumers and their search behaviours. As consumers demand more choice in-store, they expect even more when shopping online. Search needs to utilise a long-tail strategy to capture niche requirements and understand consumer shopping trends. Embrace automation. Automated creatives and automated bidding will allow agency partners to work strategically towards business-aligned KPIs (RoAS, CPA), creating efficiencies. Leave behind the silo approach and move towards an omnichannel/localisation strategy. The confluence of online and offline activity is essential to provide the kind of personalisation consumers expect. 80% of consumers still go in-store for items they want immediately but Search activity, especially on mobile, is a significant part of this journey. Plan for the future by having a clear strategy around voice search and hyper-localisation. EMBRACING EMERGING PLATFORMS & TECHNOLOGIES. In order to take advantage of the full potential Search has to offer we believe retailers should be looking to inform their campaigns and benefit from: Applications of technologies that link store data with online data and explore the causality of relationship between them. Analysis that furthers the understanding of customer behaviour. An advanced AI-powered, custom-trained attribution model to help the marketing department understand the relationship between online/offline, new/loyal customers and marketing channels that best influence and convert them. Search will remain a powerful growth channel for retailers and it can go a long way to assisting them in overcoming the current challenges in the sector, providing they embrace the changes that they need to allow Search to be successful. Retailers who continue to operate their Search campaigns in the same way the have done in previous years will lose out to those embracing the changes and integrating search with their wider activity in-store and online. It’s time for retailers to integrate Search, rethink their strategies and make sure that their Search campaigns are using all the cutting edge tactics available to them. The post How can Search address the challenges facing retail in 2019? appeared first on FOUND.
0 notes
Text
Measurement Matters: 3 Data Analytics Lessons to Remember
Although I’ve spent my entire career in marketing and communications, measurement has never been far away. I’m not a natural-born statistics nerd. But these days, it’s hard for any of us to avoid analytics, no matter what we do for a living.
Since the start of the digital age, we’ve all been swimming in business data. Yet many of us still don’t take the time to use it in meaningful ways. Some of us avoid data analytics because it involves so many moving parts:
Valid and reliable methods
Robust tools
High-quality data
Appropriate benchmarks
And of course, relevant underlying logic.
It’s true, these elements aren’t always easy to align. But would you really rather fly blind? Imagine how much more you could achieve by investing some time and effort to put metrics on your side.
Even before data-based measurement became widespread, I saw its value at work in dozens of different business scenarios. Here are three of the most memorable examples:
Lesson 1: Find Your “North Star” Metric
Great data analytics tools are plentiful today. All those interesting apps and widgets may tempt you to spread your measurement efforts too thin. But just because you can track many metrics doesn’t mean you should.
It reminds me of the 1990s dude ranch comedy film “City Slickers,” when Billy Crystal’s middle-aged character, Mitch, shares a serious moment with a grizzled cowboy named Curly, played by Jack Palance:
CURLY: “Do you know what the secret of life is? One thing. Just one thing… MITCH: “Great. But what is the one thing? CURLY: “That’s what you’ve got to figure out.”

RSVP FOR THE APRIL WEBINAR NOW!
Curly’s little nugget of wisdom is as useful in analytics as it is in life. Every organization has its own special sauce. If you know what sets you apart, you can quantify it. Isolating the one metric that matters most to your organization may not be easy. But it can make all the difference – not just for near-term performance, but for long-term success.
I learned this while working my way through college as a waitress at an upscale restaurant in Seattle. The place was so popular that people would wait an hour or more for a table. By the time most customers were seated, they were beyond hungry. That meant delivering a superior dining experience was essential. But how do you quantify quality?
The owners decided to keep customers coming back for more by uniting employees around one deceptively simple objective – hot food. In other words, success meant cooking every meal to perfection and serving it piping hot. Each of us worked toward performance metrics tied to that central objective.
As a waitress, my goal was to serve at least 90% of meals within 2 minutes of plating. Others had similar goals. With heightened awareness of the company’s mission, all employees became obsessed with hot food. Our behavior rapidly changed, and the culture soon followed.
Hot food may seem like an obvious success factor for any restaurant. But the right choice wasn’t as easy as it seems. In this case, the “north star” metric emerged only after a series of long and intense brainstorming sessions with customers, employees and business partners. It also required trial and error. But It was worth the effort.
Eventually, that metric became a beacon for every employee, and the organization became one of the Pacific Northwest’s most successful and storied fine dining establishments.
Lesson 2: Measurement is a Nonstop Endeavor
Not so long ago, the road to business intelligence was tedious and expensive. Analysts measured performance by comparing static “before and after” snapshots on a weekly, monthly or quarterly basis. Data was compiled in batches that often took days to process before reports could be developed and distributed. The complexity and cost of real-time reporting put it far out-of-reach for all but the largest and wealthiest organizations.
I’ve faced this challenge several times in my career – even as recently as 10 years ago on the data analytics team at one of the world’s leading web services companies. With big-ticket advertising budgets on the line, we knew that faster insights could dramatically improve campaign results for the brands we served.
Of course, other digital economy players recognized the same opportunity. They, too, inched their way forward, compressing reporting turnaround times as quickly as their budgets and capabilities would allow. Suddenly, speed had become a driving force, as companies everywhere sought a competitive advantage by accelerating time-to-insight.

REPLAY THE WEBINAR NOW!
No more. Now data is dynamic, plentiful and relatively cheap. It has become the fuel that drives remarkably sophisticated, easy-to-use online reporting tools that are also relatively cheap. (Free Google Analytics, anyone?) In fact, with nearly instant data so widely available at such a low cost, it seems that yesterday’s time-to-insight advantage has nearly evaporated.
So, where should you look to find a competitive advantage now? Ask anyone who treats analytics like breathing. Today, value comes from managing measurement as a continuous improvement process. The smartest companies proactively test, analyze, discover, improve and optimize. And that requires more than insights, alone. Which leads to my next lesson…
Lesson 3: Analysis Without Action Is Pointless
Developing relevant KPIs (key performance indicators) is one thing. Putting them into practice is another. Data-based insights are useful only if you’re willing to act on what you uncover.
With so many analytics tools available today, organizations can become so focused on gathering data, perfecting metrics and generating reports that they lose sight of why they wanted the information in the first place. Developing a dashboard is relatively easy. Letting a dashboard guide your business decisions and behavior is much harder – especially when data tells a story you don’t want to hear.
I learned this the hard way a few years ago, while generating monthly marketing performance reports for a learning solutions provider. By combining data from multiple sources, we defined a handful of meaningful metrics. For each metric, we established benchmarks based on 12-month rolling averages for the previous year.
This became the foundation for a simple KPI dashboard that was timely, relevant and easy to digest. It was exactly what executives had requested. But I didn’t stop there. Each month, I wrote a companion analysis that interpreted the latest findings, explored the implications of those findings and suggested a course of action.
How did business leaders respond? Crickets. Their silence was deafening.
The problem wasn’t data overload. It wasn’t about analysis paralysis. It wasn’t even a “set-it-and-forget-it” mindset. It was something that data alone couldn’t fix. Leaders thought they wanted to track marketing program impact. But when results were difficult to digest, they chose to ignore troubling indicators instead of finding ways to improve.
Perhaps executives expected only “feel good” results. Or maybe middle managers sanitized negative data points and trend lines, so executives wouldn’t kill the messenger. But selective truth doesn’t change reality. And in this case, it didn’t lead to better business outcomes.
So perhaps the most important lesson of all is the hardest lesson to accept. Insight is only half of the measurement battle. Unless your organization is willing to face tough facts, you will never be able to move the meter in the right direction. You may not be doomed. But if you choose to do nothing, you are likely to keep stumbling through the wilderness.
Closing Notes
Business data can tell deeply powerful stories through analytics. Sometimes data will shout right out loud. Other times, it speaks only through a quiet whisper, a fleeting pause or a subtle shift in direction. But even in those tiny signals, data can speak volumes.
So tell me, what are you doing to give your data a useful voice? How closely are you listening to its message about your organization’s performance? And how do you respond?
If you have an analytics lesson to share, feel free to tell me about it at [email protected].
Want to Learn More? Attend our Live Webinar April 10th
Bridging the Learning Analytics Gap: How Guided Insights Lead to Better Results
RSVP NOW!
Even with cutting-edge measurement tools, many struggle to find enough time and expertise to generate useful learning insights. How can you bridge this critical analytics gap?
Join John Leh, CEO and Lead Analyst at Talented Learning, and Tamer Ali, Co-Founder and Director at Authentic Learning Labs. You’ll discover:
Top learning analytics challenges
How AI-driven data visualization tools are transforming learning insights
How to define and interpret relevant metrics
Practical examples of AI-based analytics in action
How to build a convincing case for guided analytics
NOTE: Attendees at the live webinar qualify for 1 CAE credit. ALSO: Even if you miss the live event, we’ll send you a link to the recording.
REGISTER NOW!
Need Proven LMS Selection Guidance?
Looking for a learning platform that truly fits your organization’s needs? We’re here to help! Submit the form below to schedule a free preliminary consultation at your convenience.
First Name*
Last Name*
Email Address*
Company
jQuery(document).bind('gform_post_render', function(event, formId, currentPage){if(formId == 18) {} } );jQuery(document).bind('gform_post_conditional_logic', function(event, formId, fields, isInit){} ); jQuery(document).ready(function(){jQuery(document).trigger('gform_post_render', [18, 1]) } );
The post Measurement Matters: 3 Data Analytics Lessons to Remember appeared first on Talented Learning.
Measurement Matters: 3 Data Analytics Lessons to Remember original post at Talented Learning
0 notes