#graph seaborn datascience
Explore tagged Tumblr posts
Visit Tumblr Blog
Explore Tumblr blogs with no restrictions, modern design and the best experience.
Last Seen Tumblr Blogs


Fun Fact
Tumblr Inc. has $15.1M in annual revenue.
Text
How to Become a Data Scientist as a CSE Student?
If you’re a CSE (Computer Science and Engineering) student, chances are you’ve already heard the term data science quite a few times. It’s one of the fastest-growing career fields in tech—and for good reason. Companies across the world rely on data to make decisions, and they need skilled people who can make sense of all that information.
So, how do you become a data scientist when you’re still a student? Let’s break it down step by step.
Understand What a Data Scientist Really Does
A data scientist is someone who collects, cleans, and analyzes large amounts of data to help businesses or organizations make smarter decisions. This can involve writing code, using math, working with databases, and communicating findings clearly.
It’s not just about writing programs—it’s also about thinking critically and solving real-world problems with the help of data.
Step 1: Get Your Basics Right
As a CSE student, you already have a head start. Your curriculum likely includes core subjects like programming, algorithms, databases, and computer networks. Pay close attention to:
Python or R (Python is more widely used in data science)
SQL for handling data in databases
Math and Statistics, especially probability, linear algebra, and basic statistics
Data Structures and Algorithms for handling data efficiently
These skills form the foundation of data science work.
Step 2: Learn Data Science Tools and Libraries
Once you’re comfortable with basic programming and math, it’s time to explore tools used by data scientists. You don’t need to master everything at once—start small.
NumPy and Pandas (for handling and analyzing data)
Matplotlib and Seaborn (for creating charts and graphs)
Scikit-learn (for machine learning models)
Jupyter Notebooks (for writing and sharing your code easily)
Plenty of free tutorials and YouTube videos can help you practice these.
Step 3: Take Online Courses and Certifications
While your college of engineering and technology in Bhubaneswar may offer some electives or workshops, adding extra courses can boost your learning. Platforms like Coursera, edX, Udemy, and Kaggle offer beginner-friendly courses in data science and machine learning.
Look for beginner tracks with practical projects. Try courses like:
"Introduction to Data Science in Python"
"Machine Learning" by Andrew Ng
"Python for Data Science and AI" by IBM
These certifications can also strengthen your resume later on.
Step 4: Work on Real Projects
Theory is important, but nothing beats hands-on experience. Try simple projects first:
Analyze sales or weather data
Build a movie recommendation system
Predict house prices using public datasets
Visualize COVID-19 data trends
You can find datasets on sites like Kaggle, UCI Machine Learning Repository, or Google Dataset Search. Try to write a short blog post or upload your project to GitHub so others can see your work.
Step 5: Join Internships and Communities
Real-world experience can help you build both skills and confidence. Look for internships related to data analysis, data science, or even software roles that deal with data.
Also, join online communities like:
Kaggle (for competitions and discussions)
Reddit’s r/datascience
LinkedIn groups focused on analytics
Discord or Telegram groups for peer learning
You’ll learn a lot from seeing what others are doing and sharing your progress too.
Step 6: Build a Portfolio
Before applying for full-time jobs, put together a portfolio. This can include:
2–3 well-documented projects
A GitHub profile with clean code
A short resume highlighting your tools and skills
A LinkedIn profile that reflects your interests in data science
If you're studying at a college of engineering and technology in Bhubaneswar, consider joining tech fests, project expos, or coding clubs that give you space to present your work.
Conclusions
Becoming a data scientist as a CSE student doesn’t require fancy degrees or expensive tools. What you do need is consistency, curiosity, and a clear plan. Start with your basics, explore tools, build small projects, and grow step by step.
The field of data science is full of opportunities—and your classroom is just the beginning.
#top 5 engineering colleges in bhubaneswar#top engineering colleges in odisha#bhubaneswar b tech colleges#college of engineering and technology bhubaneswar#best colleges in bhubaneswar#college of engineering bhubaneswar
0 notes
Text
Deconstructing Data Roles: Scientist, Analyst, and Researcher
Professionals with the ability to infer inferences from data are in great demand in the big data era. However, technical terms employed in data-related fields might lead to miscommunications.Using knowledge from Pune's Best DataScience Course, let's investigate the primary reasons behind people's fascination with data science.

Data Researcher An explorer in the vast realm of data is what a researcher is like. Their primary duty is to collect and organize data from various sources. Think of them as information gatherers who look through datasets, databases, and other sources to find relevant content.
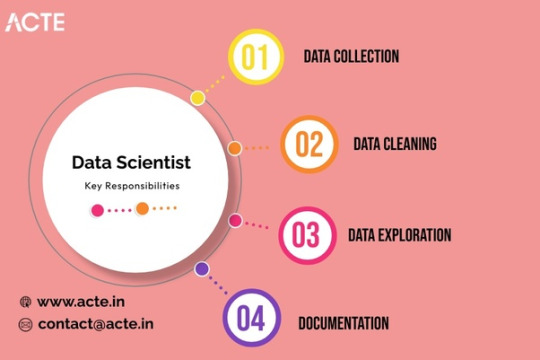
Primary Responsibility
1. Data Collection: They look through a range of sources, such as websites, surveys, research papers, and databases, to obtain raw data. 2. Data Cleaning: Raw data, which is often chaotic, must be cleaned and structured before analysis can begin. Data researchers are in charge of this initial cleanup. 3. Data exploration: Prior to diving into in-depth analysis, they conduct preliminary research to understand the structure, patterns, and potential insights within the data. 4. Documentation: Keeping thorough records of the procedures and data sources
Data Analyst:
Once the data has been gathered and cleaned up, the data analyst ought to take over. Data analysts go through data to identify important trends, patterns, and insights, much like detectives do. Because they provide certificates and job placement options, I heartily recommend the Datascience Online Training if you're interested in learning more about data science. These services are available both offline and online.
Primary Responsibility
1. Data Interpretation: Data analysts use statistical techniques and visualization tools to identify trends and glean insights from data. 2. Report Generation: Often with the aid of tables, graphs, and charts, they compile their findings into concise and understandable reports and dashboards. 3. Visualization: When complicated information is presented visually, stakeholders can understand it more easily. Data analysts are adept at visualizing data using tools like Tableau, Power BI, and Python libraries like Matplotlib and Seaborn. 4. Data-oriented Suggestions: Based on their research, data analysts make recommendations.
Data Scientist:
The wizards of the data realm are data scientists. They can tackle complex problems because they have a special combination of subject knowledge, statistical experience, and programming skills.
Primary Responsibility
1. Advanced Analytics: Data scientists use state-of-the-art statistical techniques and machine learning algorithms to extract patterns and forecasts from data.
2. Model Development: They build and enhance predictive models to solve specific business problems such as demand forecasting or customer churn prediction. 3. Algorithm Implementation: Data scientists write code to implement models and algorithms using Python or R, among other computer languages. 4. Cross-functional Collaboration: Data scientists work closely with stakeholders from all departments to understand business objectives and align data-driven solutions with organizational goals.
0 notes
Text
Starting Your Data Science Adventure: Beginner-Friendly Tips and Resources
In today's data-driven world, Python programming has emerged as a powerhouse for data science. If you're curious about diving into this exciting field, you're in the right place! Whether you're a complete beginner or have some programming experience, this guide will equip you with the essential tips and resources to start your data science adventure with Python.
1. Why Python for Data Science?
Python has become a go-to language for data science due to its simplicity and versatility. It offers a wide range of libraries and frameworks tailored for data analysis, visualization, and machine learning. Plus, its readability makes it a favorite among beginners and seasoned professionals alike.
2. Getting Started with Python
If you're new to Python, don't worry! Getting started is easier than you might think. Begin by installing Python on your computer. You can download it for free from the official Python website (python.org). Choose the latest stable version, and follow the installation instructions for your operating system.
3. Understanding Python Basics
Before delving into data science, familiarize yourself with Python's basic syntax and principles. Online platforms like Codecademy and Coursera offer free introductory Python courses. These courses cover fundamental topics such as variables, data types, loops, and functions. Remember, a solid foundation in Python will serve as a strong pillar for your data science journey.
4. Exploring Data Science Libraries
One of Python's strengths lies in its vast array of libraries designed for data science. Three essential libraries you'll encounter frequently are:
NumPy: For numerical computing and handling arrays.
Pandas: Ideal for data manipulation and analysis, especially with tabular data.
Matplotlib & Seaborn: These libraries excel in data visualization, helping you create insightful plots and graphs.
5. Hands-On Projects
The best way to learn is by doing! Start with small data science projects to apply your Python skills. For instance, you could:
Analyze a dataset of your favorite movies, exploring trends and ratings.
Predict housing prices using a dataset from platforms like Kaggle.
Classify images of handwritten digits using machine learning algorithms.
6. Online Courses and Tutorials
Numerous online resources offer comprehensive data science courses with a focus on Python. Websites like Udemy, DataCamp, and edX host courses ranging from beginner to advanced levels. These courses often include video lectures, coding exercises, and real-world projects to reinforce your learning.
7. Joining Data Science Communities
Immerse yourself in the vibrant data science community! Platforms like Stack Overflow and Reddit's r/datascience are excellent places to ask questions, seek advice, and connect with fellow learners and professionals. Participating in discussions and reading others' experiences can provide valuable insights and motivation.
8. Books for Data Science with Python
Books are timeless resources for learning. Consider adding these titles to your reading list:
"Python for Data Analysis" by Wes McKinney: A comprehensive guide to using Python for data manipulation and analysis with Pandas.
"Hands-On Machine Learning with Scikit-Learn, Keras, and TensorFlow" by Aurélien Géron: Dive into practical machine learning with Python's popular libraries.
9. Practice, Patience, and Perseverance
Data science, like any skill, requires practice and patience. Don't be discouraged by challenges; instead, view them as opportunities to learn and grow. Dedicate time each day to coding and exploring new concepts. Celebrate your progress, no matter how small, and stay curious about the vast possibilities of Python in data science.
Conclusion
Embarking on a data science journey with Python is an exciting and rewarding endeavor. By following these beginner-friendly tips and leveraging the abundant resources available, you'll build a solid foundation for your exploration of data analysis, machine learning, and beyond. Remember, the key ingredients for success are curiosity, persistence, and a willingness to learn. Happy coding!
0 notes
Text
Navigating the Data Science Learning Curve: A Beginner's Unveiling of Secrets
Embarking on the data science learning journey as a beginner might seem daunting, but fret not! With the right approach and resources, you can delve into this exciting field and unlock a world of insights. This blog will outline the optimal way to learn data science in straightforward terms, guiding you through essential steps. Enhancing your career at the Data Science Course in Coimbatore entails taking a systematic strategy and looking into enrolling in a suitable course that will greatly expand your learning journey while harmonizing with your preferences.

BEST WAYS TO LEARN DATA SCIENCE
Step 1: Establish a Strong Foundation in Mathematics and Statistics:
Before venturing into data science, it's crucial to have a robust foundation in basic mathematics and statistics. Concepts like algebra, probability, and descriptive statistics will accompany you throughout this journey.
Step 2: Master the Fundamentals of Programming:
Data science heavily relies on programming, with Python being the preferred language for many. Understanding coding syntax and logic is a key skill that will empower you in handling data efficiently. For individuals eager to excel in Data Science, exploring Data Science Online Training is highly recommended. Look for classes that align with your preferred programming language and learning approach.
Step 3: Engage in Hands-On Data Exploration:
The essence of data science lies in working with data. Initiate your hands-on experience by exploring datasets on platforms like Kaggle. Kaggle provides a collaborative environment where you can access datasets, participate in competitions, and learn from others. This practical exposure will help you grasp the intricacies of manipulating, cleaning, and analyzing data.
Step 4: Learn the Art of Data Visualization:
Data visualization is crucial for presenting data in a visually appealing and understandable way. Tools like Matplotlib and Seaborn in Python can assist in creating insightful visualizations. Understanding how to communicate your findings through graphs and charts is essential for conveying the story behind the data.
Step 5: Dive into the World of Machine Learning:
Machine learning is a core component of data science, enabling you to build predictive models and uncover patterns within data. Begin with introductory courses on platforms like Coursera (Andrew Ng's Machine Learning course is highly recommended) or explore resources like the "Introduction to Machine Learning with Python" book by Andreas C. Müller and Sarah Guido.
Step 6: Immerse Yourself in Data Science Communities:
Connect with the vibrant data science community online. Platforms such as Stack Overflow, Reddit (visit the r/datascience subreddit), and LinkedIn groups serve as excellent places to ask questions, share insights, and learn from experienced professionals.
Step 7: Pursue Specializations:
As you progress, consider specializing in areas aligned with your interests and career goals. Whether it's natural language processing, computer vision, or deep learning, numerous avenues within data science await exploration.

Embarking on the data science learning journey as a beginner is both exciting and rewarding. By establishing a solid foundation in mathematics, mastering programming, engaging in hands-on data exploration, and continuously expanding your knowledge, you'll be well on your way to becoming a proficient data scientist. Remember, persistence and curiosity are your best companions in this ever-evolving field. Happy learning!
If you want to gain knowledge in data science, then you should contact Data Science training in Coimbatore. Experienced teachers can help you learn better. To live life to the fullest and improve your learning process, they provide certification programs and opportunities for job placement overseen by knowledgeable teachers. You can get these resources in person or online. Taking a step-by-step approach and thinking about enrolling in a course could be helpful, if it fits with your interests.
#data science#data science certification#data science course#data science training#data scientist#data science online course
0 notes
Text
DESTINATION : Line Plot
ROUTE : Line plots are commonly used to plot relationships between two numeric lists of values. A line plot, as the name suggests, draws a line that shows positive or negative trends for the data on the y-axis, with respect to an increase or decrease in values on the x-axis. For instance, a line plot can be used to plot monthly or yearly stock prices and the temperature changes over a certain period.
Line Plot with Real World Dataset - Let’s now see how we can draw line plots with the Seaborn library using a real world dataset. We will use the tips dataset to draw line plots. The tips dataset contains records of bills paid by different customers at a restaurant. The dataset comes built-in with the Seaborn library. The following script imports the tips dataset and displays the header of the dataset.
dataset = sns.load_dataset("tips") dataset.head()
Output:

You can see that the dataset contains six columns. Let’s now plot a line plot that shows a relationship between the size(number of people) of the group, and the total bill paid.
sns.lineplot(x='size',y='total_bill', data=dataset, ci= None)
Note : ci is confidence interval. The semi-transparent region around the line in a seaborn line plot shows the confidence interval. By default, seaborn line plots show confidence intervals for the dataset. You can remove the confidence interval by setting the ci parameter of the lineplot() function to None
Output:

0 notes
Text
There is no denying the predominance of Data Analytics, and it has now become a prerequisite for every business's success.
In light of this, the GDSC introduces you to the world of data through the series of Tensorflow workshops.
You'll learn how to use in-demand libraries like Matplotlib and Seaborn to analyze, visualize, and present data in Python. Other data analytics tools, such as Tableau and PowerBI, will also be discussed.
So join us as we delve into the realm of data!
🕘 Tuesday, November 30, 2021 from 2:00 PM – 3:00 PM GMT+0500.
Venue: Lab 3 (Main Campus - FAST NUCES, Karachi)
Register here: https://tinyurl.com/GDSCTF02
Stream the session live at: https://meet.google.com/awn-ifrf-rqo
#TensorFlow #dataanlytics #dataanalysis #datascience #python #pythonprogramming #Datavisualization #visualization #matplotlib #seaborn #PowerBI #matplotlibpyplot #graphs #dataviz #datatraining #TableauTraining #Tableauvisualization #GoogleDeveloperStudentClubs #GDSCNUCES #gdsc #GoogleDSC #GoogleDevelopersGroup #GDSCNUCESKHI #FASTNU #Google #training #workshop #Bootcamp #community

0 notes
Text
DESTINATION : Regression Plot
ROUTE : Regression plots as the name suggests creates a regression line between 2 parameters and helps to visualize their linear relationships.

0 notes
Text
DESTINATION: Box Plot
ROUTE : Box Plot is the visual representation of the depicting groups of numerical data through their quartiles.
Boxplot is also used for detecting the outlier in data set. It captures the summary of the data efficiently with a simple box and whiskers and allows us to compare easily across groups.
Boxplot summarizes a sample data using 25th, 50th and 75th percentiles. These percentiles are also known as the lower quartile, median and upper quartile. A box plot consist of 5 things : Minimum, First Quartile or 25%, Median (Second Quartile) or 50%, Third Quartile or 75%, Maximum.


0 notes