#howtocalculatethefreecashflow
Explore tagged Tumblr posts
Visit Tumblr Blog
Explore Tumblr blogs with no restrictions, modern design and the best experience.
Last Seen Tumblr Blogs


Fun Fact
Average visit duration of Tumblr.com is 10 mins and 25 secs.
Photo
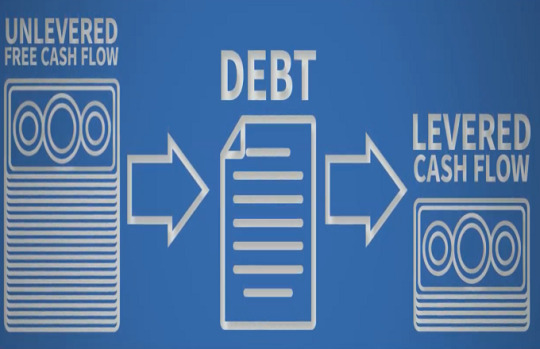
The internal rate of return (IRR) calculation is based on projected free cash flows. The IRR is equal to the discount rate which leads to a zero Net Present Value (NPV) of those cash flows. Important therefore is the definition of the free cash flows. There are two main types of free cash flows which can be referred to:
Unlevered free cash flows (free cash flows to firm): EBIT * (1-tax rate) – CAPEX + Addback Depreciation – Change in Net Working Capital
Levered free cash flows (free cash flows to equity shareholders): Unlevered free cash flows + change in financial debt – interest + correction for effective taxes paid
EBIT = Earnings before Interest and Taxes
CAPEX = Capital Expenditures
While unlevered free cash flows refer to the cash flows generated by the company without considering its financing structure, levered free cash flows are impacted by the amount of financial debt used. Using financial debt – especially in low-interest-rate environments – is much cheaper than financing solely with equity and allows to enhance the returns on their investment. This is called “financial leverage, “gearing” or “financial engineering”. The resulting IRR calculations now can be differentiated as follows:
IRR Unlevered uses the unlevered free cash flows and is subject to the operating risks of the company. The unlevered IRR is not supposed to be affected by any change in the company’s financing structure. The IRR Unlevered often is also called the “Project IRR”.
IRR Levered is calculated based on the levered free cash flows (another variation of this is to use a cash-in / cash-out consideration based on the initial equity investment made, dividends and exit proceeds). IRR levered includes the operating risk as well as financial risk (due to the use of debt financing). In case the financing structure or interest rate changes, IRR levered will change as well (whereas the IRR unlevered stays the same). The levered IRR is also known as the “Equity IRR”.
Calculating and understanding the IRR levered can be tricky. Therefore, let us review an internal rate of return example calculated in Excel for two different investment cases. Both investment projects, A and B, show similar operating risks and require a 10% opportunity cost on invested capital to compensate investors for the operating risks involved.
0 notes