#it is good and valid to learn quantitative and qualitative data analysis
Explore tagged Tumblr posts
Visit Tumblr Blog
Explore Tumblr blogs with no restrictions, modern design and the best experience.
Last Seen Tumblr Blogs


Fun Fact
In February 2021, Tumblr had 518.6 million blog accounts.
Text
DS9 save me from data analysis... save me DS9
#it is good and valid to learn quantitative and qualitative data analysis#it is important for me to understand this#i cannot give evidence based care if i cannot understand evidence#i say through gritted teeth#fuck i hate this class so bad but its so important
1 note
·
View note
Text
The nature of academic research encompasses a broad array of investigative criteria. Within this spectrum of understanding, quantitative, qualitative, and mixed methods research form the backbone of a system that functions to investigate some of the most pressing questions of contemporary culture. One of the most notable research approaches is what is known as action research. While action research takes on a variety of contexts and has been understood from a variety of perspectives it has been broadly categorized as a group of individuals working in a team as a means of developing solutions and increasing insights into the problems at hand (Whitehead & McNiff 2006). This essay examines my perspective on action research as conducted by a social scientist, as well as my growth edge when it comes to learning about the practice of social research. When examining my perspective on action research within the social sciences my perspective is greatly influenced by major theoretical paradigms. While I recognize that action research has prominently been implemented in academic contexts, this approach to the investigation has been extended to a number of business and organizational contexts. Simply speaking, action research involves taking practical and defined action in response to a set of problems. Within the organizational context, such processes emerge daily in pragmatic and functional ways (Argyris 1994). In these regards, social science principles, including sociology and psychology have been implemented in a substantial amount of action research initiatives as a method of determining strategic approaches to the business climate. While action research in the organizational context constitutes a major implementation of this investigative approach, there is also substantial implementation of this research within academia. In terms of social science research, I recognize that there are a number of theoretical perspectives. In these regards, action research combines real-world investigative solutions in combination with data in a collaborative analysis to reach investigative solutions (Argyris 1994). In this context of understanding, action research in the social science context can be understood as a fluid approach to investigative solutions. One perspective notes, “Knowledge is always gained through action and for action. From this starting point, to question the validity of social knowledge is to question, not how to develop a reflective science about action, but how to develop genuinely well-informed action — how to conduct an action science” (Torbert 2002). This is important as it encapsulates the structural dimensions of action research. Action research goes beyond simple data analysis or collation of information and recognizes that knowledge exists in a complex and fluid context that necessitates an equally malleable approach to investigation. In my own doctoral program, I am planning on pursuing action research through patient healing in a good environment. Such an investigation will necessarily include qualitative action in understanding this healing process through regular action research. Ultimately, while action research can be broadly equated with the classical notion of the ‘experiment,’ in the context of social sciences this takes on a variety of qualitative assumptions wherein the researcher and collaborative team oftentimes discover new research criteria that may have been lost by a more rigid investigative process. Another important aspect of research is what has been referred to as one’s growth edge. In these regards, I recognize that I have a number of areas where my growth edge can be strengthened. While I currently recognize that I have an adequate understanding of qualitative investigative practices, one of my major potentials for growth is in-term of quantitative and mixed-method research practices. Although my knowledge of statistical correlations is only rudimentary, I would like to strengthen my ability in this realm as it relates to my doctoral research in the healthcare field. I believe that by developing my growth edge in terms of quantitative research I can then combine this with qualitative approaches in conducting significant action research initiatives. In conclusion, this essay has examined action research as implemented in the social sciences in terms of my personal perspectives. In addition to this investigative concern, the essay has examined my growth edge in terms of social science research. The essay has revealed that action research constitutes a unique collaborative approach to developing research solutions. Read the full article
0 notes
Text
Top Market Research Companies in Nigeria

Being the largest economy in Africa, Nigeria offers enormous opportunities in different sectors like technology, agriculture, healthcare, and consumer goods. It is important to understand the latest market trends and challenges of the market to achieve success in Nigeria. For the growth of businesses in the diverse market of Nigeria, it is crucial for companies to understand the dynamics of this region. The market research firms in Nigeria provide valuable insights to guide strategic decisions.
Through this blog, you will learn about the best market research agencies in Nigeria and how they contribute to empowering businesses with data-driven solutions to understand the Nigerian market effectively.
1.Infomineo:
Infomineo is one of the leading market research companies in Nigeria which is known for delivering premium-quality market research and business intelligence services. Being an expert in market research, this company have a great understanding of the economic features of Nigeria. Hence, it helps businesses to get actionable insights and make well-informed decisions. The prime services offered by this company are industry analysis, consumer behavior research, and business intelligence.
2.Spade Survey:
Spade Survey is a top market research company in Nigeria which has been delivering excellence for many years. Renowned as one of the best social research companies in Nigeria, Spade Survey has made its name in the fields of market research, healthcare research, and social research. By utilizing both qualitative and quantitative methods, this company has been providing market research solutions to various sectors in Nigeria. With its business strategic insights, companies can get exponential growth in the Nigerian market. The major services provided by this company are market research, healthcare research, consumer surveys, monitoring & evaluation research, and market feasibility studies.
With a commitment to excellence and a focus on delivering high-quality results, Spade Survey stands out as a trusted partner for Nigerian businesses seeking reliable market research services. Their dedication to understanding the intricacies of the Nigerian market, combined with their proficiency in gathering and analyzing data, enables them to provide valuable insights that enable businesses to stay ahead of the competition. By offering tailored solutions that cater to the specific requirements of each client, Spade Survey plays a vital role in helping Nigerian businesses thrive in a dynamic and competitive market environment.
3.Market Trends International:
Another market research company that has been offering innovative solutions to businesses in Nigeria is Market Trends International (MTI). With the utilization of its amazing services, businesses can identify opportunities and overcome challenges. With the aid of the latest methodologies in the field of research, this company guarantees the validity and dependability of information. The main services are brand performance tracking, retail audits, and market entry strategy.
4.TNS RMS Nigeria
Being one of the leading social impact consulting companies in Nigeria, TNS RMS is part of the Kantar network, a global leader in market research. With a strong presence in Nigeria, they specialize in delivering consumer insights that help brands grow. The prime services of this company are social research, media & advertising research, and consumer insight analysis. Their global resources combined with local market expertise make them a trusted partner for both local and global businesses.
5.Research Plus:
Research Plus is one of the best market research analysts in Nigeria that offers personalized research solutions to address unique business needs. Due to a better understanding of the socio-economic environment in Nigeria, they maintain the top positions among several organizations. The major services are testing products, customer satisfaction surveys, and competitive analysis.
When you associate with the right market research firm in Nigeria, you will observe the difference while making informed decisions. The above-listed firms have the best track record of delivering high-quality, actionable insights to businesses so they can make the right decisions.
How Spade Survey Works:
We provide unique solutions in a variety of industries, including FMCG, agribusiness, healthcare, IT, as well as hospitality, banking, and the public sector. Our in-depth and objective study provides a better grasp of the macro and micro variables that influence the socioeconomic and political environment.
We specialize in offering comprehensive market research and strategic insights on an international scale. With a dedication to providing high-quality, actionable intelligence, our team navigates the complexity of varied global marketplaces.
Our customized solutions cover a wide range of sectors and geographies, providing unprecedented insight into global market dynamics. From market entry strategies to competitor analysis, our global perspective is critical to our clients’ success in today’s interconnected business environment.
As the best market research company in Nigeria, our team of analysts uses sophisticated methodology to conduct customized, objective, and sensitive research to assist leading firms in assessing industry trends and identifying strategic growth opportunities. We then collaborate closely with our clients to create practical strategic strategies for seizing and implementing growth possibilities.
We use advanced analytics and innovative methods to analyze global consumer behavior, identify emerging trends, and allow organizations to make informed cross-border decisions. Partner with us for a thorough understanding of global market landscapes, allowing your company to survive and succeed in the global marketplace.
Spade Survey is renowned for providing the best market research company in Nigeria, including customized market insights to help Nigerian businesses grow. Spade Survey goes above and beyond by leveraging their expertise and in-depth understanding of the local market scene to create tailored solutions that answer the unique demands and issues that Nigerian businesses confront. They use a strategic approach and attention to detail to guarantee that their market insights are not only accurate but also actionable, allowing their clients to make educated decisions that drive growth and success.
Conclusion:
These Nigerian market research companies are only a few scenarios of the industry’s experience and services. Each company provides unique strengths and skills, ensuring that businesses have access to complete and dependable market research services. Businesses that collaborate with these companies can obtain a better understanding of the Nigerian market, find opportunities, and make data-driven decisions to propel their growth.
Spade Survey is one of Nigeria’s top market research companies providing both quantitative and qualitative research services. In addition to being one of Nigeria’s largest market research organizations, We help our clients expand their businesses in Nigeria and across Africa.
Find out about how we can help out with your market research projects in Nigeria, send an email to [email protected] or call +1-(929)-237-1145.
#Nigerian market research companies#best market research company in Nigeria#best market research analysts in Nigeria#market research company in Nigeria
0 notes
Text
How to Get the Most Out of Quantitative Market Research
Quantitative market research focuses on data results that are objective and measurable, i.e., “quantifiable.” Surveys, polls, and questionnaires are all examples of quantitative research measures and are frequently used in many market research projects. But while seemingly simple by nature, quantitative market research entails a lot more than just tallying up numbers and having consumers choose between “yes” and “no” answers. Quantitative market research necessitates thoughtful planning and careful execution in order to ensure meaningful results. Here’s how to get the most out of it:
Make Sure Your Research Question Can Be Answered with Quantitative Market Research
Good research begins with a clear understanding of what you need to know, as well as why you need to know it. Put simply, it starts with the research question (one or sometimes more). The research question shapes the rest of the research project, pointing researchers to the right people in the right way so that only reliable answers are yielded and only meaningful insights result. Some research questions, for instance, seek to measure or validate specific behaviors or theories. In these types of cases, quantitative market research makes sense. However, other research problems are more exploratory by nature, necessitating subjective (i.e., qualitative) analysis in order to investigate or probe consumer feelings and motivations. You must make sure that you match your research question to the research methodology best equipped to supply you with the information you need; otherwise you waste time gathering data that’s not truly relevant to the question at hand.
Choose Your Sample Carefully
Quantitative market research relies on numbers. Because of this, the larger your sample, the more reliable your results. But you don’t only need a large sample, you also need the right target audience: you must carefully choose research participants who represent a specific customer profile in numbers large enough that your results are statistically significant. This ensures that the results you get back aren’t just a matter of chance.
Keep Questions Short and Simple
Of course, you can’t get good data if you don’t get any! You need your research respondents to complete your questions, and you need them to be honest and straightforward with their answers. To this end, any quantitative market research project should be short enough that respondents don’t get tired of providing information and simple enough to understand that they don’t become confused and give irrelevant replies. Single, close-ended questions that generate simple, unambiguous responses will ensure that any resulting information is easily sorted and counted, and thus, available for meaningful interpretation.
Want to Learn More
To get the most out of quantitative market research company. you must carefully match your research question with your research strategy. A skilled market researcher can help, offering support as you pinpoint what you need to know and guiding the development of a plan for getting your answer. Our team at Research America has decades of experience; we help our clients match their own unique research needs with the appropriate tools so that each garners actionable insights that improve their business practices, as well as their bottom lines. Please contact us to learn more.
0 notes
Text
Machine learning's crumbling foundations

Technological debt is insidious, a kind of socio-infrastructural subprime crisis that’s unfolding around us in slow motion. Our digital infrastructure is built atop layers and layers and layers of code that’s insecure due to a combination of bad practices and bad frameworks.
Even people who write secure code import insecure libraries, or plug it into insecure authorization systems or databases. Like asbestos in the walls, this cruft has been fragmenting, drifting into our air a crumb at a time.
We ignored these, treating them as containable, little breaches and now the walls are rupturing and choking clouds of toxic waste are everywhere.
https://pluralistic.net/2021/07/27/gas-on-the-fire/#a-safe-place-for-dangerous-ideas
The infosec apocalypse was decades in the making. The machine learning apocalypse, on the other hand…
ML has serious, institutional problems, the kind of thing you’d expect in a nascent discipline, which you’d hope would be worked out before it went into wide deployment.
ML is rife with all forms of statistical malpractice — AND it’s being used for high-speed, high-stakes automated classification and decision-making, as if it was a proven science whose professional ethos had the sober gravitas you’d expect from, say, civil engineering.
Civil engineers spend a lot of time making sure the buildings and bridges they design don’t kill the people who use them. Machine learning?
Hundreds of ML teams built models to automate covid detection, and every single one was useless or worse.
https://pluralistic.net/2021/08/02/autoquack/#gigo
The ML models failed due to failure to observe basic statistical rigor. One common failure mode?
Treating data that was known to be of poor quality as if it was reliable because good data was not available.
Obtaining good data and/or cleaning up bad data is tedious, repetitive grunt-work. It’s unglamorous, time-consuming, and low-waged. Cleaning data is the equivalent of sterilizing surgical implements — vital, high-skilled, and invisible unless someone fails to do it.
It’s work performed by anonymous, low-waged adjuncts to the surgeon, who is the star of the show and who gets credit for the success of the operation.
The title of a Google Research team (Nithya Sambasivan et al) paper published in ACM CHI beautifully summarizes how this is playing out in ML: “Everyone wants to do the model work, not the data work: Data Cascades in High-Stakes AI,”
https://storage.googleapis.com/pub-tools-public-publication-data/pdf/0d556e45afc54afeb2eb6b51a9bc1827b9961ff4.pdf
The paper analyzes ML failures from a cross-section of high-stakes projects (health diagnostics, anti-poaching, etc) in East Africa, West Africa and India. They trace the failures of these projects to data-quality, and drill into the factors that caused the data problems.
The failures stem from a variety of causes. First, data-gathering and cleaning are low-waged, invisible, and thankless work. Front-line workers who produce the data — like medical professionals who have to do extra data-entry — are not compensated for extra work.
Often, no one even bothers to explain what the work is for. Some of the data-cleaning workers are atomized pieceworkers, such as those who work for Amazon’s Mechanical Turk, who lack both the context in which the data was gathered and the context for how it will be used.
This data is passed to model-builders, who lack related domain expertise. The hastily labeled X-ray of a broken bone, annotated by an unregarded and overworked radiologist, is passed onto a data-scientist who knows nothing about broken bones and can’t assess the labels.
This is an age-old problem in automation, pre-dating computer science and even computers. The “scientific management” craze that started in the 1880s saw technicians observing skilled workers with stopwatches and clipboards, then restructuring the workers’ jobs by fiat.
Rather than engaging in the anthropological work that Clifford Geertz called “thick description,” the management “scientists” discarded workers’ qualitative experience, then treated their own assessments as quantitative and thus empirical.
http://hypergeertz.jku.at/GeertzTexts/Thick_Description.htm
How long a task takes is empirical, but what you call a “task” is subjective. Computer scientists take quantitative measurements, but decide what to measure on the basis of subjective judgment. This empiricism-washing sleight of hand is endemic to ML’s claims of neutrality.
In the early 2000s, there was a movement to produce tools and training that would let domain experts produce their own tools — rather than delivering “requirements” to a programmer, a bookstore clerk or nurse or librarian could just make their own tools using Visual Basic.
This was the radical humanist version of “learn to code” — a call to seize the means of computation and program, rather than being programmed. Over time, it was watered down, and today it lives on as a weak call for domain experts to be included in production.
The disdain for the qualitative expertise of domain experts who produce data is a well-understood guilty secret within ML circles, embodied in Frederick Jelinek’s ironic talk, “Every time I fire a linguist, the performance of the speech recognizer goes up.”
But a thick understanding of context is vital to improving data-quality. Take the American “voting wars,” where GOP-affiliated vendors are brought in to purge voting rolls of duplicate entries — people who are registered to vote in more than one place.
These tools have a 99% false-positive rate.
Ninety. Nine. Percent.
To understand how they go so terribly wrong, you need a thick understanding of the context in which the data they analyze is produced.
https://5harad.com/papers/1p1v.pdf
The core assumption of these tools is that two people with the same name and date of birth are probably the same person.
But guess what month people named “June” are likely to be born in? Guess what birthday is shared by many people named “Noel” or “Carol”?
Many states represent unknown birthdays as “January 1,” or “January 1, 1901.” If you find someone on a voter roll whose birthday is represented as 1/1, you have no idea what their birthday is, and they almost certainly don’t share a birthday with other 1/1s.
But false positives aren’t evenly distributed. Ethnic groups whose surnames were assigned in recent history for tax-collection purposes (Ashkenazi Jews, Han Chinese, Koreans, etc) have a relatively small pool of surnames and a slightly larger pool of first names.
This is likewise true of the descendants of colonized and enslaved people, whose surnames were assigned to them for administrative purposes and see a high degree of overlap. When you see two voter rolls with a Juan Gomez born on Jan 1, you need to apply thick analysis.
Unless, of course, you don’t care about purging the people who are most likely to face structural impediments to voter registration (such as no local DMV office) and who are also likely to be racialized (for example, migrants whose names were changed at Ellis Island).
ML practitioners don’t merely use poor quality data when good quality data isn’t available — they also use the poor quality data to assess the resulting models. When you train an ML model, you hold back some of the training data for assessment purposes.
So maybe you start with 10,000 eye scans labeled for the presence of eye disease. You train your model with 9,000 scans and then ask the model to assess the remaining 1,000 scans to see whether it can make accurate classifications.
But if the data is no good, the assessment is also no good. As the paper’s authors put it, it’s important to “catch[] data errors using mechanisms specific to data validation, instead of using model performance as a proxy for data quality.”
ML practitioners studied for the paper — practitioners engaged in “high-stakes” model building reported that they had to gather their own data for their models through field partners, “a task which many admitted to being unprepared for.”
High-stakes ML work has inherited a host of sloppy practices from ad-tech, where ML saw its first boom. Ad-tech aims for “70–75% accuracy.”
That may be fine if you’re deciding whether to show someone an ad, but it’s a very different matter if you’re deciding whether someone needs treatment for an eye-disease that, untreated, will result in irreversible total blindness.
Even when models are useful at classifying input produced under present-day lab conditions, those conditions are subject to several kinds of “drift.”
For example, “hardware drift,” where models trained on images from pristine new cameras are asked to assess images produced by cameras from field clinics, where lenses are impossible to keep clean (see also “environmental drift” and “human drift”).
Bad data makes bad models. Bad models instruct people to make ineffective or harmful interventions. Those bad interventions produce more bad data, which is fed into more bad models — it’s a “data-cascade.”
GIGO — Garbage In, Garbage Out — was already a bedrock of statistical practice before the term was coined in 1957. Statistical analysis and inference cannot proceed from bad data.
Producing good data and validating data-sets are the kind of unsexy, undercompensated maintenance work that all infrastructure requires — and, as with other kinds of infrastructure, it is undervalued by journals, academic departments, funders, corporations and governments.
But all technological debts accrue punitive interest. The decision to operate on bad data because good data is in short supply isn’t like looking for your car-keys under the lamp-post — it’s like driving with untrustworthy brakes and a dirty windscreen.
Image: Seydelmann (modified) https://commons.wikimedia.org/wiki/File:GW300_1.jpg
CC BY-SA: https://creativecommons.org/licenses/by-sa/3.0/deed.en
Cryteria (modified) https://commons.wikimedia.org/wiki/File:HAL9000.svg
CC BY: https://creativecommons.org/licenses/by/3.0/deed.en
116 notes
·
View notes
Text
DESCRIPTIVE RESEARCH - NOTES
Descriptive research is used to describe characteristics of a population or phenomenon being studied. It does not answer questions about how/when/why the characteristics occurred. For example, over time the periodic table’s description of the elements allowed scientists to explain chemical reaction and make sound prediction when elements were combined. Hence, descriptive research cannot describe what caused a situation. Thus, descriptive research cannot be used as the basis of a causal relationship, where one variable affects another. In other words, descriptive research can be said to have a low requirement for internal validity.
Characteristics of Descriptive Research
The term descriptive research then, refers to research questions, design of the research and data analysis that would be conducted on that topic. It is called an observational research method because none of the variables that are part of the research study are influenced in any capacity.
Some distinctive characteristics of descriptive research are:
Quantitative research: Descriptive research is a quantitative research method that attempts to collect quantifiable information to be used for statistical analysis of the population sample. It is an popular market research tool that allows to collect and describe the nature of the demographic segment.
Uncontrolled variables: In descriptive research, none of the variables are influenced in any way. This uses observational methods to conduct the research. Hence, the nature of the variables or their behavior is not in the hands of the researcher.
Cross-sectional studies: Descriptive research is generally a cross-sectional study where different sections belonging to the same group are studied.
Basis for further research: The data collected and analyzed from descriptive research can then be further researched using different research techniques. The data also can help point towards the types of research methods are to be used for the subsequent research.
Descriptive Research Methods
There are 3 distinctive methods to conduct descriptive research. They are:
Observational Method
The observational method is the most effective method to conduct descriptive research and both quantitative observation and qualitative observation are used in this research method.
Quantitative observation is the objective collection of data which is primarily focused on numbers and values – it suggests “associated to, of or depicted in terms of a quantity”. For example, the researcher can track if current customers will refer the brand by using a simple Net Promoter Score question.
Qualitative observation doesn’t involve measurements or numbers but instead just monitoring characteristics. In this case the researcher observes the respondents from a distance. Since the respondents are in a comfortable environment, the characteristics observed are natural and effective For example, in a supermarket, a researcher can from afar monitor and track the selection and purchasing trends of the customers. This offers a deeper insight into the purchasing experience of the customer.
Case Study Method
Case studies involve in-depth research and study of individuals or groups. Case studies lead to a hypothesis and widen a further scope of studying a phenomenon. However, case studies should not be used to determine cause and effect as they don’t have the capacity to make accurate predictions because there could be a bias on the part of the researcher. The other reason why case studies are not an accurate way of conducting descriptive research is because there could be an atypical respondent in the research and describing them leads to poor generalizations and move away from external validity.
Survey Research
In survey research, respondents answer through surveys or questionnaires, or polls. They are a popular market research tool to collect feedback from respondents. In order for a survey to gather good quality data, it should have good survey questions, which should be a balanced mix of open-ended questions and close ended-questions. The survey method can be conducting online or offline which is makes it the go-to option for descriptive research where the sample size is very large.
Examples of Descriptive Research
An example of where descriptive research can be used is if a school district that wishes to evaluate teachers attitudes about using technology in the classroom. By conducting surveys and observing their comfortableness using technology through observational methods, the researcher can gauge what they can help understand if a full-fledged implementation can face an issues. This also helps in understanding if the students are impacted in any way with this change.
Advantages of Descriptive Research
Some of the major advantages of descriptive research are:
Data collection: Descriptive research can be conducted by using specific methods like observational method, case study method and survey method. Between these 3, all major methods of data collection are covered which provides a lot of information. This can be used for future research or even developing hypothesis of your research object.
Varied: Since the data collected is both qualitative and quantitative, it gives a holistic understanding of a research topic. This causes data that was not planned to be collected gets tracked and the data is varied, diverse and thorough.
Natural environment: Descriptive research allows for the research to be conducted in the natural environment of the respondent and this ensures that high-quality and honest data is collected.
Quick to conduct and cheap: As the sample size is generally large in descriptive research, the data collection is quick to conduct and is cheap.
Forms basis for decision-making: As the data collected in descriptive research represents a larger population and is robust, it is easy to make decisions on the basis of the statistical analysis of that data.
Disadvantages of Descriptive Research
Some of the major disadvantages of descriptive research are:
Confidentiality: Respondents aren’t always truthful if questions are too personal or they feel that they are being “watched”. This may negate the validity of the data.
Halo effect: If the research observer has a potential bias towards the research topic or some respondents in the research, the observations then maybe considered as invalid or untrue.
Sample isn’t representative: Due to the randomness of the sample, it is very tough to validate that the sample is an accurate representation of the whole population.
No scope to learn cause: Since descriptive research only focuses on the “what” of an objective or phenomenon, it does not delve into the “why or how” and that is a limitation in learning specific causes.
CONCLUSION :
Descriptive research is used extensively in social science, psychology and educational research. It can provide a rich data set that often brings to light new knowledge or awareness that may have otherwise gone unnoticed or encountered. It is particularly useful when it is important to gather information with disruption of the subjects or when it is not possible to test and measure large numbers of samples. It allows researchers to observe natural behaviors without affecting them in any way.
1 note
·
View note
Text
Molded Fiber Packaging Material Market Research Report 2016-2030

The report on Molded Fiber Packaging Material market provides qualitative as well as quantitative analysis in terms of market dynamics, competition scenarios, opportunity analysis, market growth, industrial chain, etc.
This report studies the Molded Fiber Packaging Material market status and outlook of global and major regions, from angles of players, countries, product types and end industries, this report analyzes the top players in global Molded Fiber Packaging Material industry, and splits by product type and applications/end industries.
The readers will find this report very helpful in understanding the market in depth. The data and the information regarding the market are taken from reliable sources such as websites, annual reports of the companies, journals, and others and were checked and validated by the industry experts. The facts and data are represented in the report using diagrams, graphs, pie charts, and other pictorial representations. This enhances the visual representation and also helps in understanding the facts much better.
Click here to get free sample report: https://analyticsmarketresearch.com/sample-request/molded-fiber-packaging-material-market/16287/
Global Molded Fiber Packaging Material Market: Major Players
UFP Technologies
Henry Moulded Products
Brødrene Hartmann
Huhtamaki
Keiding
Cullen Packaging
EnviroPAK
Hurley Packaging of Texas
Moulded Fibre Product
Heracles Packaging
Global Molded Fiber Packaging Material Market: By Types
Thick-Wall
Transfer
Thermoformed (Thin-wall)
Processed
Global Molded Fiber Packaging Material Market: By Applications
Food and beverages industry
Consumer durables and electronic goods industry
Automotive packaging industry
Home and personal care industry
Global Molded Fiber Packaging Material Market: Regional Analysis
All the regional segmentation has been studied based on recent and future trends, and the market is forecasted throughout the prediction period. The countries covered in the regional analysis of the Global Molded Fiber Packaging Material market report are U.S., Canada, and Mexico in North America, Germany, France, U.K., Russia, Italy, Spain, Turkey, Netherlands, Switzerland, Belgium, and Rest of Europe in Europe, Singapore, Malaysia, Australia, Thailand, Indonesia, Philippines, China, Japan, India, South Korea, Rest of Asia-Pacific (APAC) in the Asia-Pacific (APAC), Saudi Arabia, U.A.E, South Africa, Egypt, Israel, Rest of Middle East and Africa (MEA) as a part of Middle East and Africa (MEA), and Argentina, Brazil, and Rest of South America as part of South America.
Key Reasons to Purchase
To gain insightful analyses of the market and have comprehensive understanding of the global market and its commercial landscape.
Assess the production processes, major issues, and solutions to mitigate the development risk.
To understand the most affecting driving and restraining forces in the market and its impact in the global market.
Learn about the market strategies that are being adopted by leading respective organizations.
To understand the future outlook and prospects for the market.
Besides the standard structure reports, we also provide custom research according to specific requirements.
Click here to purchase this report: https://analyticsmarketresearch.com/purchase/molded-fiber-packaging-material-market/16287/?license=single
Points Covered in The Report
The points that are discussed within the report are the major market players that are involved in the market such as market players, raw material suppliers, equipment suppliers, end users, traders, distributors and etc.
The complete profile of the companies is mentioned. And the capacity, production, price, revenue, cost, gross, gross margin, sales volume, sales revenue, consumption, growth rate, import, export, supply, future strategies, and the technological developments that they are making are also included within the report. This report analyzed 12 years data history and forecast.
The growth factors of the market is discussed in detail wherein the different end users of the market are explained in detail.
Data and information by market player, by region, by type, by application and etc, and custom research can be added according to specific requirements.
The report contains the SWOT analysis of the market. Finally, the report contains the conclusion part where the opinions of the industrial experts are included.
Analytics Market Research
Analytics Market Research is an established market analytics and research firm with a domain experience sprawling across different industries. We have been working on multi-county market studies right from our inception. Over the time, from our existence, we have gained laurels for our deep rooted market studies and insightful analysis of different markets.
Our strategic market analysis and capability to comprehend deep cultural, conceptual and social aspects of various tangled markets has helped us make a mark for ourselves in the industry. Analytics Market Research is a frontrunner in helping numerous companies; both regional and international to successfully achieve their business goals based on our in-depth market analysis. Moreover, we are also capable of devising market strategies that ensure guaranteed customer bases for our clients.
Contact Us:
Analytics Market Research
99 WALL STREET, #2124 NEW YORK, NY 10005
Phone: +1(650)-666-4592
E-mail : [email protected]
#Molded Fiber Packaging Material Market#Global Molded Fiber Packaging Material Market#Molded Fiber Packaging Material Market 2022#Molded Fiber Packaging Material Market type#Molded Fiber Packaging Material Market application
0 notes
Text
Education ERP Market: Global Industry Analysis, Trends, Market Size, and Forecasts up to 2026
The report on the global education ERP market provides qualitative and quantitative analysis for the period from 2018 to 2026. The report predicts the global education ERP market to grow with a CAGR of 15.3% over the forecast period from 2020-2026. The study on education ERP market covers the analysis of the leading geographies such as North America, Europe, Asia-Pacific, and RoW for the period of 2018 to 2026. The report on education ERP market is a comprehensive study and presentation of drivers, restraints, opportunities, demand factors, market size, forecasts, and trends in the global education ERP market over the period of 2018 to 2026. Moreover, the report is a collective presentation of primary and secondary research findings.
Request to Fill The Form To get Sample Copy of This Report: https://www.sdki.jp/sample-request-104728 Porter's five forces model in the report provides insights into the competitive rivalry, supplier and buyer positions in the market and opportunities for the new entrants in the global education ERP market over the period of 2018 to 2026. Further, IGR- Growth Matrix gave in the report brings an insight into the investment areas that existing or new market players can consider. Report Findings 1) Drivers • Rising urbanization in developing countries, increasing middle-class population and surge in the adoption of smart education ERP solutions globally • Increasing adoption of technology products by institutes increased usage of smart devices and software’s 2) Restraints • High installation cost involved and concern for data security 3) Opportunities • Technological advancement in the application to provide ease in handling Research Methodology A) Primary Research Our primary research involves extensive interviews and analysis of the opinions provided by the primary respondents. The primary research starts with identifying and approaching the primary respondents, the primary respondents are approached include 1. Key Opinion Leaders associated with Infinium Global Research 2. Internal and External subject matter experts 3. Professionals and participants from the industry Our primary research respondents typically include 1. Executives working with leading companies in the market under review 2. Product/brand/marketing managers 3. CXO level executives 4. Regional/zonal/ country managers 5. Vice President level executives. B) Secondary Research Secondary research involves extensive exploring through the secondary sources of information available in both the public domain and paid sources. At Infinium Global Research, each research study is based on over 500 hours of secondary research accompanied by primary research. The information obtained through the secondary sources is validated through the crosscheck on various data sources. The secondary sources of the data typically include 1. Company reports and publications 2. Government/institutional publications 3. Trade and associations journals 4. Databases such as WTO, OECD, World Bank, and among others. 5. Websites and publications by research agencies Segment Covered The global education ERP market is segmented on the basis of component, and deployment type. The Global Education ERP Market by Component • ERP Solutions o Student Information Systems (SIS) o Learning Management Systems (LMS) o Student Assessment Systems (SAS) o Library Management Systems o Fee Management Systems o Others • Services o Consulting o Implementation o Training & Support The Global Education ERP Market by Deployment Type • Cloud • On-premises Company Profiles The companies covered in the report include • Blackbaud, Inc. • SAP AG • Dell Inc. • Oracle Corporation • Epicor Software Corporation • Netsuite • Ellucian Banner • Jenzabar Solutions • Unit4 • Others What does this report deliver? 1. Comprehensive analysis of the global as well as regional markets of the education ERP market. 2. Complete coverage of all the segments in the education ERP market to analyze the trends, developments in the global market and forecast of market size up to 2026. 3. Comprehensive analysis of the companies operating in the global education ERP market. The company profile includes analysis of product portfolio, revenue, SWOT analysis and latest developments of the company. 4. IGR- Growth Matrix presents an analysis of the product segments and geographies that market players should focus to invest, consolidate, expand and/or diversify.
The dynamic nature of business environment in the current global economy is raising the need amongst business professionals to update themselves with current situations in the market. To cater such needs, Shibuya Data Count provides market research reports to various business professionals across different industry verticals, such as healthcare & pharmaceutical, IT & telecom, chemicals and advanced materials, consumer goods & food, energy & power, manufacturing & construction, industrial automation & equipment and agriculture & allied activities amongst others.
For more information, please contact:
Hina Miyazu
Shibuya Data Count Email: [email protected] Tel: + 81 3 45720790
0 notes
Text
Metal Credit Cards market Demand, Growth and Development Forecast 2021-2026
"
Metal Credit Cards Market Scope: An in-depth market report includes thoughtful findings, industry facts, historical data, and statistically supported insights, and market-authenticated data. On the first-hand experience, quantitative and qualitative assessment value chain, the research report is a compilation of expert analysts, input from industry professionals, and industry stakeholders. The study also shows how many market variables have a qualitative impact on market segments and regions. The survey's data was gathered using both primary and secondary methods by the market forecasters. They used the same data to create the most recent business scenario.
Get Exclusive Sample of Report on Metal Credit Cards market is available at:https://axelreports.com/request-sample/101528
The purpose of this research study is to help consumers gain a better understanding of the Metal Credit Cards market. Depending on the segments, the study includes an in-depth analysis of parent industry trends, governing factors, and macroeconomic indicators, as well as market attractiveness. With the help of an in-depth list of methodologies and assumptions, it also covers accurate market estimations. The market research report covers market segments such as geographies, applications, and end-use industries, also provide data and analysis for each of them.
Covid-19 Impact on Metal Credit Cards Market The Metal Credit Cards market study also goes into immense detail about the COVID-19 pandemic's ongoing outrage, its impact on many markets, industry prospects, and economies of recovery. In addition, the study on geographic segmentation, manufacturer perspectives, and extensive COVID-19 results shared a wealth of information.
Segmentation Landscape: Global Metal Credit Cards Market The research study delves into specific segments based on their form and function. This report includes sales and revenue data from the previous year as well as projections for the mentioned forecast period. This research provides important insights into the segments' understanding, as well as the importance of various factors that contribute to market growth.
By Market Players: Composecure CPI Card Group Gemalto X-Core G&D Goldpac Valid By Type Full Metal Card Hybrid Metal Card Veneer Metal Card Others By Application Standard Cards Custom Cards
Click Here For Having Any Query: https://axelreports.com/enquiry-before-buying/101528
Regional Analysis of Global Metal Credit Cards market The study was designed after researching and defining a number of factors that influence geographical development, including the region's economic, technological, environmental, social, and political status. This chapter examines regional share and volume for the given estimated timeframe. This research will assist the reader in determining the potential value of an investment in a particular area. Researchers looked at data from each country's production, sales, and producers.
Competitive Landscape: Global Metal Credit Cards Market In this section, several primary competitors in the Metal Credit Cards market are identified along with their detailed profiles. It enables the customer to comprehend the alliances and strategies that are used to combat global market rivalry. The comprehensive study offers a detailed microscopic examination of the entire industry. The reader will recognize the industries' footprints by learning about global producer prices, global producer share, and global vendor share over the forecast period. The revenue generated from regional pricing innovations is the basis for this report's market forecast. The potential demand from customers has been used to evaluate the Metal Credit Cards market. To estimate the industry's global income, divided into regions, the bottom-up approach is used.
View market snapshot before purchasing @ https://axelreports.com/industry-analysis/global-metal-credit-cards-market/101528
Reasons to Buy this Report:
In order to obtain a detailed analysis of business strategies for the major key players already operating in the global Metal Credit Cards market, as well as value chain, raw material, and industry variables.
To comprehend all information pertaining to the Metal Credit Cards market, including market, segmentation, and sub-segmentation.
Retailers, wholesalers, manufacturers, dealers, suppliers, and consumers are all included in this report's analysis of distribution channels and distribution chains.
With proper and authentic data, the report covers all factors such as CAGR, supply and demand, macroeconomic patterns, customer purchasing patterns, and many others.
Researchers and analysts also provide accurate and verified information through the report using SWOT analysis, PESTLE analysis, and opportunity assessment.
ABOUT Axel Reports:
Axel Reports has the most comprehensive collection of market research products and services available on the web. We deliver reports from virtually all major publications and refresh our list regularly to provide you with immediate online access to the world’s most extensive and up-to-date archive of professional insights into global markets, companies, goods, and patterns.
Contact: Axel Reports Akansha G (Knowledge Partner) Office No- B 201 Pune, Maharashtra 411060 Phone: US +18488639402 Email: [email protected] Web: https://axelreports.com/
"
0 notes
Text
MC7019_Week12

This week's readings encourage me to think about how to become a competitive mass comm researcher. Nelson (2020) suggested computational grounded theory based on NLP with three steps. The first two-steps pattern detection & Hypothesis Refinement) are basically what quantitative researchers have already used when doing topic modelings or other NLP techniques. For example, like descriptive statistics, most researchers calculated word frequency tables or word clouds to figure out word distributions in their corpus. Based on the results, researchers decide how to clean the corpus. The second step is to conduct and review NLP modelings. Most researchers have reviewed the results from modelings to figure out the optimal parameter value (for example, the number of topics k in LDA). Researchers interpret their data to explain characteristics or patterns in corpus to examine RQ or Hypotheses. Nothing new.
The third step (pattern confirmation) is something new to me. Nelson (2020) suggested using machine learning to validate NLP modeling results. Although it looks nice, it is weird. For example, machine learning is a tool to classify and predict given data, parameters, and algorithms. In other words, if different training sets, parameters, and algorithms are used, validation results can be dramatically different. Instead, it is better to use human coders. For instance, human coders with enough training and acceptable inter-coder reliability about topics extracted by a topic modeling can hand-code a randomly selected subset of texts and then compare the results with topic modeling results.
Even though Nelson's study (2020) is not something new, it shows that recent qualitative researchers have programming knowledge with strong domain expertise. Many experts say that data scientists need three abilities: domain expertise, programming skills, and math. However, if you are not a developer, you do not need to spend too much time on math. Like Nelson (2020)'s saying, understanding various tools, algorithms, and programming is enough to conduct high-quality scientific research. If you have a middle-level programming language, it is a matter of time to apply up-to-date computational statistics to research. While developers would make more efficient and concise codings, the results would not differ from social scientists with middle-level programming and mass knowledge for social science.
After having middle-level programming skills, a competitive edge requires domain-specific knowledge. If you follow a graduate school curriculum in a social science field, you get to reach a certain standard of domain expertise. In addition, the entry barrier of social science fields is relatively low. Reading good textbooks and literature is not technically difficult because there are not many jargons and concepts that ordinary people cannot understand.
It is, however, impossible to yield and solve data scientific research questions and hypotheses without programming knowledge. Still, many social science programs do not include programming. In my case, I have developed programming skills from the traditional mass comm method class. Still, most methods classes teach social science statistics using SPSS. Most method instructors require students to analyze data, giving data and statistical assignment. When other classmates just did it with SPSS, I conduct the same analyses with R. When I saw the same R results from SPSS, I felt confident that I are doing right. If the results are different, I try to figure out the differences between SPSS and R. After the semesters, I have used R for my research projects with more complex and unstructured data. Not long before, I realized the strength of programming languages compared to other commercial statistical packages such as SPSS, SAS, and STATA. Programming language is more time-efficient and flexible to use data science tools. R or Python enables you to combine social scientific methods with text-mining, network analysis, and machine learning with little effort, which is impossible in commercial statistical packages. Many developers also present excellent packages for R or Python to get data from web.
In sum, it is important to resist the temptation to use SPSS with a graphical interface. Instead, spend more time with R and Python. Even though a high learning curve (3 - 6 months) is painful and boring, it is worth investing your valuable time. Before long, you will realize the convenience and strong power of R and Python over SPSS. While increasing domain expertise inside and outside classes, develop more specific programming skills one by one for your research questions and hypotheses. Personally, mass comm method classes do not have to cling to SPSS anymore for instructors' convenience. It will deteriorate students' competitiveness in job markets and research.
0 notes
Text
Meet the team: building new platform features!

Get to know the team at Piclo responsible for building new features on Piclo Flex. Introducing:
Adrian, Data Engineer
Hua, Service Designer and User Researcher
Liam, Software Developer
Meghan, Product Manager
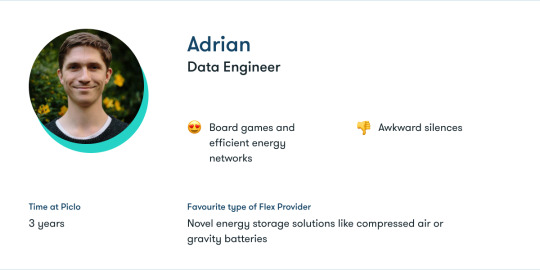
Q1. What does your role involve when Piclo builds new platform features?
Q2. What do you enjoy most about working on this?
I love understanding a problem and figuring out the best solution, and take particular pride in making it efficient when I'm able to.
Q3. Are there particular skills you need for this role?
I would say being able to translate between the real world and the world of data, and being an effective communicator. It helps when people want to know something but aren't quite sure how to ask for it.
Q4. Other than working on introducing new platform features what else does your role include?
I help with producing data insights for both industry and commercial purposes. As data engineer, I'm also closely involved with testing and managing our cloud infrastructure to ensure we are able to scale the platform.
Q5. What did you do before joining Piclo?
I have worked as an analyst and software developer for an environmental consultancy and an off-grid solar provider. Before that I did a PhD in volcano seismology 🌋
Q6. Why did you like the look of the job?
I wanted to work at a company involved in modernising our energy infrastructure that also had technology at its core. I had heard good things about Open Utility (now known as Piclo), it fit the bill, they were about to embark on the Piclo Flex project, and they were hiring. So, here I am!
Q7. Piclo is built on the belief that we are not powerless against climate change. Is tackling climate change important to you? Is there anything you do to contribute?
Tackling climate change is absolutely important to me. Whenever I can, I champion our scientific understanding of climate change (being a geoscientist). I've also tried to build my career around work that helps solve some of the inefficiencies driving climate change. In the name of environmentalism I also gave up eating meat.
Q8. What advice would you give to someone wanting to follow a similar career to yours?
You don't need a PhD in volcano seismology.
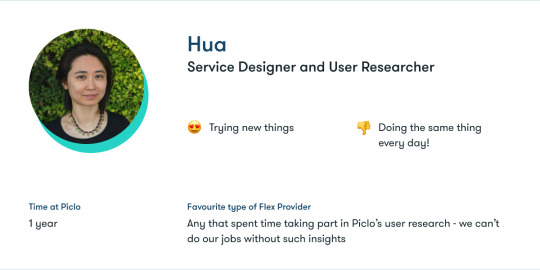
Q1. What does your role involve when Piclo builds new platform features?
Before we commit to any new features, I do some investigations to understand the problem and then share the insights with the team, then we explore solutions together. I prototype different solutions to help with visualisation and the prototypes are then used to help validate our assumptions with the users. By the time we are ready to build, the design has gone through quite a few iterations. We follow the Lean startup model of build - measure - learn, so launching new features is a step in the loop; afterwards I collect quantitative and qualitative feedback, which will guide us to figure out what we should build next.
Q2. What do you enjoy most about working on this?
The flexibility market is not only new to me; it’s also new to many players in the market. I’m learning with them together and helping this market to evolve. The past 12 months of remote working was only made bearable by the wonderful people I work with. My colleagues gave me a lot of support and inspiration. The shared vision of a decarbonised future keeps us motivated.
Q3. Are there particular skills you need for this role?
Putting aside the hard skills of being a designer, I have benefited from developing some soft skills: being curious, being empathetic towards others and myself, getting comfortable with uncertainties and learning from making mistakes.
Q4. Other than working on introducing new platform features what else does your role include?
I sincerely believe that designers don’t hold the best ideas or know the solution to every problem; designers can play the facilitator to guide the team to develop innovative ideas based on their expertise. Disseminating the user knowledge within the team is an essential step after user research. I try to create reusable artefacts, reports or visualisations to store these insights. I recently got very interested in doing quantitative analysis and discovered some useful behavioural patterns and trends.
Q5. What did you do before joining Piclo?
I was freelancing and worked on a few exciting projects in public service and fintech. Somehow I always ended up working on complex domains with highly specialised user groups. I have been fortunate to collaborate with great teams that unite around user needs and are very generous to support each other.
Q6. Why did you like the look of the job?
I’d like to drive a positive impact contributing to solving the climate crisis. A friend of mine told me about their work in the energy trading space, and it opened my eyes to this industry. When I first met the team, I got a good vibe. Alice shared the employee handbook with me before I joined; it showed some very progressive thinking in how the company is run. The product ethos is user-centric, and there is a good understanding of the value of design activities.
Q7. Piclo is built on the belief that we are not powerless against climate change. Is tackling climate change important to you? Is there anything you do to contribute?
Yoyu is a simple app that shows the carbon intensity of energy production forecast for the next 24 hours. I try to shift my energy consumption to the time when there is more renewable energy. I have a smart plug connected to all the chargeable devices at home and it is timed to switch on based on the information in Yoyu. I also compost waste as much as possible. Landfills create a lot more greenhouse gases and soil is the carbon sink - I’m delighted that the local council offers composting!
Q8. What advice would you give to someone wanting to follow a similar career to yours?
Don’t stop learning. The environment around us is rapidly changing, which is very exciting. The way we work and design are constantly evolving. Be creative about how you can enrich yourself, either in learning new skills or pursuing new interests.
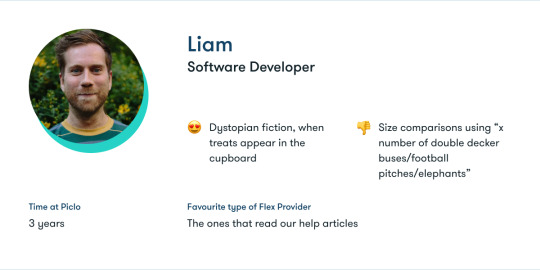
Q1. What does your role involve when Piclo builds new platform features?
Trying not to overpromise and underdeliver. My role generally involves taking designs, requirements and packages of work from the product team and turning them into something that can be used. It’s a fairly stimulating mixture of user interface/frontend development mixed with backend data wrangling. I try and steer clear of the super techy infrastructure side of things.
Q2. What do you enjoy most about working on this?
Being part of a small team working on a specific problem, it’s nice to have input at pretty much every stage of defining and implementing a particular feature, as opposed to churning out widgets of code.
Q3. Are there particular skills you need for this role?
Pragmatism and compromise are always useful.
Q4. Other than working on introducing new platform features what else does your role include?
In a good way, my role is pretty much entirely devoted to this purpose. There aren’t many random tasks or meetings I find clogging up my day (aside from filling out timesheets).
Q5. What did you do before joining Piclo?
Harvesting cookie data for a soulless marketing platform. Before that I was a soulless management consultant.
Q6. Why did you like the look of the job?
I like how Piclo is genuinely trying to solve a problem that hasn’t been addressed yet.
Q7. Piclo is built on the belief that we are not powerless against climate change. Is tackling climate change important to you? Is there anything you do to contribute?
It’s obviously a huge problem but I can’t profess to it informing my everyday life. Sometimes though, there’s a convenient overlap between my being stingy and green behaviours: cycling as much as possible; picking the meat free option.
Q8. What advice would you give to someone wanting to follow a similar career to yours?
Trust your instinct.
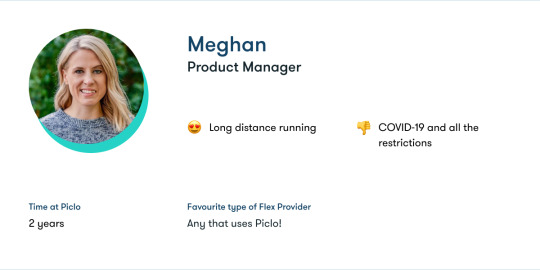
Q1. What does your role involve when Piclo builds new platform features
As a product manager I have a wide range of activities I get involved in when building new features. A quick summary: defining the problems we’re trying to solve, supporting our designers during user research, unpacking all the learnings, co-leading discovery sessions to dig into the problem we’re trying to solve, bringing the team together to design solutions, ticket scoping, and validating recent releases via testing.
Q2. What do you enjoy most about working on this?
As cliche as this sounds, I really do enjoy taking problems off people’s plates, and improving things through our software. As a product manager, you really do have a direct impact on identifying user problems and championing solutions to keep evolving your product.
Q3. Are there particular skills you need for this role?
I think it’s really important to be empathetic in this role. If you struggle to understand your user’s or the pain points that the developers might be feeling, you will also struggle to be a successful PM. Good, clear communication is hugely important. You need to be confident in the decisions you are making, as many times you need to explain or justify why you are or aren’t doing something. Finally, I’d say that collaboration as a PM is a vital skill to embrace and keep getting better at - great products are built with the whole team, and it’s important to know when to reach out to experts on your team to make decisions.
Q4. Other than working on introducing new platform features what else does your role include?
Essentially, my job entails making sure that our production teams are working on the right things at the right times. At Piclo this is a really collaborative process. I’m involved in roadmapping, sprint and release planning at a high level. On a more practical day to day level, I assist in problem discovery, definition of features, ticket scoping and post development testing and validation. I also get to liaise with a lot of different stakeholders in order to improve our product. I especially like supporting our customer success team to get a pulse on what is happening with our product.
Q5. What did you do before joining Piclo?
Just before Piclo I was working for a Madrid based startup. Our product was akin to an Oyster card for live events - mainly music festivals. I had many different roles there but naturally progressed into product management. Aside from the usual PM work, I got to travel loads and see our product being deployed at many a music festival - that was a nice little bonus 😎
Q6. Why did you like the look of the job?
I found myself questioning more and more whether or not where I was choosing to spend my time was meaningful in the grand scheme of things. When the answer turned out to be a ‘not really’ I knew it was time for a change. I loved Piclo’s mission (still do), and I sincerely think that we are building a product that is changing behaviours today to tackle climate change. I was also really attracted to Piclo’s emphasis on teamwork and transparency. This is not just something that we say on job descriptions. We work hard every day to maintain this principle.
Q7. Piclo is built on the belief that we are not powerless against climate change. Is tackling climate change important to you? Is there anything you do to contribute?
Tackling climate change is important to me, it’s one of the reasons I landed at Piclo. I contribute by not eating meat, choosing a green tariff on my energy bill, when commuting choosing to cycle, and I’ve recently subscribed to Mossy Earth after our CEO recommended it 👏🏼 Really nice project!
Q8. What advice would you give to someone wanting to follow a similar career to yours?
Don’t be afraid to try, fail, learn, and ask a lot of questions along the way. Also, find a community of like minded individuals that you can share your experiences with specifically as a PM or aspiring one.
0 notes
Text
5 Ways to Conduct Better User Experience Research
To survive in today’s app market, enterprises must invest in websites, apps, and services rooted in exceptional user experience. Creating that experience involves practicing design thinking and begins by establishing an extensive understanding of your target users’ lives and unmet needs.
The best way to go about gaining that understanding is simply by conducting user experience research. Unfortunately, for many companies, especially those on a limited development budget, pushing out a working product may be a higher priority than conducting user research. However, that can prove to be a fatal mistake. Not taking the time to do at least some user research to inform your product’s design may have a crippling, detrimental effect on your product’s success.
In this article, we will go over various low-cost, simple user experience research methods and discuss ways to use this research to improve the user experience for a successful customer-centered mobile app.

hbspt.cta.load(1789978, '09471573-02ea-493d-b02f-a614c5c1d7d8', {});
Why Is UX Research So Important?
A mobile app’s UX influences how users perceive the product. Users search for apps that provide value, are easy to use, and help them fulfill a goal. The UX ultimately determines if a user will return to your app or delete it altogether, possibly giving it a poor review. According to UX Designer Nick Babich, “The best products do two things well: features and details. Features are what draw people to your product. Details are what keep them there.”
The startling truth is that 25 percent of users stop using an app just after one use. Why? Although there are many reasons, the most prominent one is not finding the immediate value in the app. User experience research not only helps UX designers to better understand the likes and dislikes of their audience but also helps them either validate or invalidate initial product ideas to guide the development of the product. If done correctly, user experience research will reveal different mindsets, motivations, pain points, and behaviors of a targeted user group. These key factors ultimately decide if a product will be successful or not.
Types of Research You Can Conduct
Numerous methodologies have proven to be effective in producing quality results. Often the methods used are split into two categories: qualitative and quantitative.
Qualitative — observational findings, emotions, and human behaviors.
Quantitative — metrics and actual data.
Each type of data will help you gain insights that will help you throughout the development process. For example, the qualitative data you gather will help identify new opportunities and trends. Quantitative research provides businesses with numerical and statistical information, which can be hugely influential in convincing stakeholders to buy in and invest in a project or concept.
Here are some examples of the data you might collect:
Qualitative — During the user testing, some participants had to re-read the first paragraph on the landing page before they understood the message.
Quantitative — The average time spent on the checkout page is 17.3 seconds.
Below are some common user experience research methods:
Usability Testing
Use this methodology when you have a product or a prototype ready, and you need to test it with users. Before you launch it, it’s good to get constructive feedback from your users/potential users and see if they are stuck somewhere or don’t understand something.
A/B Testing
Use this research method to analyze what options are most popular amongst your target audience. You can give your users two interfaces to try out, for example, and depending upon their preference; you can choose to move forward with the one they connect with most.
Survey/Questionnaire
Preliminary surveys and questionnaires are straightforward and provide a critical channel for collecting data from potential users. By answering a set of questions, businesses can learn their target audience values, expectations, pain points, etc. This research method is cost-effective and can return large amounts of data. Furthermore, researchers can even ask why users decided to use a competitor’s app and gain insight into how they found it and what motivated them to continue to use that particular product.
Behavioral Analysis
Behavioral analysis is essential to understanding user traffic patterns. Often, behavior analysis is conducted alongside a survey to develop a clearer picture of why users are interacting the way they are. It is conducted by installing software on a participant’s device that will track how they navigate an app and how they use it.
Competitive Analysis
This research method is not only easy to conduct but is cost-effective and can provide great insights from a potential user base. For this research method, businesses need to identify their competitors and evaluate their mobile products for strengths and weaknesses to determine what prospective users think when using a competitor’s product. To do this, a researcher can provide users with their competitor’s app and gather data on how they interact with it.
Observational/Field Studies
A lab study places a user and a prototype of a mobile app in an environment where interactions between the two are observed. To gather meaningful information, this environment needs to resemble real-life situations to replicate how a user would actually use the product in their daily lives, and further evaluate whether the user can use the product as it is designed. Lab studies also allow researchers to interact with the subject and ask questions to gain further insights.
Journal/Diary
This research method involves having a user write down when, how, why, and other observations each time they use the app. This helps businesses and developers answer; when do users use our app? And in what contexts do they use our apps? This type of research also provides businesses with honest feedback that can reveal areas for improvement.
hbspt.cta.load(1789978, '09471573-02ea-493d-b02f-a614c5c1d7d8', {});
5 Ways to conduct better user experience research
Ensure research insights are actionable
Understand the actionable part of your research:
Does your team have a budget to take action? If the answer is no, your role might be to make a case for why more budget is necessary.
Are there core features that your target customers must have?
Are you timing the studies, so your research results have maximum impact?
Start your process with finding needs and gaps vs. selling solutions. In this age of information overload, too many meetings and cluttered inboxes, lead with ways for your audience to empathize, prioritize, and take action.
Good research should narrow the gap to the customer
There are ways to make the process of learning from research more personal: you can add a mix of real stories along with data, invite as many cross-discipline team members to be involved (while being practical about their time), and avoid the dreaded information dump at the end of a process by giving bite-sized updates.
Good presentation design matters. The presentation design shouldn’t overwhelm the information. Instead, incorporate the right image, visual or video clip rather than using a page full of text. Smaller chunks of data can make findings more palatable. It’s easy to get derailed by subjective opinions during share-outs (ex. I hate this shade of blue, I liked the old way better, etc.). Focus discussion around the customer, the hypothesis, and how well a proposed solution ultimately adds value to the customer.
Anticipate that things will go wrong
First, determine the right questions — what can feasibly be answered or can’t be answered with research and given method. Second, remember to over-recruit participants, assuming there will be no-shows, and that some people might just not be a good fit for the study even with a careful screener. Be wary of scope creep from too many stakeholders.
With any live session, there may be issues with call quality, connection, or video. Try to have a backup for prototypes, such as a simple slideshow presentation. Make sure to pilot the sessions as it’s easy to miss things once you’ve begun feeling comfortable with the content.
Moderate with the audience in mind
Ramp up your question difficulty, to help someone get adjusted to the conversation.
The experience of sharing feedback on a product is not always natural. You have to speak your thoughts aloud to a stranger (who might be rapidly taking notes), sometimes over the internet. Your role as a researcher is to set expectations for how the session will go and make the person on the other side feel comfortable as they can be given the situation.
Note the contradictions between behavior and what people say. People enjoy helping others and are generally agreeable by nature. They will try to answer the question you ask and give you the answers you want (even if the question is poorly constructed).
Track the core questions
Grouping questions under themes can help as you may be able to solve multiple problems in fewer actions. Note whether you’re trying to understand “why” (qualitative) vs. “how many, how much, how often” (quantitative) questions. There’s a bias toward generalizing big data because the numbers involved can feel impressive and fail-proof— surveying 500 people may appear to be a great thing as opposed to just doing interviews with five subject matter experts. Yet without understanding the “why” behind actions, observing, and listening for needs beyond what is obvious, big data can become a crutch for speculating that we already know what we’re looking for. It’s ok to end up with more questions, as long as they are better questions.
Final Takeaways
Consumers don’t want to jump from product to product, but instead find a brand that is designed to please them. Businesses that place value and importance on this will be the ones to see repeat visits, and eventually, new customers. User experience research is just one way to ensure you always keep their end-user top-of-mind when designing a mobile product. By employing the methods and tips listed above, you will be giving yourself the best chance to understand what your users like and don’t like truly. In an oversaturated market, that can be the difference between repeat usage or someone deleting your product.
hbspt.cta.load(1789978, '09471573-02ea-493d-b02f-a614c5c1d7d8', {});
5 Ways to Conduct Better User Experience Research published first on https://gpshandyorten.tumblr.com/
0 notes
Text
"Science is science" and post-positivism
Dondelinger: Welcome to Remedial Science 1A. My wife recently passed away. I thought that maybe teaching would ease my loneliness. Homer: Will this be on the test? Dondelinger: No! Homer: Ohhh.
The Simpsons, Season 4, Episode 19 - The Front
In the wake of the Government's completely batshit herd immunity strategy collapsing under public pressure, you may have heard or read about how "the science changed".

Credit: @tristandross on Twitter
Let me be clear (obama voice), the media are totally complicit in serving out their lines as unfiltered propaganda, but also in trying to protecting the Government and it's positions as they became ever more untenable. But this post isn't about them (much). Honestly, I'm not really sure how to describe the content of this post.
I don't know how the average person concieves of public policy decisions, but this is my version. There are two very key philosophical underpinnings to making good policy decisions, ontology and epistomology.
Ontology is the study of the nature of being, becoming, existence, and reality, whereas epistomology deals with the nature of knowledge. Pretty broad concepts, what has this got to do with making policy and a public health crisis in the 21st century? Well during that whole neoliberal turn in the 70s (you hate to see it), these concepts fell out of favour and we saw the rise of "evidence based policymaking".
Essentially, once a problem is identified, evidence is used to formulate approaches to tackle it, with the decision based on weighing up such analysis. The implementation also generates further evidence to refine the process. This follows the model (i.e. fake bullshit) of the policy cycle. It also enables those in power to dismiss ideas on the basis they aren't evidence based if they don't fit within the dominant framework.
But this doesn't question what evidence is used, how it was collected, whether the act of gathering evidence had any effect on the data you are now using. I really think of this as very analogous to what we're increasingly seeing come out of silicon valley. It's been pointed out by numerous others the way that many apps out there essentially harken back to centuries old, racist, and most importantly debunked, concepts like phrenology. This is because they do not question their underlying datasets, and just assume they are right and true. Its a good example of unconscious bias too. Think back to when digital cameras became a thing, you might remember a number of stories about how the auto focus or face recognition wouldn't pick up people with darker skin tones. It's the same thing. This is because a lot of this "AI" and "machine learning" bullshit is taught on racist data sets. It's like the classic white nationalist "FBI crime statistics" argument. They simply don’t question whether their data is actually valid or not, or understand the situations under which it was collected.
So where does this leave us with policy?
Rather than a self-evident object, policy means different, and often contradictory, things to different people. Different understandings of policy lead to different ways to conduct evidence gathering, analysis, and implementation. This is where we introduce (post)positivism. The positivists of the world posit (lol) independence between the researcher and the researched.
Positivism treats the social world like the natural world, due to something known as object detachment. We all live in a world of meanings and symbolism, humans are self-interpreting. To understand ones intentions, you must understand the world through their eyes. So to understand decisions, you must understand the meaning behind them, what drives them. This is where post positivism comes in. Post-positivism argues that the sum total of meanings and symbols from the world we live in affect the researcher and influence what is observed.
The linguistic turn in western philosophy of the late 19th and early 20th century was replicated in policy approaches decades later as a response to positivist approaches to policy analysis. Known as the ‘argumentative turn' - it's an example of a post-positivist approach. It treats policy making as encounters between different viewpoints (and meanings) in relation to a particular issue.
But there's a major problem with the argumentative turn - despite its key insight of multiple, conflicting interpretations being simultaneously at play - it neglects power, i.e. why some viewpoints and meanings might become dominant over others, for reasons other than sheer persuasiveness
Another post-positivist methodology is ‘discourse analysis’. What you are looking to understand is how this technique can be used to reveal deeper insights into the making of policy. Note, as an aside, ideological values can be shared even across rival political parties i.e. the Conservatives and New Labour, the Democrats and Republicans, etc. This tells us analysis should not focus on ‘the end’ of the policy process, but decisions/outcomes throughout the process. (Consider, for example, how we analyse policies adopted in response to the 2008 financial crisis) Discourse analysis is concerned with figuring out how a given policy came to be adopted – i.e. to solve what ‘problem’, by whom, with what assumed theories (e.g. the idea of deterring smoking by raising taxes on cigarettes is based on the theory that if prices rise, consumption drops).
This is not to say that positivist approaches (e.g. using statistical analysis) are not useful, but we must be conscious about what exactly is being studied. For example, we can usefully track ‘poverty’ using numbers (wages, disposable incomes, cost-of-living, etc.) but it can generate viable policy responses only if we are certain what exactly it means to be ‘poor’ (Is it simply not having sufficient income?).
But, (neo)positivist (e.g. quantitative) approaches are demonstrably insufficient (even if it remains the dominant approach adopted by many analysts) and shows what post-positivist (qualitative) approaches are concerned to emphasize.
So, what of it?
Well, whenever people in the media or politicians use utterly facile phrases like "the science has changed", hopefully you'll have a better idea of what that science actually is, or means.
In the case of this coronavirus crisis, the science was always clear. The way it was interpreted and acted upon by the Government was a choice, and they’re scrambling to react now their old strategy was blown apart.

ENDS
0 notes
Text
Artificial Intelligence in Cyber Security Market: Global Industry Analysis & Forecasts up to 2030
The report on the global artificial intelligence in cyber security market provides qualitative and quantitative analysis for the period from 2017 to 2025. The report predicts the global artificial intelligence in cyber security market to grow with a CAGR of 22.0% over the forecast period from 2019-2025. The study on artificial intelligence in cyber security market covers the analysis of the leading geographies such as North America, Europe, Asia-Pacific, and RoW for the period of 2017 to 2025. The report on artificial intelligence in cyber security market is a comprehensive study and presentation of drivers, restraints, opportunities, demand factors, market size, forecasts, and trends in the global artificial intelligence in cyber security market over the period of 2017 to 2025. Moreover, the report is a collective presentation of primary and secondary research findings..
Request to Fill The Form To get Sample Copy of This Report: https://www.sdki.jp/sample-request-104397 Porter's five forces model in the report provides insights into the competitive rivalry, supplier and buyer positions in the market and opportunities for the new entrants in the global artificial intelligence in cyber security market over the period of 2017 to 2025. Further, IGR- Growth Matrix gave in the report brings an insight into the investment areas that existing or new market players can consider. Report Findings 1) Drivers • The increasing number of data breaches and cyberattacks 2) Restraints • Implementing AI in cybersecurity requires more resources and finances 3) Opportunities • Growing demand for cloud-based security solutions Research Methodology A) Primary Research Our primary research involves extensive interviews and analysis of the opinions provided by the primary respondents. The primary research starts with identifying and approaching the primary respondents, the primary respondents are approached include 1. Key Opinion Leaders associated with Infinium Global Research 2. Internal and External subject matter experts 3. Professionals and participants from the industry Our primary research respondents typically include 1. Executives working with leading companies in the market under review 2. Product/brand/marketing managers 3. CXO level executives 4. Regional/zonal/ country managers 5. Vice President level executives. B) Secondary Research Secondary research involves extensive exploring through the secondary sources of information available in both the public domain and paid sources. At Infinium Global Research, each research study is based on over 500 hours of secondary research accompanied by primary research. The information obtained through the secondary sources is validated through the crosscheck on various data sources. The secondary sources of the data typically include 1. Company reports and publications 2. Government/institutional publications 3. Trade and associations journals 4. Databases such as WTO, OECD, World Bank, and among others. 5. Websites and publications by research agencies Segment Covered The global artificial intelligence in cyber security market is segmented on the basis of offering, deployment type, security type, technology, application, and end-user. The Global Artificial Intelligence in Cyber Security Market by Offering • Hardware • Software • Service The Global Artificial Intelligence in Cyber Security Market by Deployment Type • Cloud • On-premise The Global Artificial Intelligence in Cyber Security Market by Security Type • Network Security • Endpoint Security • Application Security • Cloud Security The Global Artificial Intelligence in Cyber Security Market by Technology • Machine Learning • Natural Language Processing (NLP) • Context-aware Computing The Global Artificial Intelligence in Cyber Security Market by Application • Identity and Access Management • Risk and Compliance Management • Unified Threat Management • Data Loss Prevention • Security and Vulnerability Management • Fraud Detection/Anti-Fraud • Threat Intelligence • Intrusion Detection/Prevention System The Global Artificial Intelligence in Cyber Security Market by End-user • Enterprise • Manufacturing • BFSI • Retail • Government & Defense • Infrastructure and Healthcare • Others Company Profiles The companies covered in the report include • Intel Corporation • NVIDIA Corporation • Xilinx Inc • Samsung Electronics Co., Ltd • IBM Corporation • Micron Technology • Amazon Web Services, Inc. • Cylance Inc. • Vectra AI, Inc • ThreatMetrix Inc What does this report deliver? 1. Comprehensive analysis of the global as well as regional markets of the artificial intelligence in cyber security market. 2. Complete coverage of all the segments in the artificial intelligence in cyber security market to analyze the trends, developments in the global market and forecast of market size up to 2025. 3. Comprehensive analysis of the companies operating in the global artificial intelligence in cyber security market. The company profile includes analysis of product portfolio, revenue, SWOT analysis and latest developments of the company. 4. IGR- Growth Matrix presents an analysis of the product segments and geographies that market players should focus to invest, consolidate, expand and/or diversify.
The dynamic nature of business environment in the current global economy is raising the need amongst business professionals to update themselves with current situations in the market. To cater such needs, Shibuya Data Count provides market research reports to various business professionals across different industry verticals, such as healthcare & pharmaceutical, IT & telecom, chemicals and advanced materials, consumer goods & food, energy & power, manufacturing & construction, industrial automation & equipment and agriculture & allied activities amongst others.
For more information, please contact:
Hina Miyazu
Shibuya Data Count Email: [email protected] Tel: + 81 3 45720790
0 notes
Text
Richard Courchesne presents research about households relying on over-the-air antenna television for information, 12/6/2010.

vimeo
THE DAY STATIC DIED AND LEARNING BEGAN: Might digital antenna television become the cure to America’s failing education system? by Richard Courchesne MC5308 – Seminar in Advertising & Public Relations Dr. Jinbong Choi Texas State University – San Marcos [email protected]
November 22nd 2010 2010 Texas State University School of Journalism & Mass Communication, Fall 2010. Introduction: The following is a sociological experiment of the effective influence of broadcast television sub-channel communication: O + K.2 [CPM= GRP x 1000/aHH + s] = n (participant HH). Knowledge is power; the power of knowing how things work, and how to work them, is power at work. Humans are creatures of routine habits, mostly seeking the simplest means of accomplishing things while using the least amount of energy. Society’s lessons learned by those who grew-up with TV: Television is the greatest persuader, then and now. People want what’s seen on TV, the manufactured desires of ease, that causes people to drive rather than walk, Google rather than searching through an alphabetical directory, microwave rather than bake, and use an electronic calculator rather than a pencil. What’s a phonebook used for, anyhow? When people want to learn about something, they ask someone to “show them, or teach them how,” or learn from watching a television set. People prefer to learn any other way, than reading the words of written manuals with time-consuming boring in-depth instructions or directions. Relaxing by reading a good book is no longer the culturally favored leisure practiced by many in American society, today. Some researchers believe this phenomenon is a byproduct of an American school system that focuses on the “right answer, and pleasing authority figures,” or are media creating behavioral-engineered responses of human desire conjured-up by spin-masters hell bent of selling products not needed (Choi, 2010; Goldsworthy & Morris, 2008; Huffington, 2010; Pink, 2010; Wadsworth, 1998)? If television truly influences behavior, then allow it to help educate society on demand.
Purpose of study: The purpose of this qualitative and quantitative study is to identify the efficiency and effectiveness of advertising on sub-channel broadcast television stations in San Antonio, Texas area of dominant influence (ADI), by performing an analysis with valid empirical data and qualitative interviews approach to an informal research methodology in testing a hypothesis (Stacks, 2002): HQ: If a grocery provider “O” and a single broadcast station, “K.2,” (limitations) were to offer cardholders of redeemable government food stamps program (the dependent variables), special discount offers exclusively for ‘sub-canal’ watchers – “aHH + s,” (stimulus) who saw the ads watching a single sub-channel during a 60-day period (latency), and called-in or logged-into website (reaction) with special word (trigger) to receive a free magnetic discount coupon tracking card (incentive) from the broadcast TV station. This experiment is testing the effectiveness of promotional communication between a station and merchant to an audience and consumer in order to determine a count that could be calculated into an estimate cost per thousand (CPM), for the sub-channel “K.2.” Note: Possible collateral effect may cause station branding to occur. Therefore, O + K.2 [CPM= GRP x 1000/aHH + s] = n (participant HH).
Research Questions: RQ1: Does advertising or promoting a product on a broadcast OTA sub-channels prove to have a better cost per thousand (CPM), and greater value to a social-economic minded-audiences who rely on TV to keep informed, during the aftermath of “The Great Recession of 2008?” RQ2: Is the present national economic status causing households to abandon pay TV to seek alternative sources for television programming acquisition? Is American households tuning-in to over-the-air OTA television signal (antenna), or watching streaming Internet TV (broadband), or capturing smart-phone downloads (podcast)? RQ3: Has the influence of the Internet help change viewers perspective about conducting business using digital television? What is the future of OTA broadcast sub-channels, and fulfilling its promises from the past?
Methodology of quasi-experimental disposition. Phase I, Area of study: It is important to understand the unique characteristics of the demographics of the areas of dominant influence (ADI) selected for this experiment. San Antonio, Texas is a unique market because its inhabitants consist of the fasting growing minority in the country with the highest degree of spending power (U.S. Census, 2010). Hispanic-Latinos are the majority in the San Antonio ADI making up 53.79% of its population. Hispanic-Latino households consist of 16% of the nation’s population, in the other two selected ADI’s, Seattle-Tacoma’s Hispanic-Latino citizens are 7.76% of its populace, and the Austin ADI reports 29.23% of its households being of Hispanic-Latino decent (SRDS Media Solutions, 2009; U.S. Census, 2010). Therefore, the San Antonio ADI provides a naturally unique ethnicity dependent variable for the center of the area of study, which is not realized by any other U.S. metropolis, and its conveniently location for the researcher. Reportedly, the American Hispanic-Latinos are the fastest growing minority adding 3% each year to the national average, and are attributed with over a trillion-dollars of combined annual spending power (Hinojosa, 2010; Pew Hispanic Research, 2010). In a NPR radio report, Guy Garcia, a media consultant for Mentamentrix says that Univision, the largest Spanish-speaking network has overtaken English networks in the primary 18-49 demographic categories. “Univision is moving beyond bilingual, bicultural into a contextual identify” for the Hispanic-Latino audience, says Garcia (Garcia, 2010). The Hispanic-Latino market is desperately in need of research, being the smallest group without the means (credit rating), or operational knowledge (education) to gain access the Internet, information about this minority group is scarce (Najera, 2010). Without Internet access, the Hispanic-Latino household cannot easily provide comments or feedback about products or services, they relatively speaking, having no voice (Huffington, 2009; Najera, 2010; Subervi, 2008).
Methodology – Phase II, Sample group of study: This study is quasi-experimental research using a qualitative & quantitative methodology for analysis by identifying the independent variables as nearly the most current empirical demographic information available concerning the ADI of Seattle-Tacoma, Washington, San Antonio and Austin, Texas. Dependent variables include the number of digital converter boxes redeemed, and the volume of Hispanic-Latino ethnicity in each ADI. SRDS Media Solutions reports San Antonio, Texas Market Profiles Report of Lifestyle Ranking Index Category of Electronics & Computer indicates price is an issue for most households in the San Antonio ADI in purchasing “Hi-Tech” equipment, and accordingly the Internet is not the family’s primary entertainment source, even though nearly two-thirds of households own a PC (SRDS, 2009). During a radio interview with host Maria Hinojosa on the National Public Radio program Latino USA, Lolda Rosario, the director of the Multicultural Marketing Program at De Paul University, reports that the Hispanic-Latino market “is very young” and “very tech savvy,” while the older generations tend to avoid technology they cannot or do not understand. Rosario says many marketing strategies have tried to attract Latino dollars, but “too many strategies show no consistency,” and therefore fail to establish relevant integrity with its target audience (Hinojosa, 2010; Subervi, 2008). At the 2009 Conference on Human Factors in Computing System Proceeding of the 27th international conference Louis Barkuus states that “Television is increasingly viewed through computers in the form of downloaded or steamed content, yet computer based television consumption has received little attention” (Barkuus, 2009). In San Antonio, this trend is less obvious due to lack of personal Internet access. Barkuus, research study found that the uses and practices of subjects who have a higher than normal degree of technology knowledge and Internet access provided at school (students), download or stream “their television consumption through the Internet“ because they have the means. While nearly half the households in the San Antonio ADI may desire and “love to buy new gadgets and appliances,” only a quarter of them are early adopters with the means to be the “first to have new electronic equipment” (Barkuus, 2009; SRDS, 2009). The National Telecommunications and Information Administration Customer Service department received 51.7 million toll-free telephone calls requesting approval to receive a voucher to participate in the digital TV converter box coupon program. Out of the nearly 52 million calls, 35 million coupons were approved, a successful campaign of phenomenal response with a 54.4% redemption rate. Fourteen point seven million calls requested the information in Spanish or were part of the 7.5 million group who talked with a live representative agent (Locke, 2009). A New York Times article headline on June 13th 2009, the day after the ‘switch-over,’ reads “Changeover of Digital TV Off to a Smooth Start.” The report says that 112 million households out of the 114.5 million who rely on antenna television were prepared for the final switchover. This appears evident by the small number of phone calls television stations received after the end of analog TV and the beginning of the digital age (Locke, 2009). The Seattle-Tacoma market represents an average American city, and the Austin ADI was selected because of similar population size and its location in Texas.
Methodology – Phase III, Identifying the variables: The U.S. Census Bureau reports that 76% of the 9.1 million American-Hispanic children living in one of ten counties in Texas speak Spanish at home (U.S. Census, 2010). A Magnaglobal report indicates 60% of households are using television for background noise, 20% are genre-driven, and the remaining 20% are watching appointment TV. The ‘genre-driven’ audience refers to household viewers who are fond of viewing television, but are indifferent about scheduling a routine program time (Magnaglobal, 2010). In a national November 19th through 21st 1993 Gallup poll, entitled “Survey of the future functions of television;” movies on demand (21.99%) and television shows at your convenience (17.67%) were of the highest interest to households, while banking through TV (7.67%), buying groceries (5.36%), playing games (3%), and buying expensive items (1.1%) ranked in the bottom percentile (Gallup Brain, 1993). Today’s digital television stations have many of the capabilities, but have not offered these functions to its viewers as of date. This study is suggesting targeting a viewing audience consists of bilingual households of a lower social-economic stratification; this action may provide an opportunity for grocery providers to target an audience whose primary media source of communication is in over-the-air (OTA) antenna television. Broadcast stations could test this theory by offer magnetic tracking discount cards rewarding viewers of sub-channel programming who use monthly guaranteed food stamp funds with great savings . The Market Profile of Food & Beverages Lifestyles of households in the San Antonio ADI reports a significant number of people “often snack between meals” and are “swayed by coupons” to purchase “easy to prepare” food “regardless of calories” (SRDS, 2009). Discounts could be focused on products that correspond to this profile.
Methodology – Phase IV, Content Analysis: According to the Nielsen Company and KSAT-TV general sales manager and research team, the San Antonio, Texas market television consists of 844,910 households, 11.8% (99,699.38) or nearly 100,000 households are using over-the-air (OTA) antenna to receive free-HDTV and SD programming while nearly two-thirds of the households own a personal computer (SRDS, 2009; Schmidt & Carnezale, 2010). Households using an OTA outdoor amplified antenna are also able to receive additional programming, not presently seen on cable, satellite, or Internet. This programming is narrowcasting to a specific audience on local sub-channels using the point two, three, four and five of digital television (DTV) assigned frequency (Schmidt et al, 2010). There are ten (10) primary DTV stations and sixteen (16) sub-channels in the San Antonio area of dominant influence (ADI). As far as San Antonio lifestyles regarding finances, most households “know nothing about investing” and “prefer to pay cash” for the things they buy. While there are slightly more females in San Antonio ADI than males, “family and faith” are the two primary influences in most households, and everyone is looking for a bargain. The average family households income is $68,355 earned mostly by white-collar workers who travel 15 to 29 minutes to work (SRDS, 2009).
Results of the analysis: The following is a disquisition of the demographic, psychographic, lifestyles of households in the San Antonio area of dominant influence (ADI), determining specific characteristics related to the social-economic nomenclature of a target audience and specific merchant product requiring the use of over-the-air (OTA) antenna to receive television signals. Research data was gathered from the International Journal of Digital Television, CQ Researcher, The AWA Journal, Conference on Human Factors in Computing Systems Proceedings, The Toronto Star, National Telecommunications and Information Administration, SRDS Media Solutions (including The Nielsen Company, Experian Marketing Solutions, Inc., and PRIZM), The U.S. Census Bureau, and the Television Digest with Consumer Electronics. Interviews were conducted with General sales managers and research directors from the local television stations to gather data for the qualitative portion of the study.
Summary of research: Granted, most products are tools designed to save time, making living simpler, and paralyzing people. Where do the perspective consumers learn about places to go, to get the products they see, and obtain service or repair the things they have? Media. But, which ones, there are many: Newspaper, magazines, radio, television, cable, or the Internet? It’s a common fact that every household in America has at least one television in the house and a radio in the car, while not everyone has the convenience of Internet access (SRDS, 2009). Since many households in the ADI cut coupons for saving in groceries, the ‘Sub-channel coupon magnetic card‘ project can automate that task. Consumers benefit saving, grocers benefit with sales, and manufacturers benefit with tracking information. Internet TV is an independent variable based on the degree of video programming watched online. “As of the end of the second quarter of 2010, approximately 82.9 million households were online,” which calculates to 49% of TV households (Magnaglobal, 2010).
Conclusion of study: RQ1: Does advertising or promoting a product on a broadcast OTA sub-channels prove to have a better cost per thousand (CPM), and greater value to a social-economic minded-audiences who rely on TV to keep informed, during the aftermath of “The Great Recession of 2008?” Answer: Using Media Math’s formula based on the cost of commercial spot being $25 divided by one-eight (1/8) of the OTA antenna audience in the San Antonio ADI, approximately 12,500 households, the CPM is two dollars (Media Math, 2010). In the San Antonio ADI cable companies (Time-Warner and Grande including AT&T U-verse) make up 60% of the viewing audience with 506,946 households. Satellite television viewers using Dish network or Direct TV is equal 28.4% percent, or 239,954.44 households in the market ADI. The combine total number of households paying to use an Alternative Digital System (ADS) is 88.2% of the market, or 745,210.62 households. OTA antenna viewers make up 11.8% of the market representing 99,699.38 households (SRDS, 2010). Just as in the past when “Amplitude Modulated (AM) radio was still an important entertainment medium. AM radio reception was easily accessible to anyone,” so is OTA television (Thomas, 2008). “The days when antennas dotted the skyline of middle-class suburbia are gone forever, with cable and satellite dishes fulfilling the desires of an increasingly sophisticated television audience that will no longer settle merely for formulaic sitcoms, once-nightly national news and Wide World of Sports on Saturday afternoons (Kulig, 1997). This however, does not mean OTA television is dead, on the other hand it’s a feasible market with specific characteristics related to specific audiences. It may be a smaller target, but the broadcaster’s aim is much closer. Depending on your location in the GTA (General Transmission Area) , there are up to 25 channels of over-the-air uncompressed HDTV. Not all channels currently offered on cable or satellite is available, but the major broadcast networks are represented. The same programming that is on the standard channel is on the HDTV channel, often in high definition.” “There’s a secret in the air above the GTA. HDTV is being broadcast right now. Neither cable nor satellite is needed, just an amplified UHF antenna and a high-definition television with a digital tuner. And the best part: It’s free (Elston, 2008). Are there more and more households cutting cable off to watch free HDTV with an outdoor antenna? RQ2: Is the present national economic status causing households to abandon pay TV to seek alternative sources for television programming acquisition? Is American households tuning-in to over-the-air OTA television signal (antenna), or watching streaming Internet TV (broadband), or capturing smart-phone downloads (podcast)? Answer: Surprising, as it may seem, there remains a group of viewers committed to the antenna. “Attribute the phenomenon to nostalgia, stubbornness or a philosophical opposition to anything high tech, but those who work in the antenna installation field say business has been improving of late” (Kulig, 1997). Of course the cost of tuning-into digital television is an outdoor antenna and $0 per month. The average cable/satellite television subscription cost households approximately $50 per month. Cable Company’s subscriptions have been declining but according to Time-Warner Chief Operations Officer (COO) Landel Hobbs, he says, “the company doesn’t see any evidence of people dropping cable in favor of the Internet,” because, “the biggest subscriber losses” are “among people who don’t have cable broadband services.” Craig Moffett, an analysis for Sanford Bernstein, says “poor people have an excellent motive to cut cable and simple replace it with an antenna, or nothing at all.” Time-Warner has lost 155,000 subscribers during the 2010 July to September quarter, “compared to the 64,000 a year ago” (Svensson, 2010; Wright, 2010). According to Nielsen National Three Screen Report of the 1st Quarter of 2010, there are 286 million monthly viewers watching TV in the home (+.06%) for 158 hours and 25 minutes (+1.3%); 135 million viewers, mostly adults 18 to 49 years of age are watching Online video for 3 hours and 10 minutes (+3.3%), and 20.3 million viewers, who are mostly teens 12 to 17, are watching 3 hours and 37 minutes of downloaded video on a mobile phone (+51.2). “Consumers are adding video consumption platforms and not replacing them” (Nielsen, 2010). RQ3: Has the influence of the Internet help change viewers perspective about conducting business using digital television? What is the future of OTA broadcast sub-channels, and fulfilling its promises from the past? Answer: “We find that users personalize their viewing but that TV is still a richly social experience – not as communal watching, but instead through communication around television programs. We explore new possibilities for technology-based interaction around television” (Barkhuus, 2009). On June 2009 America made the switch from analog to digital television, the day static died, there were very few households loss in the transition (Locke, 2009). The National 1993 Gallup poll surveyed 376 participants (sample group) between November 19th and the 21st regarding questions about the future functions of television. This survey was taken during the introduction of ‘America On-line’ and pre-Windows 95 graphic user interface (GUI). Many of the promises made in the 1993 Gallup poll have not been honored. Results of the 1993 National Gallop poll question ask about a future functions of televisions which was offering households to “buy expensive items” using the TV is compared to the 2009 survey question that “Price is not an issue for Hi-Tech” found in the 2009 Media Solutions Lifestyle Category of Electronics & Computers Market Profile Report (SRDS, 2009). While some markets are willing to purchase high-dollar items over the Internet, DTV station don’t seem interested in targeting that market. According to the survey future digital stations were offering viewers movies on demand in 1993, however, today Netflix and pay TV offer this function at a premium price. Perhaps DTV stations, have not developed a scrambling method to block non-payers from receiving a signal, or the infrastructure is too expensive and difficult to maintain. With the advent of TiVo, DVD recorders and DVR, households can watch their favorite television shows at their own convenience. Yet another function has been taken over by a third-party operator, and not by a DTV station. Banking through TV is not offered today, but many of today’s Internet users conduct commerce and bank online, surely an adaptation that could easily be offered by DTV stations, but it isn’t. Q3: Buying groceries or Q2: playing games through the TV functions has also been replaced by online merchants who can fill grocery lists and deliver perishable foods products, instantly without any spoilage. For the gamers there are hundreds of first-person scenarios users can join into a networks with hundreds of game players the on the Internet simultaneously (Gallup Brain, 1993; SRDS, 2009).
Limitations of the study: The greatest limitation of this study is persuading a broadcast digital station to invest and participate and in the proposed ‘Sub-channel coupon magnetic card test’ to determine a seemingly accurate account of households using OTA antenna television in the ADI of study. Other limitations include the relatively short amount of time, framing for research, no survey information about sales of converter boxes from 2007 to 2010 in San Antonio ADI, unobtainable. David Walker spoke of a ‘Digital spectrum,’ methodology in measuring over-the-air antenna households, but did not receive the data within the latency of this research (Walker & Guzman, 2010). The researcher requesting information about the count of digital-converter boxes redeemed at their grocery chain in the San Antonio ADI, H.E.B. Public Relations department says because their company is a privately owned company, they were not able to disclose sales information.
Future Research & Recommendations: It is the recommendation of this researcher to propose a Federal feasibility study for public interest in a government funded pilot program to educate America using bilingual-education broadcast television stations. David Pink says it worries him that students “have been so indoctrinated into a school system that is focused on the right answer, and pleasing authority figures, that they have not allowed their intrinsic motivation to blossom” (Pink, 2010), thereby killing innovation and independent thought. According to Adrianna Huffington’s book Third World America, “If America’s school system was a horse, it would be shot,” but she doesn’t offer a viable solution, other than getting rid of bad teachers (Huffington, 2010). Academia wants to blame parenting, parents want to blame teachers, and everyone wants to blame TV. But, TV may be the answer to America’s education problems. School administrators want students to attend 2nd period , and students want to socialize rather than learn about anything. There are of course the exceptions to the rule, the overachievers, the teacher’s pet, and nerds. KFED-DTV network can educate those who cannot attend classes and the community. Viewers can watch or record daily classroom lectures. Those with Internet access can download an app to view practice exercise and homework assignment paperwork on a mobile device. TV stations across the U.S. started cutting their analog signals Friday June 12, 2009, ending a 60-year run for the technology and likely stranding more than 1 million unprepared homes without TV service. The Federal Communications Commission put 4,000 operators on standby for calls from confused viewers, and set up demonstration centers in several cities (Amendola, 2009). A $150 million literacy & educational federal grant is suggested to fund the project for 5 years, housing in operations in renovated buildings & side-mounting antennas. The planned KFED-DTV network daily programming transmissions begin at 600am SDT until 10:00pm Monday through Friday, continuously year round. Students & underwriters submit recordings of thirty-minute productions of Texas certified teacher follow standard TEAC curriculum. KFED network broadcasting day begins at 6am Monday thru Friday until 6pm. Each of the five (5) standard definition (SD) channels could be dedicated to a specified subject. In other words, channel .1 might teach English from 1st grade to 12th. Programming will stagger with the first half-hour in English and the second half-hour in Spanish. English will be taught in Spanish. The second sub-channel could teach Math, the third the Humanities, and so forth. Each KFED DTV stations can lease and move into abandoned buildings in the heart of the 15 selected areas of dominant influence (ADI) cities & towns for the pilot program once it receives a retrofit to operate a broadcast television station. Antennas (including microwave link) can be side mounted to existing television towers and the transmitter shack can be constructed at its base. Priming the pump to truly educate America. Prospective underwriters to support KFED annual budget after federal grant is exhausted: Valero Energy, H.E.B. Foods, Red McCombs Automotive, Kinetic Concepts and many more. Underwriters can immediately sponsor segments of educational program blocks and/or provide video productions for broadcasting. News updates, governmental messages, statewide educational scholarship and grant information. Weekend broadcast programming can consist of recordings of independent school district athletic events and/or theatre art plays and productions. Each station has autonomy for ADI of broadcast. Completion of this experiment can only work if a broadcast station and grocery provider can reach a mutual agreement to participate, and that would be OK.
References Barkhuus, Louise (April, 2009). Television on the Internet: new practices, new viewers. Conference on Human Factors in Computing Systems Proceedings of the 27th international conference extended abstracts on Human factors in computing systems. CHI 2009: Life, love, death. pp. 2479-2488. United States: ACM New York, New York.
Choi, Jinbong (2010). Seminar in Advertising & Public Relations. [Lecture]. Texas State University in San Marcos.
Elston, Brian J. (October 23, 2008). Look, up in the air! It’s 25 HDTV channels for free; if you can see CN Tower, indoor antenna should pull in most networks. The Toronto Star, Television pp x04.
Gallup Brain (November 19, 1993). Survey of the future functions of television. Retrieved November 19, 2010 from
Garcia, Guy (2010). [Podcast]. Latinos and the media. [Podcast]. Episode 921 18:50. NPR: Latino USA Podcast.
Goldstein, M. L. (2009). Digital Television Transition: Broadcasters Transition Status, Low-Power Station Issues, and Information on Consumer Awareness of the DTV Transition.
Goldsworthy, Simon & Morris, Trevor (2008). Spin, Public Relations, and the Shaping of the Modern Media. PR: A Persuasive Industry. From PR to Propaganda: The persuasive industry’s problem with definitions. Palgrave Macmillan.
Greenblatt, Alan (February 16, 2007). Television’s Future: Will TV remain the dominant mass medium? CQ Researcher v17 n7 pp. 145-168.
Hart, Jeffrey A. (2010). The Transition to Digital Television in the United States: The End Game. International Journal of Digital Television v1 n1. Indiana University.
Hendrix, Jerry A. (1998). Public Relations Cases, 4th ed. Belmont, California: Wadsworth.
Hinojosa, Maria (2010). Attracting Latino dollars. [Podcast]. Episode 921 18:50. NPR: Latino USA Podcast.
Huffington, Arianna (2010). Third World America: How politicians are abandoning the middle class and betraying the American dream. Crown Publishing.
Jost, Kenneth (June 20, 2008). Transition to Digital Television: Are broadcasters and viewers ready for the switch? CQ Researcher v18 n13 pp. 529-552.
Kulig, Paula (March 15, 1997). The Globe and Mail. The Arts: Television p. C23.
Locke, Gary (Secretary) (December 2009). Outside the Box: The Digital TV Converter Box Program. U.S. Department of Commerce, National Telecommunications and Information Administration and TV Converter Box Coupon Program.
Magnaglobal On-Demand Quarterly (October 2010). Updated Internet Access, DVR, VOD Forecast: Introducing Over The Top Story Forecast.
Media Math, NTC Publishing (2010). Finding CPM from CPP.
Nielsen Three Screen Report (2010). Multi-Screen Insight: TV, Internet and Mobile Usage. 1st Quarter. United States: The Nielsen Company.
Najera, Marcos (2010). VozMob: Turning day laborers into citizen journalists. [Podcast]. Episode 920 18:50. NPR: Latino USA Podcast.
Pew Hispanic Research (2010).
Phillips, Mary Alice Mayer (1972). CATV; A History of Community Antenna Television.
Pink, Daniel (February 19, 2009). A Whole New Mind. United States: Penguin Group.
Senuta, Pamela (November 19, 2010). KENS TV Channel 5, San Antonio, Texas. [Interview]. Research Director.
Schmidt, Randy & Carnezale, Greg (November 19, 2010). KSAT-TV channel 12, San Antonio, Texas. [Interview]. General Sales Manager & Research Director.
SRDS Media Solutions (2009). Market Profiles Reports: Designated Market Area, San Antonio, Texas compiled by Experian Marketing Solutions & The Nielsen Company.
Stacks, Don W. (2002). Primer of Public Relations Research. The Guilford Press.
Subervi-Velez, Federico A. (2008). The Mass Media and Latino Politics: Studies of U.S. Media Content, Campaign Strategies and Survey Research: 1984-2004. United States, New York: Routledge, Taylor & Francis.
Svensson, Peter (November 8, 2010). Cable Subscribers Flee, But is Internet To Blame? Tech Trends. Retrieved November 20, 2010 from https://ift.tt/2s58Jsl.
Television Digest with Consumer Electronics (June 9, 1997). New antennas coming for digital TV v 37 i23 p13, 2p.
Thomas, Ronald R. (2008). Television Reception in the 1950’s: A Coming of Age. The AWA Journal, On-line Edition, Antique Wireless Association, Inc.
U.S. Census Bureau (July 15, 2010). Newsroom. Retrieved November 20, 2010 from https://ift.tt/1Bw4HEI.
Walker, David & Guzman, Elizabeth (October 14, 2010). WOAI TV Channel 4, San Antonio, Texas. [Interview]. General Sales Manager and Research Director.
Warren, Ted S. (2009). Associated Press.
Wright, Judy (November 19, 2010). Time-Warner cable San Antonio, Texas. [Interview]. General Sales Manager. Likes: 6 Viewed:
The post Richard Courchesne presents research about households relying on over-the-air antenna television for information, 12/6/2010. appeared first on Good Info.
0 notes
Photo

A Deep Dive into User Research Methods
User research plays a crucial role in shaping any successful product or service. It keeps the user at the heart of the experience by tailoring it to their needs, and in turn provides real advantage over competitors. But with a growing arsenal of different research methods out there, it can be a challenge to know which is best to use, and when.
This guide offers an overview of the fundamentals for each of the most commonly used methods, providing direction on when to use them — and more importantly, why.
We’ll cover:
the origins of user research
discovery and exploratory research
quant and qual, and the difference between them
core methodologies:
user interviews
ethnography and field studies
surveys and questionnaires
analytics and heatmaps
card sorts and tree tests
usability studies
further reading and resources
key takeaways
The Origins of User Research
Product designers and engineers have incorporated user feedback into their process for centuries. However, it wasn’t until 1993 that the term “user experience” (UX) was coined by Don Norman during his time at Apple.
As the discipline of UX evolved and matured, practitioners began to use investigative research techniques from other fields, such as science and market research. This enabled decisions to be informed by the end user, rather than the design teams’ assumptions, laying the groundwork for UX research as we know it today.
That’s a quick rundown of the origins. Now let’s dive into some research frameworks.
Discovery and Evaluative Research
User-centered design means working with your users all throughout the project — Don Norman
Broadly speaking, user research is used to either discover what people want and need or evaluate if ideas are effective. The methods to achieve these two distinct outcomes can be loosely divided into two groups.
Strategize: Discovery Research
Methods that help to answer unknowns at the beginning of a project can be referred to as Discovery Research. These methods range from reviewing existing reports, data and analytics to conducting interviews, surveys and ethnographic studies. These methods ensure that you have a solid understanding of who your user is, what they need and the problems they face in order to begin developing a solution.
Execute and Assess: Evaluative Research
Once a clearer picture of the end user and their environment has been established, it’s time to explore possible solutions and test their validity. Usability studies are the most common method employed here. Evaluative research provides you with the knowledge you need to stay focussed on the user and their specific requirements.
Examples
Discovery Research Methods Evaluative Research Methods
field study
diary study
one-to-one interview
focus group
behavioral analytics review
open card sort
email survey
contextual inquiry
remote usability testing
closed card sort
tree test
benchmarking analytics review
heatmaps
popup poll
usability benchmark testing
impression testing
Quant and Qual, and the Difference Between Them
Although every design problem is different, it’s generally agreed that a combination of both qualitative and quantitative research insights will provide a balanced foundation with which to form a more successful design solution. But what do these pronunciation-averse words mean?
Quantitative (statistical) research techniques involve gathering large quantities of user data to understand what is currently happening. This answers important questions such as “where do people drop off during a payment process”, or “which products were most popular with certain user groups” and “what content is most/least engaging”.
Quantitative research methods are often used to strategize the right direction at the start of a project and assess the performance at the end using numbers or metrics. Common goals include:
comparing two or more products or designs
getting benchmarks to compare the future design against
calculating expected cost savings from some design changes
Quantitative data analysis can offer useful insights such as abandonment points on a form. This can lead to further qualitative studies to understand why.
Qualitative (observational) research techniques involves directly observing small user groups to understand attitudes, behaviors and motivations. This is where we begin to understand why something is happening and how to solve a problem.
You can optimize everything and still fail. That’s where qualitative approaches come in. By asking “why”, we can see the opportunity for something better beyond the bounds of the current best. ― Erika Hall
Qualitative research methods are also used to strategize the right direction at the start of a project, and to inform design decisions throughout the ideation process. Common goals include:
to uncover trends in thoughts and opinions
understand a problem more deeply
to develop a hypothesis for a quantitative research study
Christian Rohrer authored a popular framework for understanding user research methods, illustrating where 20 popular methods appear along three dimensions, including quantitative and qualitative. Source.
Core Methodologies
So that’s enough of the background behind the methods. Let’s dive into the methods themselves. It’s worth noting that, since every project is different, there’s no quick way of strictly stating which method is best for what. However, pros and cons have been listed for each.
1. User interviews
Qualitative | Discover/Evaluate
Interviews allow you to ask questions to help see things from the participants’ perspective. They are usually recorded and later analyzed to find out what the beliefs, attitudes and drivers of users are, alongside uncovering new considerations to aid with ideation.
Stories are where the richest insights lie. Your objective is to get to this point in every interview. — Steve Portigal
Interview length, style and structure can vary depending on what you’re trying to achieve, and the access to and availability of participants. The following are some different types of interviews.
One-to-one interviews are often conducted in a lab or coffee shop, but can be undertaken almost anywhere with a little preparation. In-person interviews are preferable to remote (via phone or video) as they offer additional insights through body language. Sessions are conducted with questions that loosely follow a discussion guide. This allows you to uncover new learnings around an objective and not get sidetracked.
Focus groups are used to gain a consensus from a group of 3–10 representatives of a target audience when you’re short on time or availabile participants. Focus groups take the form of discussions and exercises and are a good way of assessing what people want from a product or service and their opinions on things. They’re not recommended for evaluating interface usability, due to their lack of focus and the potential for groupthink bias.
Contextual inquiry interviews are the holy grail of interview methods. They’re conducted within the participants’ everyday environment whilst they go about their daily activities. A researcher can observe a participant and discuss what they did, and why, whilst the activities take place. Unlike other interviews, the researcher usually summarizes the findings back to the participant at the end, offering them a chance to give final corrections and clarifications. This method is used to generate highly relevant and reliable insights from real situations, but it can be very time consuming.
For more on user interviews, there’s some great resources on the Interaction Design Foundation website.
2. Field Studies
Qualitative | Discover
Field studies involve observing people as they interact with a product, service, or each other, in their natural working or living environment (rather than in a lab) to better understand user behavior and motivations in context. These studies are usually conducted over longer periods of time than most other methods, recording extensive field notes for later analysis.
Ethnographic research involves researchers actively participating within a group setting, becoming the subject themselves. This method is particularly useful when studying a target audience that is culturally or socially different from your own, and it can uncover lots of unknowns and important considerations.
Direct observation involves passively observing from a distance (like a curious fly on a wall), allowing researchers to uncover problems and workarounds in user journeys and flows (such as retail store layouts), and also allowing for future improvements.
User logs involve diary studies and video journals, and are sometimes referred to as the “poor man’s field study”. They allow the user to generate the data for you by recording their experiences with the focus of the study at a specific time each day over a period of time. The real-time insights provided can be useful for understanding long-term behaviors such as habits, workflows, attitudes, motivations, or changes in behavior.
The post A Deep Dive into User Research Methods appeared first on SitePoint.
by Mark Seabridge via SitePoint http://bit.ly/2WKxxDX
0 notes