#only tagging ECR for consistency
Explore tagged Tumblr posts
Visit Tumblr Blog
Explore Tumblr blogs with no restrictions, modern design and the best experience.
Last Seen Tumblr Blogs


Fun Fact
Kazakhstan’s Minister of Communications and Informatics has blocked the Tumblr site because it contained 60 sites of terrorism, extremism, and pornography in 2015.
Text


RINUS VEEKAY passes ÁLEX PALOU for the lead on lap 3 of the 2023 INDIANAPOLIS 500
#indycar#rinus veekay#alex palou#ed carpenter racing#chip ganassi racing#only tagging ECR for consistency#anyways hello to my beautiful followers and mutuals…..hope you all are doing well 🩵#i miss indycar so much oh my god COME BACK TO ME#ciara.gifs
9 notes
·
View notes
Text
Strangulating bare-metal infrastructure to Containers
Change is inevitable. Change for the better is a full-time job ~ Adlai Stevenson I
We run a successful digital platform for one of our clients. It manages huge amounts of data aggregation and analysis in Out of Home advertising domain.
The platform had been running successfully for a while. Our original implementation was focused on time to market. As it expanded across geographies and impact, we decided to shift our infrastructure to containers for reasons outlined later in the post. Our day to day operations and release cadence needed to remain unaffected during this migration. To ensure those goals, we chose an approach of incremental strangulation to make the shift.
Strangler pattern is an established pattern that has been used in the software industry at various levels of abstraction. Documented by Microsoft and talked about by Martin Fowler are just two examples. The basic premise is to build an incremental replacement for an existing system or sub-system. The approach often involves creating a Strangler Facade that abstracts both existing and new implementations consistently. As features are re-implemented with improvements behind the facade, the traffic or calls are incrementally routed via new implementation. This approach is taken until all the traffic/calls go only via new implementation and old implementation can be deprecated. We applied the same approach to gradually rebuild the infrastructure in a fundamentally different way. Because of the approach taken our production disruption was under a few minutes.
This writeup will explore some of the scaffolding we did to enable the transition and the approach leading to a quick switch over with confidence. We will also talk about tech stack from an infrastructure point of view and the shift that we brought in. We believe the approach is generic enough to be applied across a wide array of deployments.
The as-is
###Infrastructure
We rely on Amazon Web Service to do the heavy lifting for infrastructure. At the same time, we try to stay away from cloud-provider lock-in by using components that are open source or can be hosted independently if needed. Our infrastructure consisted of services in double digits, at least 3 different data stores, messaging queues, an elaborate centralized logging setup (Elastic-search, Logstash and Kibana) as well as monitoring cluster with (Grafana and Prometheus). The provisioning and deployments were automated with Ansible. A combination of queues and load balancers provided us with the capability to scale services. Databases were configured with replica sets with automated failovers. The service deployment topology across servers was pre-determined and configured manually in Ansible config. Auto-scaling was not built into the design because our traffic and user-base are pretty stable and we have reasonable forewarning for a capacity change. All machines were bare-metal machines and multiple services co-existed on each machine. All servers were organized across various VPCs and subnets for security fencing and were accessible only via bastion instance.
###Release cadence
Delivering code to production early and frequently is core to the way we work. All the code added within a sprint is released to production at the end. Some features can span across sprints. The feature toggle service allows features to be enabled/disable in various environments. We are a fairly large team divided into small cohesive streams. To manage release cadence across all streams, we trigger an auto-release to our UAT environment at a fixed schedule at the end of the sprint. The point-in-time snapshot of the git master is released. We do a subsequent automated deploy to production that is triggered manually.
CI and release pipelines
Code and release pipelines are managed in Gitlab. Each service has GitLab pipelines to test, build, package and deploy. Before the infrastructure migration, the deployment folder was co-located with source code to tag/version deployment and code together. The deploy pipelines in GitLab triggered Ansible deployment that deployed binary to various environments.
Figure 1 — The as-is release process with Ansible + BareMetal combination
The gaps
While we had a very stable infrastructure and matured deployment process, we had aspirations which required some changes to the existing infrastructure. This section will outline some of the gaps and aspirations.
Cost of adding a new service
Adding a new service meant that we needed to replicate and setup deployment scripts for the service. We also needed to plan deployment topology. This planning required taking into account the existing machine loads, resource requirements as well as the resource needs of the new service. When required new hardware was provisioned. Even with that, we couldn’t dynamically optimize infrastructure use. All of this required precious time to be spent planning the deployment structure and changes to the configuration.
Lack of service isolation
Multiple services ran on each box without any isolation or sandboxing. A bug in service could fill up the disk with logs and have a cascading effect on other services. We addressed these issues with automated checks both at package time and runtime however our services were always susceptible to noisy neighbour issue without service sandboxing.
Multi-AZ deployments
High availability setup required meticulous planning. While we had a multi-node deployment for each component, we did not have a safeguard against an availability zone failure. Planning for an availability zone required leveraging Amazon Web Service’s constructs which would have locked us in deeper into the AWS infrastructure. We wanted to address this without a significant lock-in.
Lack of artefact promotion
Our release process was centred around branches, not artefacts. Every auto-release created a branch called RELEASE that was promoted across environments. Artefacts were rebuilt on the branch. This isn’t ideal as a change in an external dependency within the same version can cause a failure in a rare scenario. Artefact versioning and promotion are more ideal in our opinion. There is higher confidence attached to releasing a tested binary.
Need for a low-cost spin-up of environment
As we expanded into more geographical regions rapidly, spinning up full-fledged environments quickly became crucial. In addition to that without infrastructure optimization, the cost continued to mount up, leaving a lot of room for optimization. If we could re-use the underlying hardware across environments, we could reduce operational costs.
Provisioning cost at deployment time
Any significant changes to the underlying machine were made during deployment time. This effectively meant that we paid the cost of provisioning during deployments. This led to longer deployment downtime in some cases.
Considering containers & Kubernetes
It was possible to address most of the existing gaps in the infrastructure with additional changes. For instance, Route53 would have allowed us to set up services for high availability across AZs, extending Ansible would have enabled multi-AZ support and changing build pipelines and scripts could have brought in artefact promotion.
However, containers, specifically Kubernetes solved a lot of those issues either out of the box or with small effort. Using KOps also allowed us to remained cloud-agnostic for a large part. We decided that moving to containers will provide the much-needed service isolation as well as other benefits including lower cost of operation with higher availability.
Since containers differ significantly in how they are packaged and deployed. We needed an approach that had a minimum or zero impact to the day to day operations and ongoing production releases. This required some thinking and planning. Rest of the post covers an overview of our thinking, approach and the results.
The infrastructure strangulation
A big change like this warrants experimentation and confidence that it will meet all our needs with reasonable trade-offs. So we decided to adopt the process incrementally. The strangulation approach was a great fit for an incremental rollout. It helped in assessing all the aspects early on. It also gave us enough time to get everyone on the team up to speed. Having a good operating knowledge of deployment and infrastructure concerns across the team is crucial for us. The whole team collectively owns the production, deployments and infrastructure setup. We rotate on responsibilities and production support.
Our plan was a multi-step process. Each step was designed to give us more confidence and incremental improvement without disrupting the existing deployment and release process. We also prioritized the most uncertain areas first to ensure that we address the biggest issues at the start itself.
We chose Helm as the Kubernetes package manager to help us with the deployments and image management. The images were stored and scanned in AWS ECR.
The first service
We picked the most complicated service as the first candidate for migration. A change was required to augment the packaging step. In addition to the existing binary file, we added a step to generate a docker image as well. Once the service was packaged and ready to be deployed, we provisioned the underlying Kubernetes infrastructure to deploy our containers. We could deploy only one service at this point but that was ok to prove the correctness of the approach. We updated GitLab pipelines to enable dual deploy. Upon code check-in, the binary would get deployed to existing test environments as well as to new Kubernetes setup.
Some of the things we gained out of these steps were the confidence of reliably converting our services into Docker images and the fact that dual deploy could work automatically without any disruption to existing work.
Migrating logging & monitoring
The second step was to prove that our logging and monitoring stack could continue to work with containers. To address this, we provisioned new servers for both logging and monitoring. We also evaluated Loki to see if we could converge tooling for logging and monitoring. However, due to various gaps in Loki given our need, we stayed with ElasticSearch stack. We did replace logstash and filebeat with Fluentd. This helped us address some of the issues that we had seen with filebeat our old infrastructure. Monitoring had new dashboards for the Kubernetes setup as we now cared about both pods as well in addition to host machine health.
At the end of the step, we had a functioning logging and monitoring stack which could show data for a single Kubernetes service container as well across logical service/component. It made us confident about the observability of our infrastructure. We kept new and old logging & monitoring infrastructure separate to keep the migration overhead out of the picture. Our approach was to keep both of them alive in parallel until the end of the data retention period.
Addressing stateful components
One of the key ingredients for strangulation was to make any changes to stateful components post initial migration. This way, both the new and old infrastructure can point to the same data stores and reflect/update data state uniformly.
So as part of this step, we configured newly deployed service to point to existing data stores and ensure that all read/writes worked seamlessly and reflected on both infrastructures.
Deployment repository and pipeline replication
With one service and support system ready, we extracted out a generic way to build images with docker files and deployment to new infrastructure. These steps could be used to add dual-deployment to all services. We also changed our deployment approach. In a new setup, the deployment code lived in a separate repository where each environment and region was represented by a branch example uk-qa,uk-prod or in-qa etc. These branches carried the variables for the region + environment. In addition to that, we provisioned a Hashicorp Vault to manage secrets and introduced structure to retrieve them by region + environment combination. We introduced namespaces to accommodate multiple environments over the same underlying hardware.
Crowd-sourced migration of services
Once we had basic building blocks ready, the next big step was to convert all our remaining services to have a dual deployment step for new infrastructure. This was an opportunity to familiarize the team with new infrastructure. So we organized a session where people paired up to migrate one service per pair. This introduced everyone to docker files, new deployment pipelines and infrastructure setup.
Because the process was jointly driven by the whole team, we migrated all the services to have dual deployment path in a couple of days. At the end of the process, we had all services ready to be deployed across two environments concurrently.
Test environment migration
At this point, we did a shift and updated the Nameservers with updated DNS for our QA and UAT environments. The existing domain started pointing to Kubernetes setup. Once the setup was stable, we decommissioned the old infrastructure. We also removed old GitLab pipelines. Forcing only Kubernetes setup for all test environments forced us to address the issues promptly.
In a couple of days, we were running all our test environments across Kubernetes. Each team member stepped up to address the fault lines that surfaced. Running this only on test environments for a couple of sprints gave us enough feedback and confidence in our ability to understand and handle issues.
Establishing dual deployment cadence
While we were running Kubernetes on the test environment, the production was still on old infrastructure and dual deployments were working as expected. We continued to release to production in the old style.
We would generate images that could be deployed to production but they were not deployed and merely archived.
Figure 2 — Using Dual deployment to toggle deployment path to new infrastructure
As the test environment ran on Kubernetes and got stabilized, we used the time to establish dual deployment cadence across all non-prod environments.
Troubleshooting and strengthening
Before migrating to the production we spent time addressing and assessing a few things.
We updated the liveness and readiness probes for various services with the right values to ensure that long-running DB migrations don’t cause container shutdown/respawn. We eventually pulled out migrations into separate containers which could run as a job in Kubernetes rather than as a service.
We spent time establishing the right container sizing. This was driven by data from our old monitoring dashboards and the resource peaks from the past gave us a good idea of the ceiling in terms of the baseline of resources needed. We planned enough headroom considering the roll out updates for services.
We setup ECR scanning to ensure that we get notified about any vulnerabilities in our images in time so that we can address them promptly.
We ran security scans to ensure that the new infrastructure is not vulnerable to attacks that we might have overlooked.
We addressed a few performance and application issues. Particularly for batch processes, which were split across servers running the same component. This wasn’t possible in Kubernetes setup, as each instance of a service container feeds off the same central config. So we generated multiple images that were responsible for part of batch jobs and they were identified and deployed as separate containers.
Upgrading production passively
Finally, with all the testing we were confident about rolling out Kubernetes setup to the production environment. We provisioned all the underlying infrastructure across multiple availability zones and deployed services to them. The infrastructure ran in parallel and connected to all the production data stores but it did not have a public domain configured to access it. Days before going live the TTL for our DNS records was reduced to a few minutes. Next 72 hours gave us enough time to refresh this across all DNS servers.
Meanwhile, we tested and ensured that things worked as expected using an alternate hostname. Once everything was ready, we were ready for DNS switchover without any user disruption or impact.
DNS record update
The go-live switch-over involved updating the nameservers’ DNS record to point to the API gateway fronting Kubernetes infrastructure. An alternate domain name continued to point to the old infrastructure to preserve access. It remained on standby for two weeks to provide a fallback option. However, with all the testing and setup, the switch over went smooth. Eventually, the old infrastructure was decommissioned and old GitLab pipelines deleted.

Figure 3 — DNS record update to toggle from legacy infrastructure to containerized setup
We kept old logs and monitoring data stores until the end of the retention period to be able to query them in case of a need. Post-go-live the new monitoring and logging stack continued to provide needed support capabilities and visibility.
Observations and results
Post-migration, time to create environments has reduced drastically and we can reuse the underlying hardware more optimally. Our production runs all services in HA mode without an increase in the cost. We are set up across multiple availability zones. Our data stores are replicated across AZs as well although they are managed outside the Kubernetes setup. Kubernetes had a learning curve and it required a few significant architectural changes, however, because we planned for an incremental rollout with coexistence in mind, we could take our time to change, test and build confidence across the team. While it may be a bit early to conclude, the transition has been seamless and benefits are evident.
2 notes
·
View notes
Link
Cloud-native applications are on the rise thanks to the scalability and flexibility they provide. However, this type of architecture has its own challenges. Implementing a CI/CD pipeline will solve most of them, like defining delivery procedures, delivering applications independently, and gaining observability of the numerous building blocks in a system are some of them. A CI/CD pipeline is the key to automating the steps of the software delivery process. This includes initiating code builds, running automated tests, and deploying to a testing or production environment. One CI/CD pipeline consists of multiple steps executed one after another or in parallel. There are two known pipeline syntaxes — Scripted and Declarative. The key difference between them is their flexibility. Although both syntaxes are based on Groovy DSL, the Scripted pipeline syntax is less restrictive. It also allows almost anything that can be done in Groovy. This means that the script can easily become hard to read and write. On the other hand, the Declarative syntax is more restrictive and provides a well-defined structure, which is ideal for simpler CI/CD pipelines. This syntax supports the “pipeline as code” concept. Therefore, you can write in a file that can be checked into a source control management system like Git. In order to make it more convenient for developers to set up a CI/CD pipeline, Microtica supports the Declarative syntax to define build procedures along with the source code.
Declarative CI/CD Pipelines
For the pipeline process to work, each component/microservice should have a file named microtica.yaml on the root level in its source code. This file contains the specification of the build process. During the build process, Microtica extracts the specification from the code. Then, it creates a state machine to drive the defined process. In order to ensure a single source of truth for pipeline specification, Microtica does NOT allow changes in the Build pipelines from the UI. Changes will only take effect from the YAML file provided in each source code repository. We find this very helpful in avoiding possible confusion of definition, maintenance, and, most importantly, debugging problems in the process.
Define a CI/CD pipeline
There are no limitations to the steps of the build pipeline that you can define. Here is one example of a microtica.yaml file that defines a build pipeline for NodeJS application. This pipeline executes three particular commands defined in the commands section.
Pipeline: StartAt: Build States: Build: Type: Task Resource: microtica.actions.cmd Parameters: commands: - npm install - npm test - npm prune --production sourceLocation: "$.trigger.source.location" artifacts: true End: true
Pipeline — the root key which defines the start of the pipeline section
StartAt — defines the first action of the pipeline
States — defines a list of states for the particular pipeline
Type — a type of pipeline action. Always set it to Task.
Resource — an action that the engine will use. Currently, we support microtica.actions.cmd, an action that executes bash scripting.
Parameters — a set of parameters that are given to the action
commands — a list of bash commands. Here, you define your custom scripts for build, test, code quality checks, etc.
sourceLocation — the location where the action can find the source code. You should NOT change this. Once pulled from the Git repository, Microtica stores the artifacts on a location specified by the user for the particular component/microservice. $.trigger.source.location defines that location.
artifacts — a value that defines that this build will produce artifacts which will be stored in S3 and used during deployment. Set this value should to false in case the artifact of the build is Docker image
End — defines that this is the last action in the pipeline.
Microtica supports bash commands for the execution action. In the future, we are planning to allow developers to define their own custom actions.
Getting a Docker image ready for deployment
Let’s create an extended pipeline from the example above, adding an additional step to prepare a Docker image for deployment:
Pipeline: StartAt: Build States: Build: Type: Task Resource: microtica.actions.cmd Parameters: environmentVariables: pipelineId: "$.pipeline.id" version: "$.commit.version" commands: - echo Starting build procedure... - npm install - npm test - echo Logging in to Amazon ECR... - $(aws ecr get-login --region $AWS_REGION --no-include-email) - echo Checking if repository exists in ECR. If not, create one - repoExists=`aws ecr describe-repositories --query "repositories[?repositoryName=='$pipelineId']" --output text` - if [ -z "$repoExists" ]; then aws ecr create-repository --repository-name $pipelineId; fi - awsAccountId=$(echo $CODEBUILD_BUILD_ARN | cut -d':' -f 5) - artifactLocation=$awsAccountId.dkr.ecr.$AWS_REGION.amazonaws.com/$pipelineId - echo Build Docker image... - docker build -t $pipelineId . - docker tag $pipelineId $artifactLocation:$version - docker tag $pipelineId $artifactLocation:latest - echo Push Docker image - docker push $artifactLocation sourceLocation: "$.source.location" artifacts: false End: true
In this example, we first inject environment variables in the step runtime with environmentVariables parameter ($.pipeline.id and $.commit.version are both provided by Microtica). The CI/CD pipeline in the latest example starts by executing necessary instructions to build and test the code. Once this is done, Microtica creates an ECR repository if it doesn’t already exist. Once we have the ECR repository in place, the last step is to build a new Docker image and then push it in the repository.
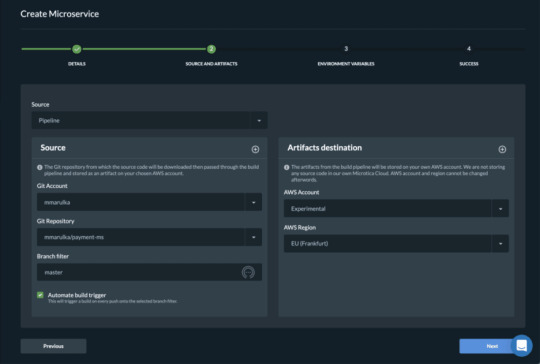
After you define the microtica.yaml file with the build pipeline, you can automate your build process in Microtica when you create the component or microservice with the wizard in the portal. This option will add a webhook to your repository. A webhook is a listener that triggers a build process whenever you push new code to your repository branch. This way, you can be sure that you’re always working with the newest changes. Building the Docker image gave us an artifact so we can deploy it in a Kubernetes cluster. You can do this from Microservice details — Add to Cluster, or in the Kubernetes Dashboard — Microservices — Deploy.

When you deploy your microservice in a Kubernetes Cluster you can select the scaling options. Moreover, you can also set up continuous delivery for your microservice.
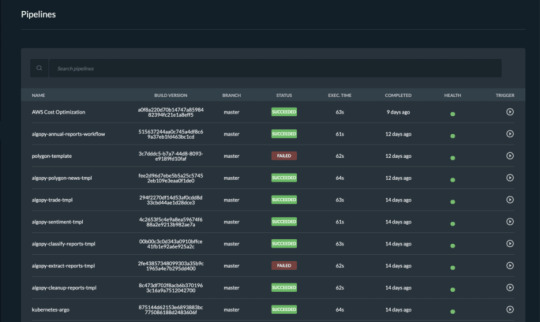
Pipelines overview

Once you trigger a build manually or automatically, follow the build process in the portal and see the events in real-time. If the build fails, it will mark it with red on the screen and it will show the error in the logs. Follow all the pipelines for your components and microservices in the Pipelines overview page and track their status. Microtica will mark a pipeline as not healthy if there are several failed builds detected. From this page, you can access any build in the history of your project. More importantly, you can also and inspect the logs to find the problems.
We are strong advocates for automated pipelines as they remove manual errors. Moreover, they are crucial for reliable and sustainable software delivery. They make software developers more productive, releasing them from the need to perform pipeline steps manually. Most importantly, they reduce the stress around new product releases.
0 notes