#regression_analysis
Explore tagged Tumblr posts
Visit Tumblr Blog
Explore Tumblr blogs with no restrictions, modern design and the best experience.
Last Seen Tumblr Blogs


Fun Fact
70% of Tumblr users say the Dashboard is their favorite place to spend time online.
Text
Methods of Data Analysis

Sentimental Analysis
Regression Analysis
Time Series Analysis
Cluster Analysis
Predictive Analysis
Check out our master program in Data Science and ASP.NET- Complete Beginner to Advanced course and boost your confidence and knowledge.
URL: www.edujournal.com
#data_science#machine_learning#data_visualization#insight#trends#regression_analysis#cluster_analysis#time_series_analysis#predictive_analysis#sentimental_analysis
0 notes
Text
Random Python Codes: Python Code for Regression Analysis. https://rdpythoncds.blogspot.com/2021/04/python-code-for-regression-analysis.html?spref=tw… Happy Coding !
0 notes
Photo

Title: Costing out Educational Needs for Khyber Pakhtunkhwa
Abstract:
This study was undertaken for costing out education needs for Khyber Pakhtunkhwa based on location, gender, district and grade. The sample consisted of 778 schools, including 364 females and 414 males. The study used descriptive statistics for analysis. It was found that rural students get slightly less pocket money than urban students. The cost of average monthly stationery, uniform cost, teacher cost and total cost for urban student was higher than for rural students. District Haripur was found to be the most successful school district. It was further found that better results need good financing. The study also confirmed that the girl student cost is less than a boy student. It was also concluded that the pocket money on average increases with grade. There was no significant difference of stationery cost across grades while grade one and grade four students’ cost on uniform was slightly higher than other grades.
Weblink: https://www.gssrjournal.com/article/Costing-out-Educational-Needs-for-Khyber-Pakhtunkhwa
Download PDF: https://www.gssrjournal.com/jadmin/Auther/31rvIolA2LALJouq9hkR/lWnEbpxqkN.pdf
Key Words:
0 notes
Text
What is Data Mining?
Definition
Data mining is the automatic analysis of large data sets to detect patterns as well as anomalies. The term mining is misleading, however, because this process is not about extracting data, but rather extracting meaning and understanding behind the data itself. Data mining is also known as Knowledge Discovery in Data for its ability to discover data patterns and predict likely outcomes. Data patterns can be grouped to make good predictions. However, as much knowledge data mining can extract, the key to effective data mining is for its human users to understand and apply those knowledge. There are different approaches to data mining applications.
Source of image
Background
Analysing data has existed for centuries. The current consensus for early concepts of data knowledge extraction comes from Reverend Thomas Bayes for his theorem in the 18th century. Bayes’ Theorem uses prior knowledge and conditions as evidence to describe the probability of an event. Another early method is regression analysis, which estimates the linear relationships between a dependent variable and independent variables. Most common method is linear regression, where a best fit line is calculated in a data set. This method of analysis is useful for prediction and sometimes causation. As technology improves, “hands-on” data analysis is taken over by computer processes. Especially with increasingly amassing data sets as well as their complexity, the focus is shifted to designing algorithms that automates data processing.
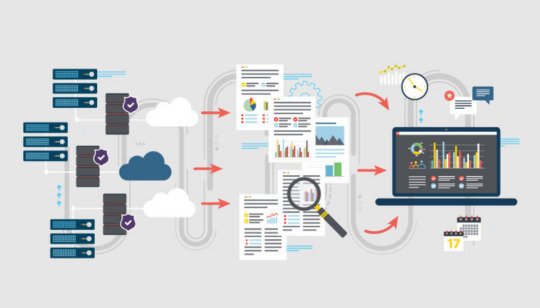
Process
In the Knowledge Discovery in Data process, there are many different definitions of stages but are simplified to pre-processing, data mining and evaluation. Having a good definition of objectives and requirements are essential to a well defined data mining project. First, data is “cleaned” to remove irrelevant or missing data, redefine parameters, rename variables, compile into a unanimous set, etc… in order for the data to fit the objective. The data mining step is where patterns of data are revealed. Commonly, identifying abnormalities, searching for relationships between variables, discovering groups and structures of data and classifying them, finding a modeling function that best fits the data with the least amount of error, and summarizing them for representation. Evaluation is deciding whether the outcomes fit the original objectives, but also making sure the algorithm is not seeing patterns that are not present in the data set. Here is a more detailed walk-through.
Source of image
Modeling
According to SAS Institute, 3 models of data mining are descriptive, predictive and prescriptive. Descriptive modeling is discovering common groups with similar characteristics, which is helpful in cases like identifying customer groups to cater more appropriate products. Predictive modeling, however, gathers patterns to predict future events and behaviors, applicable in predicting the likelihood of loan repayment of an individual. Whereas prescriptive modeling is a bit more complex in terms of collecting data fragments (text mining) that are not structured to deliver the most accurate prediction. For example, delivering different marketing options to different customers.
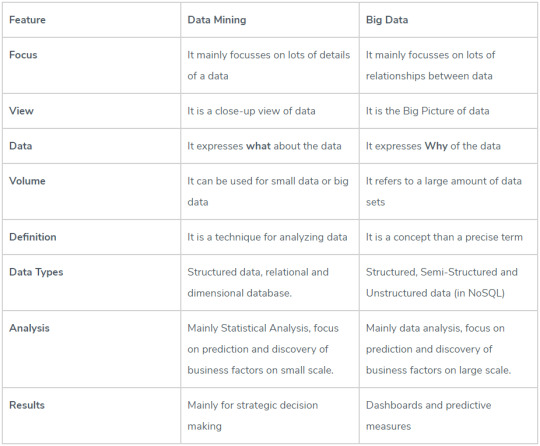
Big data
A term that is commonly mentioned in association to data mining is “Big Data”. What is it? Big data is literally just a data set so big and complex that it’s not humanly possible to analyze it using traditional methods. The term has been around for a while, but became more prevalent as storage hardware was able to store bigger amounts of data while taking up less space. In essence, it’s not about how much data, but how valuable the data is. It is different from data mining but they go hand in hand. For a more in depth comparison, check out: https://www.educba.com/big-data-vs-data-mining/ and their handy chart below, outlining the differences.
Applications
In terms of the practicality of data mining, it is incredibly useful in a vast number of areas. Most commonly known is the use of data mining in businesses. For example, product transactions at a grocery store are tracked and analyzed to find trends in sales and generate better marketing strategies. Furthermore, categorizing customers can improve product specialization. On the other hand, in bioengineering, sequence mining is used to analyze DNA sequence. It studies the effects of changing a person’s DNA sequence on their health risks. Whereas in the medical fields have recently been developing algorithms to provide second-opinion diagnostics. There are amalgamations of uses for data mining, for more in-depth explanations and other applications: https://en.wikipedia.org/wiki/Examples_of_data_mining
Jobs
Data mining has such a multifield application, one can easily find a job at any field, either at the entrance level, intern or engineer, manager level. Positions can be analyst, data scientist, developer, machine learning engineer, etc… Example sites:
https://www.indeed.com/jobs?q=Data+Mining&jt=internship
https://www.indeed.com/q-Entry-Level-Data-Mining-jobs.html
https://www.glassdoor.com/Job/data-mining-jobs-SRCH_KO0,11.htm
Ethics
In the modern age, every person generates data. It is a valuable but personal asset. Certainly, there are conventionally accepted levels of data collecting. For example, phone companies keep track of every number owners and have their locations at any given moment. This can be helpful in locating a person in case of emergency. Or banks keep track of every transaction and its location for every account and learn the users’ behaviors. Helpful in preventing and identifying unwanted purchases or theft.
However, the limit is drawn at the users’ consent, and more importantly, their understanding of what it means to give away their personal information, or how their information is being used. For example, in January 2018, Facebook is reported to pay people, as young as 13 year-olds, up to $20 a month, to install an app called Facebook Research, that would give the company access to all of the users’ private information as well as photos, emails, messages, etc… ever since 2016. Despite the user giving consent, a lot of them are not fully aware of the implications and or fully understand them. Another company that is known to extensively collect their users’ data is Google, through web-searches, app uses, audio recordings, emails (such as trip tickets, bills, purchases, etc…), locations, age, gender, etc… The common use for the users’ information is targeted ads. Seems innocent, but very ethically ambiguous when it comes to targeted advertisements at young children. They do not possess the same awareness and maturity to understand the nuances, even adults get hypnotized into an Amazon shopping binge that starts from a single targeted ad.

The argument of, “if do no wrong, there’s no secret” is long since nullified. A TEDtalk given by Glenn Greenwald eloquently explains why. Because privacy is a person’s right.
This article shows steps a user can take to curb data collection from Google.
To read more about how in-depth Facebook collects user data.
Citations:
https://en.wikipedia.org/wiki/Bayes%27_theorem
https://en.wikipedia.org/wiki/Regression_analysis
https://www.geeksforgeeks.org/kdd-process-in-data-mining/
https://en.wikipedia.org/wiki/Data_mining
https://www.sas.com/en_us/insights/big-data/what-is-big-data.html
https://docs.oracle.com/cd/B28359_01/datamine.111/b28129/process.htm#DMCON046
1 note
·
View note
Text
todo: a myriad days of nonlinear history
neanderthal end @ -15000 kd (kilodays from new Date(0))
dog @ -6000 kd
horse @ -2000 kd
buddha @ -925 or -895 kd
aristotle @ -859 kd
jesus @ -719 kd
edict of milan @ -605 kd
aztec @ -245 ⋯ -164 kd
"renaissance" @ -170kd
usa (facto) @ -120kd
usa (jure) @ -71 kd
maxwells equations @ -38kd
usa (technocracy) @ -9kd
eternal september @ 9kd
adolescence of people born in the early 90s @ 13kd
now @ 17kd
they say the end of days may be 20kd ,may be 30kd
in ratstyle by @glass
Technological progress happens at a superlinear rate although not necessarily a smooth curve (see acclerating change school of singularity). Kurzweilian graphs purport to allow extrapolation of the rate of technological progress in the future. While the actual rate might not be smoothly exponential, or may even be superexponential, we can perform regression analysis and examine the residuals to see how divergent from a smooth exponential curve technological and/or cultural progress have been in the past.
Kurzweil's graph uses a rather broad set of events and it's better to examine more constrained sets of events to get more accurate predictions (only a fraction of the right half of Kurzweil's graph occurs after the evolution of humans).
In order to compute residuals we need to: 1. Select some category of events of technological progress, using a simple criterion and attempting to avoid selection bias. 2. Like in kurzweil's graph, for each event, compute -log_n(days since event) and plot the log-time between events vs log-time where n is selected to produce the best fit 3. If we can detect a remaining pattern in the log-plot then the exponential model is wrong. In the context of making predictions about when specific events of technological progress will happen in the future, we can think in terms of log-corrected days and use a linear intuitive model of technological progress in order to save the mental work of having to apply the logarithmic correction. Humans often find it intuitively easier to think in terms of linear growth. (see framing effect)
If one doesn't want to go around taking logarithms all the time, one could use a local linear approximation. 2^3 and 2^4 are closer together than 2^10 and 2^11. By setting the epoch to a date near the current day (instead of 2000 years ago or 1970), one can get some of the benefits of the logarithmic correction without having to compute logarithms on the fly.
0 notes