#sbt-dependency-graph
Explore tagged Tumblr posts
Visit Tumblr Blog
Explore Tumblr blogs with no restrictions, modern design and the best experience.
Last Seen Tumblr Blogs


Fun Fact
Tumblr.com is the 103rd most visited website in the world.
Text
sbt-dependency-graph 0.9.0
This version (finally!) adds support for sbt 1.0. sbt-dependency-graph depends on a lot of internals from sbt to do its work which is why it was quite an effort to do the migration. Thanks @MasseGuillaume from Scala Center, @2m, and @xuwei-k for helping out with the effort.
The plugin is cross-built for sbt 0.13 (and will continued to be for while). The dependencyGraph task is currently not supported on sbt 1.0. Use dependencyBrowseGraph, instead.
sbt-dependency-graph is an sbt plugin to visualize dependencies of your build.
2 notes
·
View notes
Text
Feed-forward and back-propagation in neural networks as left- and right-fold
Description of the problem:
Today's post is about something (trivial) I realized a few days ago: one can reconceptualize feed-forward and back-propagation operations in a neural network as instances of left-fold and right-fold operations. Most of this post will be theoretical, and at the end, I will write some code in scala.
Feed-forward and Back-propagation in a Neural Network
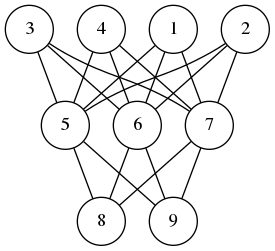
A neural network is composed of perceptrons connected via a computation graph.
A perceptron on the other hand is a computation unit which takes a vector $\mathbf{x}$ as an input and produces a scalar output
$$ f(\mathbf{w}\cdot\mathbf{x} + b) $$
Here $f$ is a function of type signature $f\colon\mathbb{R}\to \mathbb{R}$ and $\mathbf{w}$ and $b$ are parameters of the underlying perceptron.
In the simplest version of the neural networks, the network consists of layers of perceptrons where input propagates from one layer to the next. Then depending on the error produced, we back-propagate the error adjusting the weights of the perceptrons to produce the correct output. I wrote about perceptrons and back-propagation before (here, here and here)
The observation I made is this feed-forward is a left fold, while back-propagation is a right-fold operation. In pseudo-code we can express these operations as follows:
FeedForward(xs,nss) Input: a vector xs, and a list of layers nss where a layer is an ordered list of perceptron and each perceptron is a quintuple (w,b,f,eta,ys) where w is a vector, b is a real number, f is and activation function, eta is the learning rate of the perceptron and zs is the last input processed by the node. Output: a vector ys Begin If nss is empty Return xs Else Let ns <- head of nss Let ys <- () For each node=(w,f,b,zs) in ns Update zs <- xs Append f(<w,xs> + b) to ys End Call FeedForward(ys, tail of nss) End End BackPropagations(ds,nss) Input: a vector of errors, and a list of layers as before. Output: a vector Begin If nss is empty Return ds Else Let ns <- tail of nss Let zsum <- 0 For each ((w,b,f,eta,xs),d) in (ns,ds) Let zs <- (eta * d / f'(<w,xs> + b)) * xs Update w <- w - zs Update zsum <- zsum + zs End Call BackPropagation(zsum, all but the last element of nss) End End
A Scala Implementation
You can download the code and run it from my github repository. I am using mill instead of sbt.
The feed-forward part of the algorithm is easy to implement in the functional style, i.e. no mutable persistent state, such that the network as a computation unit is referentially transparent. However, the back-propagation phase requires that we update the weights of each perceptron. This means we must capture the whole state of the neural network in a data structure and propagate it along each step. As much as I like functional style and referential transparency, it is easier and cleaner to implement neural networks with mutable persistent state. Hence the choices of vars below.
package perceptron import breeze.linalg._ object neural { case class node(size: Int, fn: Double=>Double, eta: Double) { private var input = DenseVector.rand[Double](size+1) private var calc = 0.0 var weights = DenseVector.rand[Double](size+1) def forward(x: Array[Double]): Double = { input = DenseVector(Array(1.0) ++ x) calc = fn(weights.dot(input)) calc } def backprop(delta: Double): DenseVector[Double] = { val ider = eta/(fn(calc + eta/2) - fn(calc - eta/2) + eta*Math.random) val res = (-delta*eta*ider)*input weights += res res } } case class layer(size: Int, num: Int, fn: Double=>Double, eta: Double) { val nodes = (1 to num).map(i=>node(size,fn,eta)).toArray def forward(xs: Array[Double]) = nodes.map(_.forward(xs)) def backprop(ds: Array[Double]) = { val zero = DenseVector.zeros[Double](nodes(0).size+1) (nodes,ds).zipped .foldRight(zero)({ case((n,d),v) => v + n.backprop(d) }) .toArray } } case class network(shape:Array[(Int, Int, Double=>Double, Double)]) { val layers = shape.map({ case (n,m,fn,eta) => layer(n,m,fn,eta) }) def forward(xs:Array[Double]) = layers.foldLeft(xs)((ys,ns) => ns.forward(ys)) def backprop(ds:Array[Double]) = layers.foldRight(ds)((ns,ys) => ns.backprop(ys)) } } `
The only additional external dependency is the breeze math and statistics package. As for the utility code that we need for training and testing a neural network model for a given dataset, we have
package perceptron import perceptron.neural._ object Main { import scala.util.Random.nextInt import scala.io.Source.fromFile def sigmoid(x:Double) = 1.0/(1.0 + math.exp(-x)) def relu(x:Double) = math.max(x,0.0) def train(net:network, xs: Array[Array[Double]], ys: Array[Double], epochs: Int, batchSize: Int, tol: Double):Array[Double] = { val size = xs.length var err = Array[Double]() for(i <- 1 to epochs) { val j = math.abs(nextInt)%size val x = xs(j) val d = net.forward(x)(0) - ys(j) net.backprop(Array(d)) if(i % batchSize == 1) err = Array(0.0) ++ err if(math.abs(d)>tol) err(0) += 1.0/batchSize } return(err.reverse) } def main(args: Array[String]) { val file = fromFile(args(0)) val size = args(1).toInt val eta = args(2).toDouble val epochs = args(3).toInt val batchSize = args(4).toInt val tol = args(5).toDouble val data = file.mkString .split("\n") .map(x=>x.split("\t").map(_.toDouble).reverse) val ys = data.map(_.head) val xs = data.map(_.tail) val net = network(Array((size,4,relu,eta),(4,1,sigmoid,eta))) val err = train(net, xs, ys, epochs, batchSize, tol) err.foreach(x=>println("%4.3f".format(x))) } }
I know that MNIST is the de facto standard, but it is PIA to load and process the data. Instead, I am going to use the sonar dataset from UCI
I ran the model with the following parameters:
mill perceptron.run data/sonar.csv 60 0.0125 1750000 500 0.3
In the code above, the neural network has two layers: 60 nodes on the input layer, 1 hidden layer with 4 nodes, and a single output node. The perceptrons on the input layer use RELU meanwhile the other layer uses the sigmoid function.
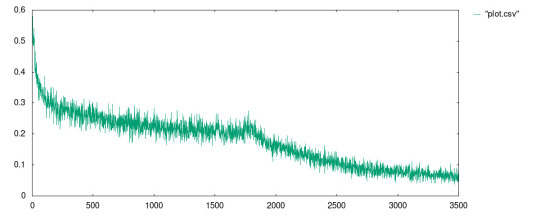
The best result I received is in the file data/plot.csv whose plot is given in
1 note
·
View note
Text
SBT - Scala’s ((mistaken as) NOT SO) Simple Build Tool
The first thing that one notices when jumping into Scala development is its utterly complicated build tool. Complications arise due to several reasons (and reasons different for different people, I’m sure) but, a consistent gripe that people seems to have is the syntax used in the build definition file (typically build.sbt although, any *.sbt would work at the root of the project) for people not very familiar with some operators/constructors that the Scala community heavily relies on and, the monstrous amount of time it takes to get the first build started. The syntax seems strange at times even for Scala developers not familiar with sbt, that is because sbt is a DSL (Domain Specific Language). Let’s dive in to understand the essential basics!
[When I first ran “sbt run”, I wasn’t sure if things were even working at all, stared into the terminal for few 10s of minutes for several hours and nothing showed up. Google searches showed that it was a common problem! Although, in my case it was a conflict between the versions of Scala and sbt that were individually installed on my machine!]
With that welcoming note, let’s dive into the sbt world - it is bound to make your life easier if you know what you are doing. And it is an extremely powerful build tool.
I highly recommend that you read the sbt getting started guide completely before starting your project (this post is not a replacement as there are several details that are important and won’t be discussed here). I’m assuming that you’ve installed a recent version of sbt already. I’m writing this to provide a quick start (which might be a lot quicker than the “Quick Start Guide” that sbt documentation provides.)
Getting Started With “sbt new”
The recent versions of sbt (later than 0.13) provide a quick way to kick start your Scala projects -
$ sbt new sbt/scala-seed.g8
sbt uses g8 templates to create the basic structure of your project. There are tons of useful ones available and you can create your own as well. If you come from the Java world, think of these as Maven archetypes of sorts. The command above would ask you for some project details like the project name, my project’s name is: Whipp. (For reasons unknown to humanity!)
The previous command should set up a simple Scala project for you with a directory structure that resembles that used by Maven:
src/[main, test]/[scala, java, resources]
$ tree -L 2 . ├── build.sbt ├── project │ ├── Dependencies.scala │ ├── build.properties │ ├── plugins.sbt │ ├── project │ └── target ├── src │ ├── main │ └── test └── target ├── scala-2.12 └── streams9 directories, 4 files
The file that would the focus of our discussion in this post is the build.sbt file - the build definition.
(Don’t forget to add target/ to your .gitignore before you make your initial commit.)
Running the project:
Building and running the project is simple:
$ sbt #takes you to the sbt shell from where you can issue commands like run [info] sbt server started at 127.0.0.1:5522 sbt:Whipp> run #The task we wish to execute.
This would compile the project files and start the project. This could take a while if you are running your first project. Patience trumps hate!
Some cool things about the sbt shell are its tab-completion feature and history. It essentially behaves like your terminal’s shell. Pretty cool huh?
You could also provide tasks in a “batch mode” like this:
#takes sbt:Whipp> clean compile run
sbt provides a continuous build option. Append a task with ~ and sbt would watch for changes in your files, auto compile them and, execute the task - for instance, ~run would add efficiency to your development setup!
Here’s a list of all the commands available for you to use: https://www.scala-sbt.org/1.x/docs/Command-Line-Reference.html
The build definition - build.sbt
This is the most important and interesting section of this post so grab your coffee and read on! The key element in understanding the build.sbt file is that it is not just a properties file but, valid Scala code (well, valid sbt DSL code to be precise but, you get the drift!)
Read the generated *.sbt file with that perspective first and see what you can gather from it:
import Dependencies._ lazy val root = (project in file(".")). settings( inThisBuild(List( organization := “com.snortingcode”, scalaVersion := "2.12.3", version := "0.1.0-SNAPSHOT" )), name := “Whipp”, libraryDependencies ++= Seq( scalaTest % Test) )
(Depending on which seed project you start with, this might look a little different. Hold on for a while and it would make a lot of sense to you!)
Let’s first look at what the below line is all about:
“lazy val root = (project in file(“.”))”
We are declaring a lazy value ‘root’ which happens to be everything followed by “lazy val root” in this case. Your build file is composed of several “val” and/or “lazy val”, these would typically fall under these 3 categories:
SettingKey[T]
TaskKey[T]
InputKey[T]
In fact, if you take a look at the config-classes under the target/ directory, you would find a cache file that has all the lazy val and val that you defined in your build.sbt file. You can also use the sbt shell to see what these keys are.
With that in mind, if you look at the build.sbt again, you’d see that we have a lazy val called root that contains the settings for each “project” in the current directory [project in file(“.”)]
Some of these are generic properties like the name of the project, organisation, etc. These are unlikely to change (it is a common practice to extract them out to a val and add it to the project.settings.)
In that sense, most of the build definition is just a bunch of key-value pairs => some help define things, some do interesting stuff. The value “name” is an example of a key that defines something.
A quick digression: If you try to assign a non-String value to “name”, you would get a typeMismatch error. The key “name” (which we did not define ourselves) comes along with the implied imports => sbt._, Keys._
Let’s try to add some interesting key that does something. Naturally, we would turn to a TaskKey[T]. Add these lines to your build definition:
lazy val doSomething = taskKey[Unit](“I do something cool!”)
Now, add this key to your settings. The updated build.sbt might look something like this:
import Dependencies._ lazy val root = (project in file(".")). settings( inThisBuild(List( organization := “com.snortingcode”, scalaVersion := "2.12.3", version := "0.1.0-SNAPSHOT" )), name := “Whipp”, libraryDependencies ++= Seq( scalaTest % Test), doSomething := {println(“Look what I did!”)} ) lazy val doSomething = taskKey[Unit](“I do something cool!”)
We defined a TaskKey[Unit] named doSomething using the method in the sbt DSL - taskKey[T]. Once you enter the sbt console (by restarting the sbt shell), you would notice that you can call this new task from the shell, simply by typing the task’s name - doSomething.
sbt:Whipp> doSomething Look what I did! [success] Total time: 1 s, completed 8 Feb, 2018 1:59:01 PM
You can thus, create a DAG (Directed Acyclic Graph) using these tasks and create a workflow for your project! Sweet!
A neat way to see what a task is doing is to “inspect” it:
sbt:Whipp>inspect compile [info] Task: xsbti.compile.CompileAnalysis [info] Description: [info] Compiles sources. [info] Provided by: [info] {file:/Users/prasoonjoshi/code/whipp/whipp/}root/compile:compile
(The actual output is rather long, so I’ve truncated it. Each [info] tells you important information about that task. (Try this out with the doSomething task you created just now and see if everything makes sense!)
We talked about the SettingKey[T] and TaskKey[T] a little bit, what is this InputKey[T] all about? Well, for now, you can just think of the InputKey as a method to take input from the user to create tasks on the fly (simple and powerful - we’ll talk about this in a future post soon!)
Let’s jump to the libraryDependencies
Yes, you know what they are! The essential information about this section of your build definition’s settings are:
+= is a method to append the provided dependency to the old libraryDependencies and return the new one!
libraryDependencies ++= Seq[<your list of dependencies>] is another way you’ll see the dependencies often defined in the build definition. (This is what our example build definition has.)
sbt uses Ivy for dependency resolution. The % that you see in the syntax below are sbt DSL’s methods that construct the Ivy module Id.
To define a new libraryDependency, you need to define the dependency first, then add it to the list of dependencies.
Here’s an example that adds mongo awesomeness to your project:
val mongo = "org.reactivemongo" %% "reactivemongo" % "0.12.6" libraryDependencies += mongo# # This line is part of my plugins.sbt file under the project directory. addSbtPlugin("com.typesafe.play" % "sbt-plugin" % "2.6.7") libraryDependencies += ws
Of course, you can add the val directly to the settings without declaring it first. See what works best for you!
I promised earlier that everything in your build definition is just a key (SettingKey, TaskKey, InputKey). See what the libraryDependencies key shows you on the sbt shell and see if that makes sense :)
A final note on the evaluation order in your build definition file: Since the build definition is just a DAG which is interspersed with “lazy val”, you should expect a sequential processing, with lazy val(s) evaluated only when they are required.
A point to keep in mind is that the SettingKeys are evaluated once, TaskKeys are evaluated each time the task is executed (these would usually have side-effects as you can see).
There are several beautiful aspects of sbt that we can’t explore here in this quick guide. I would encourage you to check out the documentation and Josh Suereth’s great talk on YouTube.
[Please do reach out to suggest improvements or corrections to this post :) ]
2 notes
·
View notes
Text
Industry Practices and Tools 2
Code quality
Importance of code quality
The long-term usefulness and long-term maintainability of the code
Minimize errors and easily debugged
Improve understandability
Decrease risks
Impact of code quality
Clarity
Maintainable
Documented
Re-factored
Well-tested
Efficiency
Extensible
The quality of the code can be measured by different aspects
Weighted Micro Function Points (WMFP)
Weighted Micro Function Points is a modern software sizing algorithm invented by Logical Solutionsin 2009 which is a successor to solid ancestor scientific methods as COCOMO, COSYSMO, maintainability index, cyclomatic complexity, function points, and Halstead complexity.
It produces more accurate results than traditional software sizing methodologies while requiring less configuration and knowledge from the end user, as most of the estimation is based on automatic measurements of an existing source code.
As many ancestor measurement methods use source lines of code (SLOC) to measure software size, WMFP uses a parser to understand the source code breaking it down into micro functions and derive several code complexity and volume metrics, which are then dynamically interpolated into a final effort score.
Halstead complexity measures
Halstead complexity measures are software metrics introduced by Maurice Howard Halstead in 1977 as part of his treatise on establishing an empirical science of software development.
Halstead made the observation that metrics of the software should reflect the implementation or expression of algorithms in different languages, but be independent of their execution on a specific platform. These metrics are therefore computed statically from the code.
Halstead's goal was to identify measurable properties of software, and the relations between them.
Cyclomatic complexity
Cyclomatic complexity is a software metric used to indicate the complexity of a program. It is a quantitative measure of the number of linearly independent paths through a program's source code.
Cyclomatic complexity is computed using the control flow graph of the program: the nodes of the graph correspond to indivisible groups of commands of a program, and a directed edge connects two nodes if the second command might be executed immediately after the first command. Cyclomatic complexity may also be applied to individual functions, modules, methods or classes within a program.
Dependency/Package management
Software project may have a backbone framework and many external artefacts linked.
These external artefacts may introduce many integration issues.
There are tools to manage these external artefacts towards minimizing these issues.
Composer (PHP)
Maven (Java)
NPM(Node Package Manager)(JS)
Manage packages with Maven
Maven is a multi-purpose tool
~ It makes the build process easy and provide a uniform build system
~ It provides quality project information
~ It allows transparent migration to new features
Maven is not only a dependency or package management tool, but also it is a build tool.
Role of package manager
A package manager deals with packages, distributions of software and data in archive files. Packages contain metadata, such as the software's name, description of its purpose, version number, vendor, checksum, and a list of dependencies necessary for the software to run properly. Upon installation, metadata is stored in a local package database. Package managers typically maintain a database of software dependencies and version information to prevent software mismatches and missing prerequisites. They work closely with software repositories, binary repository managers, and app stores.
Use of the repositories
A repository in Maven holds build artifacts and dependencies of varying types.
There are exactly two types of repositories:
Local
Remote.
- Internal – Within the company
- External – via the internet, from the original repo.
The local repository is a directory on the computer where Maven runs. It caches remote downloads and contains temporary build artifacts that you have not yet released.
When using Maven, particularly in a corporate environment, connecting to the internet to download dependencies is not acceptable for security, speed or bandwidth reasons. For that reason, it is desirable to set up an internal repository to house a copy of artifacts, and to publish private artifacts to.
Repository manager purpose
Act as dedicated proxy server for public Maven repositories
Provide repositories as a deployment destination for your Maven project outputs
Benefits and features
Significantly reduced number of downloads off remote repositories, saving time and bandwidth resulting in increased build performance
Improved build stability due to reduced reliance on external repositories
Increased performance for interaction with remote SNAPSHOT repositories
Potential for control of consumed and provided artifacts
Creates a central storage and access to artifacts and meta data about them exposing build outputs to consumer such as other projects and developers, but also QA or operations teams or even customers
Provides an effective platform for exchanging binary artifacts within your organization and beyond without the need for building artifact from source
Use the POM
Project Object Model (POM) is an XML representation of a Maven project held in a file named pom.xml
Contains the configurations of the project
Developers involved and the roles they play
The defect tracking system
The organization and licenses
The URL of where the project lives
The project's dependencies
Build tools
Build tools are programs that automate the creation of executable applications from source code.
(Ant/Ivy, Maven, Gradle, Sbt, MSBuild)
Build automation
On-demand automation
A user running a script in the command line
Scheduled automation
A continuous integration server running a nightly build.
Triggered automation
A continuous integration server running a build on every commit to version control system
Role of build automation
Automating the creation of a software build and the associated processes including, compiling computer source code into binary code, packaging binary code and running automated tests.
Maven uses Convention over Configuration,
which means developers are not required to create build process themselves.Developers do not have to mention each and every configuration detail.
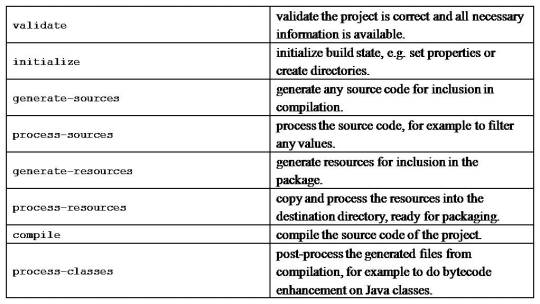
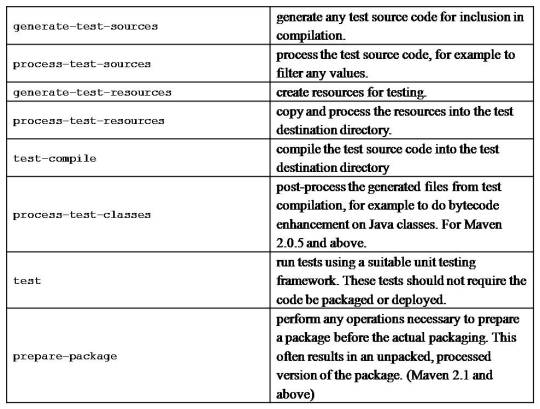
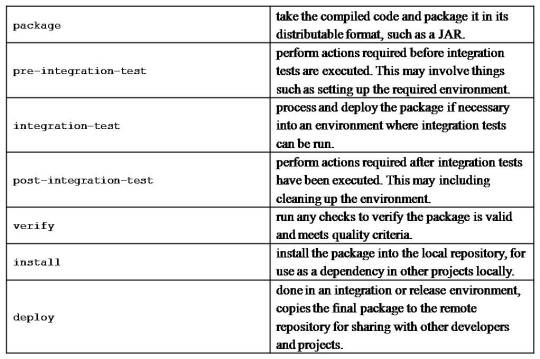
Maven build life cycle
A Build Lifecycle is a well-defined sequence of phases, which define the order in which the goals are to be executed
The default life cycle of Maven uses 23 phases to build the application.
Maven build profile
A Build profile is a set of configuration values, which can be used to set or override default values of Maven build.
Additional tools and practices
Continuous integration
Continuous Integration (CI) is a development practice that requires developers to integrate code into a shared repository several times a day. Each check-in is then verified by an automated build, allowing teams to detect problems early.
By integrating regularly, you can detect errors quickly, and locate them more easily.
Configuration management
Configuration management (CM) is a systems engineering process for establishing and maintaining consistency of a product's performance, functional, and physical attributes with its requirements, design, and operational information throughout its life.
Test automation
Automation testing is an Automatic technique where the tester writes scripts by own and uses suitable software to test the software. It is basically an automation process of a manual process.
The main goal of Automation testing is to increase the test efficiency and develop software value.
0 notes
Link
Software development has reached beyond the mere question of, “Does it work?”’ However, the question of “how to improve the code quality and its efficiency?” becomes the primary concern.
The code quality improvement is one of the things that requires well-developed strategy and adhering to it throughout the project’s lifecycle. It’s only a matter of time when it catches you up and causes problems if you leave it unaddressed. That’s why it is much better to manage this problem beforehand.
Let’s understand it using a metaphor: Suppose you construct a house without architecture. How long that house is going to stay intact is difficult to say as a foundation is of major concern, not the interior design. In a similar manner, we must strive for a good quality code so that the code will be able to live on without rotting over the time.
Writing code with desired functionality that compiles well is not enough as there are few concerns beyond functionality such as:
Proper naming conventions are followed or not.
Indentation is proper or not.
Style warnings are taken care of or not.
Code Optimization is taken care of or not.
Best coding practices are followed or not.
Design principles are followed or not.
Unit test cases are written or not.
The code is readable or not.
Code quality is not an abstract concept that has a value only in the developer’s world, it is a real thing which is missing, can lead to great financial losses over the time.
CodeSquad – A revolutionary product for continuous quality check and enables you to identify missing or problematic attributes of your code.
CodeSquad is an application that provides a qualitative analysis and insight of the projects by displaying the quality metrics of the project in a way that is easily accessible, understandable, and easier to compare with previous metrics. CodeSquad keeps the user informed by highlighting the missing or the problematic parameters.
Features:
1. Code Quality at a glance
CodeSquad dashboard presents project’s current quality at a glance by placing all quality parameters in a single row.
2. A check on technical debt
Use graphs and visualizations to track project quality over time and zoom in on specific time periods for more granular analysis
3. History graphs of project quality stats
Visualise the history of a project and understand precisely what happened in the past till past six months.
4. Notifications
CodeSquad dashboard notifies the user about activities like report upload status, health report by comparing new report’s result with the previous one(if exists) and outdated reports. It raises an alarm if the project hasn’t been through quality check for the past fifteen days.
5. Collaborator permission
CodeSquad provides quality status not only to project’s admin but also to the collaborators of the project.
Type of Quality metrics/reports CodeSquad can monitor?
Before answering this question, let’s first understand,”what are static analysis tools?“.
Static analysis tools:
They are generally used by developers as part of the development and component testing process. Source code acts as an input to the tool and tool itself is executed. It helps the developers to understand the structure of the code, and can also be used to enforce coding standards. A compiler can be considered as a static analysis tool because it builds a symbol table, points out incorrect usage and checks for non-compliance to coding language conventions or syntax.
Advantages of static analysis tools are:
Identifies defects in source code.
Provides help in understanding code.
Helps in analyzing dependencies and structures.
Enforces coding standards.
Computing metrics such as cyclomatic complexity which provides tester an indication of the amount of testing, nesting, and a number of lines of code.
Examples of the static analysis tools are:
Checkstyle: Checkstyle is a blooming tool that help programmers write Java code that adheres to a coding standard. Each rule can raise notifications, warnings, and errors. For example, checkstyle can examine- naming conventions of attributes and methods, the presence of mandatory headers, spaces between some characters, good practices of class construction and multiple complexity measurements among which expressions.
Programming Mistake Detector(PMD): PMD is a source code analyzer that detects flaws in source code, like duplicate Code, wasteful String/StringBuffer usage, classes with high cyclomatic complexity measurements, empty blocks or statements and unused local variables, parameters, and private methods.
Copy Paste Detector(CPD): CPD finds duplicate code. Copied/pasted code can mean copied/pasted bugs and thus decreases maintainability.
FindBugs: FindBugs is an open source tool used to perform static analysis on Java code. Findbugs scans for possible bugs in Java software. FindBugs operates on java bytecode, rather than source code. Each finding is reported as a warning. Warnings are categorised into four ranks: (i) scariest, (ii) scary, (iii) troubling and (iv) of concern.
Java Code Coverage(JaCoCo): JaCoCo is an open source toolkit for measuring and reporting java code coverage. JaCoCo offers instructions, line and branch coverage.
Lines of Code(LOC): LOC computes the size of a Java source code file by counting the “logical lines of code.”
Scalastyle: Scalastyle examines your Scala code and indicates potential problems with it. It is similar to checkstyle in java.
Scoverage: Scoverage is a free Apache-licensed code coverage tool for scala that offers statement and branch coverage.
Scapegoat: Colloquially known as a code lint tool or linter. Scapegoat works in a similar vein to Java’s FindBugs or checkstyle, or Scala’s Scalastyle.
CodeSquad support these programming languages: Scala & Java
Quality Metrics For Java
Check Style
Programming Mistake Detector(PMD)
Copy Paste Detector(CPD)
Find Bugs
Java Code Coverage(JaCoCo)
Lines of Code(LOC)
Quality Metrics For Scala
Lines of Code(LOC)
Scala Style
SCoverage
Scapegoat
CPD
Why codeSquad?
Secure – CodeSquad don’t need any access to your source code to generate the monitoring dashboard, it only needs the reports generated by code analysis tools.
Efficient – It can be used in all types of projects structures/frameworks like SBT/Maven etc.
CodeSquad is not limited to few software matrices. Any type of report can be parsed and corresponding results can be displayed.
User-Friendly: You don’t have to be a technical person like a tester or a developer for monitoring software health. It allows all levels of users (stakeholders like Managers, QAs, BAs etc.) to understand the quality of code.
What makes codeSquad unique?
CodeSquad not only inspects the quality of code but also keeps its users and collaborators informed about the current check on code’s quality and raises alarm if the project hasn’t been through a quality check. Clients can keep the continuous check on project matrices and can ensure that their money is spent wisely.
Sounds Interesting? Contact us for having this awesome tool and check your code quality: [email protected]
0 notes
Text
Gatling is a highly capable load testing tool. It is designed for ease of use, maintainability and high performance. As this one-liner explanation doesn’t explain the whole concept, please visit this nice presentation: why should we use Gatling and what’s it has for us here. Well, I’ll take you through how we can implement Gatling in a project which uses maven builds.
So, We need to create a maven module/sub-project or a stand-alone maven project for Gatling with a meaningful name e.g. gatling-simulations or gatling-tests etc. So, you may have two cases here first you are implementing a gatling-simulator in a maven project where you’ll make gatling-test as a module of this project, second is when you can make a new Maven Gatling-Simulator standalone. Both cases are almost same just the directory structure may differ. For example:
Build-in Simulator
Stand-alone Simulator
The approach is exactly same, as both are maven projects. So, let’s start.
Steps of Setup:
Create a maven project with a meaningful name e.g. Gatling-test, Gatling-simulations, load-test etc.
Add src/test/resources for resources and src/test/scala for Simulator classes.
Your pom.xml should look something like:
<?xml version="1.0" encoding="UTF-8"?> <project xmlns="http://maven.apache.org/POM/4.0.0" xmlns:xsi="http://www.w3.org/2001/XMLSchema-instance" xsi:schemaLocation="http://maven.apache.org/POM/4.0.0 http://maven.apache.org/xsd/maven-4.0.0.xsd"> <modelVersion>4.0.0</modelVersion> <parent> <groupId>com.example.project</groupId> <artifactId>project</artifactId> <version>0.0.1-SNAPSHOT</version> </parent> <artifactId>gatling-tests</artifactId> <properties> <scala-maven-plugin.version>3.2.2</scala-maven-plugin.version> <checkstyle.skip>true</checkstyle.skip> </properties> <dependencies> <dependency> <groupId>io.gatling.highcharts</groupId> <artifactId>gatling-charts-highcharts</artifactId> <version>2.2.5</version> <scope>test</scope> </dependency> <dependency> <groupId>org.scala-lang</groupId> <artifactId>scala-library</artifactId> <version>2.11.11</version> </dependency> <dependency> <groupId>org.scala-lang</groupId> <artifactId>scala-reflect</artifactId> <version>2.11.11</version> </dependency> <dependency> <groupId>com.google.guava</groupId> <artifactId>guava</artifactId> <version>19.0</version> </dependency> <dependency> <groupId>io.netty</groupId> <artifactId>netty-all</artifactId> <version>4.1.6.Final</version> </dependency> <dependency> <groupId>org.slf4j</groupId> <artifactId>slf4j-api</artifactId> <version>1.7.25</version> </dependency> <dependency> <groupId>com.codahale.metrics</groupId> <artifactId>metrics-core</artifactId> <version>3.0.2</version> </dependency> <dependency> <groupId>com.opencsv</groupId> <artifactId>opencsv</artifactId> <version>3.3</version> </dependency> </dependencies> <build> <plugins> <plugin> <groupId>net.alchim31.maven</groupId> <artifactId>scala-maven-plugin</artifactId> <version>${scala-maven-plugin.version}</version> </plugin> <plugin> <groupId>io.gatling</groupId> <artifactId>gatling-maven-plugin</artifactId> <version>2.2.4</version> <executions> <execution> <id>Simulations</id> <phase>load-test</phase> <<!-- or test/verify phase--> <configuration> <configFolder>${project.basedir}/src/test/resources</configFolder> <dataFolder>${project.basedir}/src/test/resources/data</dataFolder> <resultsFolder>${project.basedir}/src/test/results</resultsFolder> <requestBodiesFolder>${project.basedir}/src/test/resources/bodies</requestBodiesFolder> <simulationClass>simulator.package.Simulations</simulationClass> </configuration> <goals> <goal>execute</goal> </goals> </execution> </executions> </plugin> </plugins> </build> </project>
Then gatling.conf must be there:
######################### # Gatling Configuration # ######################### # This file contains all the settings configurable for Gatling with their default values gatling { core { #outputDirectoryBaseName = "" # The prefix for each simulation result folder (then suffixed by the report generation timestamp) #runDescription = "" # The description for this simulation run, displayed in each report #encoding = "utf-8" # Encoding to use throughout Gatling for file and string manipulation #simulationClass = "" # The FQCN of the simulation to run (when used in conjunction with noReports, the simulation for which assertions will be validated) #mute = false # When set to true, don't ask for simulation name nor run description (currently only used by Gatling SBT plugin) extract { regex { #cacheMaxCapacity = 200 # Cache size for the compiled regexes, set to 0 to disable caching } xpath { #cacheMaxCapacity = 200 # Cache size for the compiled XPath queries, set to 0 to disable caching } jsonPath { #cacheMaxCapacity = 200 # Cache size for the compiled jsonPath queries, set to 0 to disable caching #preferJackson = false # When set to true, prefer Jackson over Boon for JSON-related operations jackson { #allowComments = false # Allow comments in JSON files #allowUnquotedFieldNames = false # Allow unquoted JSON fields names #allowSingleQuotes = false # Allow single quoted JSON field names } } css { #cacheMaxCapacity = 200 # Cache size for the compiled CSS selectors queries, set to 0 to disable caching } } timeOut { #simulation = 8640000 # Absolute timeout, in seconds, of a simulation } directory { data = src/test/resource/data # Folder where user's data (e.g. files used by Feeders) is located bodies = src/test/resource/bodies # Folder where bodies are located simulations = src/test/scala/package # Folder where the bundle's simulations are located< #reportsOnly = src/test/results # If set, name of report folder to look for in order to generate its report #binaries = "" # If set, name of the folder where compiles classes are located: Defaults to GATLING_HOME/target. #results = src/test/results # Name of the folder where all reports folder are located } } charting { #noReports = false # When set to true, don't generate HTML reports #maxPlotPerSeries = 1000 # Number of points per graph in Gatling reports #accuracy = 10 # Accuracy, in milliseconds, of the report's stats indicators { #lowerBound = 800 # Lower bound for the requests' response time to track in the reports and the console summary #higherBound = 1200 # Higher bound for the requests' response time to track in the reports and the console summary #percentile1 = 50 # Value for the 1st percentile to track in the reports, the console summary and GraphiteDataWriter #percentile2 = 75 # Value for the 2nd percentile to track in the reports, the console summary and GraphiteDataWriter #percentile3 = 95 # Value for the 3rd percentile to track in the reports, the console summary and GraphiteDataWriter #percentile4 = 99 # Value for the 4th percentile to track in the reports, the console summary and GraphiteDataWriter } } http { #elFileBodiesCacheMaxCapacity = 200 # Cache size for request body EL templates, set to 0 to disable #rawFileBodiesCacheMaxCapacity = 200 # Cache size for request body Raw templates, set to 0 to disable #fetchedCssCacheMaxCapacity = 200 # Cache size for CSS parsed content, set to 0 to disable #fetchedHtmlCacheMaxCapacity = 200 # Cache size for HTML parsed content, set to 0 to disable #redirectPerUserCacheMaxCapacity = 200 # Per virtual user cache size for permanent redirects, set to 0 to disable #expirePerUserCacheMaxCapacity = 200 # Per virtual user cache size for permanent 'Expire' headers, set to 0 to disable #lastModifiedPerUserCacheMaxCapacity = 200 # Per virtual user cache size for permanent 'Last-Modified' headers, set to 0 to disable #etagPerUserCacheMaxCapacity = 200 # Per virtual user cache size for permanent ETag headers, set to 0 to disable #warmUpUrl = "http://gatling.io" # The URL to use to warm-up the HTTP stack (blank means disabled) #enableGA = true # Very light Google Analytics, please support ssl { trustStore { #type = "" # Type of SSLContext's TrustManagers store #file = "" # Location of SSLContext's TrustManagers store #password = "" # Password for SSLContext's TrustManagers store #algorithm = "" # Algorithm used by SSLContext's TrustManagers store } keyStore { #type = "" # Type of SSLContext's KeyManagers store #file = "" # Location of SSLContext's KeyManagers store #password = "" # Password for SSLContext's KeyManagers store #algorithm = "" # Algorithm used SSLContext's KeyManagers store } } ahc { #allowPoolingConnections = true # Allow pooling HTTP connections (keep-alive header automatically added) #allowPoolingSslConnections = true # Allow pooling HTTPS connections (keep-alive header automatically added) #compressionEnforced = false # Enforce gzip/deflate when Accept-Encoding header is not defined #connectTimeout = 60000 # Timeout when establishing a connection #pooledConnectionIdleTimeout = 60000 # Timeout when a connection stays unused in the pool #readTimeout = 60000 # Timeout when a used connection stays idle #connectionTTL = -1 # Max duration a connection can stay open (-1 means no limit) #ioThreadMultiplier = 2 # Number of Netty worker threads per core #maxConnectionsPerHost = -1 # Max number of connections per host (-1 means no limit) #maxConnections = -1 # Max number of connections (-1 means no limit) #maxRetry = 2 # Number of times that a request should be tried again #requestTimeout = 60000 # Timeout of the requests #useProxyProperties = false # When set to true, supports standard Proxy System properties #webSocketTimeout = 60000 # Timeout when a used websocket connection stays idle #useRelativeURIsWithConnectProxies = true # When set to true, use relative URIs when talking with an SSL proxy or a WebSocket proxy #acceptAnyCertificate = true # When set to true, doesn't validate SSL certificates #httpClientCodecMaxInitialLineLength = 4096 # Maximum length of the initial line of the response (e.g. "HTTP/1.0 200 OK") #httpClientCodecMaxHeaderSize = 8192 # Maximum size, in bytes, of each request's headers #httpClientCodecMaxChunkSize = 8192 # Maximum length of the content or each chunk #keepEncodingHeader = true # Don't drop Encoding response header after decoding #webSocketMaxFrameSize = 10240 # Maximum frame payload size #httpsEnabledProtocols = "" # Comma separated enabled protocols for HTTPS, if empty use the JDK defaults #httpsEnabledCipherSuites = "" # Comma separated enabled cipher suites for HTTPS, if empty use the JDK defaults #sslSessionCacheSize = 20000 # SSLSession cache size (set to 0 to disable) #sslSessionTimeout = 86400 # SSLSession timeout (default is 24, like Hotspot) } } data { #writers = "console, file" # The lists of DataWriters to which Gatling write simulation data (currently supported : "console", "file", "graphite", "jdbc") #reader = file # The DataReader used by the charting engine for reading simulation results console { #light = false # When set to true, displays a light version without detailed request stats } file { #bufferSize = 8192 # FileDataWriter's internal data buffer size, in bytes } leak { #noActivityTimeout = 30 # Period, in seconds, for which Gatling may have no activity before considering a leak may be happening } jdbc { db { #url = "jdbc:mysql://localhost:3306/temp" # The JDBC URL used by the JDBC DataWriter #username = "root" # The database user used by the JDBC DataWriter #password = "123123q" # The password for the specified user } #bufferSize = 20 # The size for each batch of SQL inserts to send to the database create { #createRunRecordTable = "CREATE TABLE IF NOT EXISTS `RunRecords` ( `id` INT NOT NULL AUTO_INCREMENT , `runDate` DATETIME NULL , `simulationId` VARCHAR(45) NULL , `runDescription` VARCHAR(45) NULL , PRIMARY KEY (`id`) )" #createRequestRecordTable = "CREATE TABLE IF NOT EXISTS `RequestRecords` (`id` int(11) NOT NULL AUTO_INCREMENT, `runId` int DEFAULT NULL, `scenario` varchar(45) DEFAULT NULL, `userId` VARCHAR(30) NULL, `name` varchar(50) DEFAULT NULL, `requestStartDate` bigint DEFAULT NULL, `requestEndDate` bigint DEFAULT NULL, `responseStartDate` bigint DEFAULT NULL, `responseEndDate` bigint DEFAULT NULL, `status` varchar(2) DEFAULT NULL, `message` varchar(4500) DEFAULT NULL, `responseTime` bigint DEFAULT NULL, PRIMARY KEY (`id`) )" #createScenarioRecordTable = "CREATE TABLE IF NOT EXISTS `ScenarioRecords` (`id` int(11) NOT NULL AUTO_INCREMENT, `runId` int DEFAULT NULL, `scenarioName` varchar(45) DEFAULT NULL, `userId` VARCHAR(30) NULL, `event` varchar(50) DEFAULT NULL, `startDate` bigint DEFAULT NULL, `endDate` bigint DEFAULT NULL, PRIMARY KEY (`id`) )" #createGroupRecordTable = "CREATE TABLE IF NOT EXISTS `GroupRecords` (`id` int(11) NOT NULL AUTO_INCREMENT, `runId` int DEFAULT NULL, `scenarioName` varchar(45) DEFAULT NULL, `userId` VARCHAR(30) NULL, `entryDate` bigint DEFAULT NULL, `exitDate` bigint DEFAULT NULL, `status` varchar(2) DEFAULT NULL, PRIMARY KEY (`id`) )" } insert { #insertRunRecord = "INSERT INTO RunRecords (runDate, simulationId, runDescription) VALUES (?,?,?)" #insertRequestRecord = "INSERT INTO RequestRecords (runId, scenario, userId, name, requestStartDate, requestEndDate, responseStartDate, responseEndDate, status, message, responseTime) VALUES (?,?,?,?,?,?,?,?,?,?,?)" #insertScenarioRecord = "INSERT INTO ScenarioRecords (runId, scenarioName, userId, event, startDate, endDate) VALUES (?,?,?,?,?,?)" #insertGroupRecord = "INSERT INTO GroupRecords (runId, scenarioName, userId, entryDate, exitDate, status) VALUES (?,?,?,?,?,?)" } } graphite { #light = false # only send the all* stats #host = "localhost" # The host where the Carbon server is located #port = 2003 # The port to which the Carbon server listens to #protocol = "tcp" # The protocol used to send data to Carbon (currently supported : "tcp", "udp") #rootPathPrefix = "gatling" # The common prefix of all metrics sent to Graphite #bufferSize = 8192 # GraphiteDataWriter's internal data buffer size, in bytes #writeInterval = 1 # GraphiteDataWriter's write interval, in seconds } } }
Then design your simulator in scala:
package sample.package import io.gatling.core.Predef._ import io.gatling.http.Predef._ import scala.concurrent.duration._ import scala.util.Random import com.typesafe.config._ import scala.util.control.Breaks._ class Simulations extends Simulation { val headers_0 = Map( "Content-Type" -> "application/json", "api-key" -> "123") val headers_1 = Map("api-key" -> "123") object getMyObject { val validCase = repeat(10) { exec(http("Get Positive Case") .get("<your-api-url>").check(status.find.in(200)) .headers(headers_1)) } val inValidCase = repeat(10) { exec(http("Get Negative Case") .get("<your-api-url>").check(status.find.in(400,401,404,501,502)) .headers(headers_1)) .pause(1) } } val httpConfGetMyObject = http .baseURL("localhost:8080") .acceptHeader("application/json; charset=utf-8") .doNotTrackHeader("1") .acceptLanguageHeader("en-US,en;q=0.5") .acceptEncodingHeader("gzip, deflate") .userAgentHeader("Mozilla/5.0 (Macintosh; Intel Mac OS X 10.8; rv:16.0) Gecko/20100101 Firefox/16.0") val commerceGetValidObjectScenario = scenario("GetMyObject").exec(getMyObject.validCase) val commerceGetInValidObjectScenario = scenario("GetInValidMyObject").exec(getMyObject.inValidCase) setUp( commerceGetValidItenaryScenario.inject(rampUsers(25) over (10 seconds)).protocols(httpConfGetMyObject), commerceGetInValidItenaryScenario.inject(rampUsers(25) over (10 seconds)).protocols(httpConfGetMyObject)) }
Now your setup is ready to run. The maven command to run your Gatling setup is completely dependent upon the configurations given in your plugin in the build.
Mine is like:
mvn gatling:test
or
mvn gatling:execute
for Standalone setup.
mvn -pl post-deployment-tests/gatling-test gatling:test
or
mvn -pl post-deployment-tests/gatling-test gatling:execute<span data-mce-type="bookmark" id="mce_SELREST_start" data-mce-style="overflow:hidden;line-height:0" style="overflow:hidden;line-height:0" ></span>
for built-in setup.
Please comment your doubts or queries and share if you liked the post.

Gatling | Maven Setup. Gatling is a highly capable load testing tool. It is designed for ease of use, maintainability and high performance.
0 notes
Text
sbt-dependency-graph 0.8.2
This is a maintenance release fixing dependencyBrowseGraph in the latest Chrome versions. Thanks @chtefi!
sbt-dependency-graph is an sbt plugin to visualize dependencies of your build.
0 notes
Text
sbt-dependency-graph 0.8.1
This is a maintenance release fixing a regression in 0.8.0 and adding two small features.
All changes:
#84: Fix regression of DOT label rendering introduced in 0.8.0.
#83: Added new task dependencyStats which prints a simple table of jar sizes for all your dependencies. Handy if you want to know why your assembled jar gets so big.
#85: Added new task dependencyList which prints a flat, deduplicated list of all the transitive dependencies.
sbt-dependency-graph is an sbt plugin to visualize dependencies of your build.
0 notes
Text
sbt-dependency-graph 0.7.5
This is a maintenance release adding support for sbt 0.13.8.
All changes:
#67: Added support for sbt 0.13.8. Thanks @eed3si9n for the fix.
#37: Don't fail with StringIndexOutOfBoundsException for deep trees.
#44: Only match scala lib by org/name. Thanks @2beaucoup for the fix.
sbt-dependency-graph is an sbt plugin to visualize dependencies of your build.
0 notes
Text
sbt-dependency-graph 0.7.4
This is a maintenance release fixing an exception when generating graphs without a terminal #32.
sbt-dependency-graph is an sbt plugin to visualize dependencies of your build.
0 notes
Text
sbt-dependency-graph 0.7.3
This is a maintenance release. Following issues have been fixed:
#27: A dependency configured with a version range was not properly associated with its dependant.
#30 & #31: Make it work again with sbt 0.12.3. The path of the dependency resolution file changed in sbt 0.12.3. Thanks ebowman for the fix.
sbt-dependency-graph is an sbt plugin to visualize dependencies of your build.
0 notes
Text
sbt-dependency-graph 0.7.1
New features in this version:
dependency-license-info: show dependencies grouped by declared license
dependency-dot: create dot file from dependency graph. Contributed by berleon.
sbt-dependency-graph is an sbt plugin to visualize dependencies of your build.
0 notes
Text
sbt-dependency-graph 0.7.0
New features in this version:
dependency-graph now renders a real graph. Thanks go to Matt Russell for this added awesomeness.
The tree output from previous versions is now available with dependency-tree.
New task what-depends-on showing reverse dependency tree for a selected module (incl. tab-completion for modules)
Don't fail in cases of a missing dependency. Show errors directly in the output.
Show info about evicted versions.
By default, exclude scala-library dependency and append [S] to the artifact name instead. Set filter-scala-library to false to disable this feature.
Works with sbt 0.12.1. The ivy report files were moved to a new location making an update necessary.
sbt-dependency-graph is an sbt plugin to visualize dependencies of your build.
0 notes
Text
sbt-dependency-graph 0.6.0
New features in this version:
dependency-graph task now prints the dependency graph to the console (contributed by @gseitz)
dependency-graph-ml contains now the old functionality of dependency-graph which generates a .graphml file. Nodes now contain the dependency version as well (contributed by @gseitz).
The output filename of dependency-graph-ml has been changed to include the configuration name. It is now configurable using the dependency-graph-ml-file setting.
The common scalaVersion in update idiom to support Scala 2.9.1 libraries in a Scala 2.9.2 broke the plugin in 0.5.2, because it wouldn't find the ivy report xml file any more. This was fixed.
All tasks are scoped by configuration.
sbt-dependency-graph is an sbt plugin to visualize dependencies of your build.
0 notes