#technicalanalysischarts
Explore tagged Tumblr posts
Visit Tumblr Blog
Explore Tumblr blogs with no restrictions, modern design and the best experience.
Last Seen Tumblr Blogs


Fun Fact
Tumblr is available in 18 languages.
Photo

Amazon [AMZN] TECHNICAL ANALYSIS Content: - Bollinger Bands - Channels - Moving averages - Support & Resistance - Patterns (2T) - Test Zone - - - - - - - - - - - - 📣 “Evolution is the concept that makes Humans unique” - - - - - - - - - - - - 📣 FOLLOW US FOR MORE CONTENT 👉@coneicom 👉@coneicom 👉@coneicom - - - - - - - - - - - - 🔎 If you want to know more about us visit our link in bio and discover our services! - - - - - - - - - - - - 📣 Please, no investment advice. Our purpose is education only! - - - - - - - - - - - - #amazon #amzn #tradingamazon #technicalanalysischarts #tradingpatterns #bollingerbands #supportandresistancetrading #coneicom https://www.instagram.com/p/Ca6fsPQARmG/?utm_medium=tumblr
#amazon#amzn#tradingamazon#technicalanalysischarts#tradingpatterns#bollingerbands#supportandresistancetrading#coneicom
0 notes
Photo

GBP/USD Technical Analysis ~~ GBP/USD has formed a right inclined head and shoulder pattern which signals extreme negativity in the counter. ~~ Further, it has broken the neckline and heading down strongly. ~~ We expect the pair to be extremely bearish in the short-term and head to much lower levels. Get the free analysis here: Android: https://play.google.com/store/apps/details?id=com.traderpulse.analysis IOS: https://apps.apple.com/app/forex-analysis/id1358603638 Web: https://analysis.traderpulse.com
#headandshoulderpattern#bearish#GBPUSD#freeanalysis#technicalanalysis#technicalanalysischart#traderpulse
0 notes
Photo
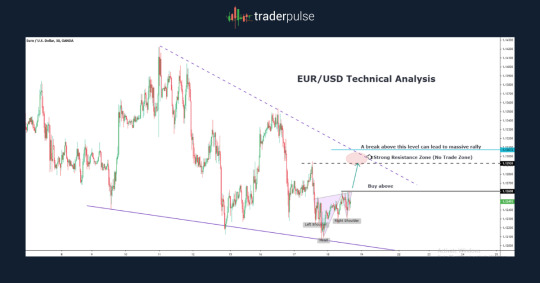
EUR/USD Technical Analysis --> The counter has been declining ever since it hit the 52-week high of 1.14208. --> It found support with a trendline and trying to claw its back. --> It is evident with the formation of an inverted head and shoulder pattern, however, the neckline seems to be a tough nut. --> A break above the neckline can push the price either to resistive trendline or price action resistance of 1.12920. --> As the pair has consolidated for a longer duration, a break above the resistance levels is feasible and in case it ferments, it could lead to a strong bullish move. Get the right analysis now: Android: https://play.google.com/store/apps/details?id=com.traderpulse.analysis IOS: https://apps.apple.com/app/forex-analysis/id1358603638 Web: https://analysis.traderpulse.com
#headandshoulderpattern#resistivetrendline#priceaction#bullish#EURUSD#TechnicalAnalysis#freeanalysis#technicalanalysischart#traderpulse
0 notes
Photo
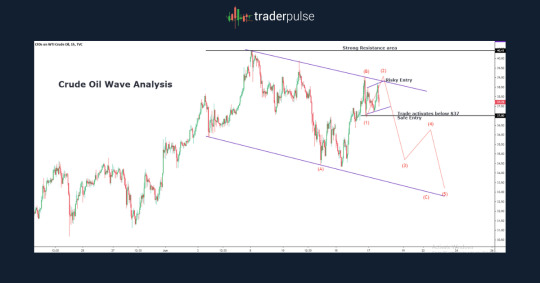
Crude Oil Wave Analysis ** After a strong show in the last weeks, crude oil needs to make an obvious correction. ** We expect the correction to be of ABC structure and it has already completed waves A and B. ** Further, the structure resembles a bullish flag pattern and the price is at the upper parallel now. ** Currently, the pair is forming a bearish flag pattern in the short-term charts and a break below could guarantee a safe entry to bears. ** PS: Aggressive trades, refer to the resistance at 40.41 for the stop. Get the free analysis now: Android: https://play.google.com/store/apps/details?id=com.traderpulse.analysis IOS: https://apps.apple.com/app/forex-analysis/id1358603638 Web: https://analysis.traderpulse.com
#CrudeOil#WaveAnalysis#bearishflagpattern#freeanalysis#technicalanalysis#bearish#technicalanalysischart#traderpulse
0 notes
Photo

GBP/USD Technical Analysis ** The counter has broken its immediate trendline. ** Further, it made a head and shoulder pattern and broke down from the neckline. ** Hence, we expect the pair to be bearish in the near-term. Get the right analysis here: Android: https://play.google.com/store/apps/details?id=com.traderpulse.analysis IOS: https://apps.apple.com/app/forex-analysis/id1358603638 Web: https://analysis.traderpulse.com
#headandshoulderpattern#bearish#technicalanalysischart#chartformation#GBPUSD#freeanalysis#traderpulse
0 notes
Photo

AUD/JPY Technical Analysis ** This pair currently is in a rising wedge formation. ** It break the pattern & moves in a negative direction. ** Hence, it will be bearish from here. Get the right analysis here: Android: https://play.google.com/store/apps/details?id=com.traderpulse.analysis IOS: https://apps.apple.com/app/forex-analysis/id1358603638 Web: https://analysis.traderpulse.com
#risingwedge#technicalanalysischart#wedgepattern#markettrend#AUDJPY#forexanalysis#freeanalysis#traderpulse
0 notes