#bollingerbands
Text
Bollinger Bands Strategy

Bollinger Bands are a popular technical analysis tool used to measure market volatility and identify potential trading opportunities. They consist of three lines:
Middle Band: This is typically a simple moving average (SMA) of the price, usually over 20 periods.
Upper Band: This is the middle band plus a specified number of standard deviations (commonly 2) above the middle band.
Lower Band: This is the middle band minus the same number of standard deviations below the middle band.
The general idea behind Bollinger Bands is that price tends to return to the middle band, with the bands expanding and contracting based on volatility.
Here is a basic strategy using Bollinger Bands:
Buy Signal:
Occurs when the price touches or crosses below the lower band.
Confirm with other indicators (like RSI or MACD) to reduce false signals.
Sell Signal:
Occurs when the price touches or crosses above the upper band.
Again, confirm with other indicators.
Take Profit and Stop Loss:
A common take profit target can be set at the middle band.
A stop loss can be placed below/above the recent low/high beyond the bands.
Read the full blog here, linked below:
0 notes
Video
youtube
Pocket Option Easy Tricks Best Method - Bollinger Bands
0 notes
Text
Nifty Index Outlook: Key Levels to Watch for Market Movement
#bearishcandle #BollingerBands #closeabove19450 #correctioninthemarket #criticalforNiftysmovement #declinetowards1920019000levels #healthybuyinginterest #lackofconviction #marketsentiment #monitor19450level. #MovingAverages #narrowrange #nextfewsessions #Niftyindextechnicaloutlook #profitbooking #RelativeStrengthIndexRSI #strongglobalcues #successfulbreakout #target1960019700levels #technicalindicators #unexpectednegativedevelopment
#Business#bearishcandle#BollingerBands#closeabove19450#correctioninthemarket#criticalforNiftysmovement#declinetowards1920019000levels#healthybuyinginterest#lackofconviction#marketsentiment#monitor19450level.#MovingAverages#narrowrange#nextfewsessions#Niftyindextechnicaloutlook#profitbooking#RelativeStrengthIndexRSI#strongglobalcues#successfulbreakout#target1960019700levels#technicalindicators#unexpectednegativedevelopment
0 notes
Text
Strategies for Trading with MACD
#TradingStrategy#TechnicalAnalysis#MACDIndicator#InvestingTips#MarketMomentum#StockMarketTips#DayTrading#SwingTrading#FinancialMarkets#RSIIndicator#BollingerBands#StochasticOscillator#TradingSignals#upcomingtradera#day trading#futures trading#investing#finance#financial literacy#investors#investments
0 notes
Text
Bollinger Bands Strategy Guide to Trading Success Trading

The key to success in the ever-changing world of trading is the ability to anticipate market moves and make calculated choices. Bollinger Bands is a popular strategy among traders because of its flexibility and efficiency. This in-depth manual will teach you everything you need to know to use this trading strategy successfully.
An Overview of the Bollinger Bands Strategy

Bollinger Bands Strategy
The Bollinger Bands Strategy is defined as follows.
John Bollinger created the Bollinger Bands strategy in the 1980s as a technical analysis tool. Its purpose is to aid traders in determining when to enter and quit the market. The process employs a triangular plot with a simple moving average in the center and two lines at different standard deviations above and below it. This produces a moving border around the price activity, giving traders a graphical depiction of the market's condition.
Where Bollinger Bands Came From and Why They Matter in Trading
Technical analyst veteran John Bollinger first popularized the Bollinger Bands.
The strategy's value comes from its ability to quantify market volatility and provide benchmarks for a price high or low. Because of its importance in spotting trading opportunities and controlling risk, this data is a must-have for investors.
Learning How Bollinger Bands Are Made
Bollinger Bands include three primary parts:
The Center Line: This short moving average is a foundation for the upper and lower bands. As a symbol of the trend in the medium term, it is often a point of support or resistance.
Overbought conditions are indicated by a move above the Upper Band, which may be seen as a signal to reduce holdings. When the price of an asset reaches or passes this level, it may be a sign that it is overvalued and that a decline in its value is likely.
As indicated by the Lower Band presence, Oversold situations may signal a good time to purchase. Price action around or crossing this level may tell that the asset is underpriced, and a price rise is likely.

Top Methods For Using Bollinger Bands
Profitable Trading Requires Recognizing The Bollinger Squeeze
Top Methods for Using Bollinger Bands
Profitable Trading Requires Recognizing the Bollinger Squeeze
An essential part of the Bollinger Bands strategy is the Bollinger Squeeze. This happens when there is less volatility in the market and the bands' contract. When the band's arrangement is like this, volatility increases, causing significant price swings. Squeezes like this may provide profitable trading chances, so traders watch for them.
Taking Advantage of Market Volatility with the Bollinger Bounce
Another crucial idea essential to the Bollinger Bands strategy is the Bollinger Bounce.
That's jargon for how often prices "bounce" between the two bands. Markets whose prices tend to fluctuate between a specific high and low might benefit significantly from recognizing this trend.
Why RSI and Bollinger Bands Work So Well Together
The efficiency of your trading strategy may be improved by integrating Bollinger Bands with the Relative Strength Index (RSI). The Relative Strength Index (RSI) is a momentum oscillator that evaluates the price change rate. Used in tandem with Bollinger Bands, it may corroborate the signals given by the bands, lowering the chance of receiving a false signal and increasing the strategy's overall dependability.
Strategy for Using Bollinger Bands
Preparing Your Trading Platform Using Bollinger Bands
Bollinger Bands are a standard indicator on most trading platforms. Please select it from the list of possible hands, then tweak the parameters to your liking. Bollinger Bands have two standard deviations for the upper and lower bands and a 20-day simple moving average for the center line. But you may tweak these parameters to suit your trading preferences and time horizon.
Bollinger Bands: An Introduction and Explanation
Bollinger Bands are easy to understand and apply.
A widening of the bands shows increased market volatility. Conversely, narrower bands are indicative of lower volatility. Prices tend to fluctuate towards the bands during high volatility and shift closer to the center line during low volatility.
Traders might utilize these insights to spot future market openings. When the price reaches the top band, it may be time to sell, while when it goes to the lower band, it may be time to purchase. These signals, however, should be double-checked with other indications to ensure their accuracy.
Divergence, convergence, and other high-level methods
Expert traders often use Bollinger Bands to search for divergence and convergence patterns. When the price and band trends are heading in opposing directions, we have divergence; when they run similarly, we see convergence. These patterns may help traders spot good opportunities by revealing information about possible market reversals.
Bollinger Bands and Compatible Indicators
Bollinger Bands and Simple Moving Averages: A Powerful Combination
Smoothing out price data using moving averages makes it worthwhile in technical analysis since patterns become more apparent. When combined with Bollinger Bands, these indicators are helpful for trading. For instance, a trading opportunity may present when the price moves above or below a moving average line.

An Unbeatable Combination: Macd And Bollinger Bands
An Unbeatable Combination: MACD and Bollinger Bands
Another common technique that combines nicely with Bollinger Bands is the Moving Average Convergence Divergence (MACD). The Moving Average Convergence Divergence (MACD) is a momentum indicator that tracks price trends. When used with Bollinger Bands, it may corroborate the signals provided by the bands, making their signs more trustworthy.
A Potent Combination of the Relative Strength Index (RSI) and Bollinger Bands
The Relative Strength Index (RSI) is a momentum oscillator that evaluates the price change rate. By highlighting overbought and oversold circumstances, Bollinger Bands may serve as a helpful trading indication. When the price reaches the upper band and the RSI shows overbought events, this is an excellent time to sell.
Analysis of Bollinger Bands' Performance
The Reasons Why Bollinger Bands Are So Popular With Traders
Because of their adaptability, Bollinger Bands are often used in trading. They are helpful for both short-term traders and long-term investors since they can be used across all markets and time durations. And since they show the market situation graphically, even inexperienced traders can understand them.
Using Bollinger Bands Successfully in Real-World Trading Scenarios
Bollinger Bands have been used successfully by many traders. This trading strategy has shown itself successful time and time again, as seen by these examples of its use. Examples of this use include the identification of overbought/oversold circumstances in range-bound markets and the identification of breakouts in turbulent markets.
What Bollinger Bands Can't Tell You and How to Fix It
Bollinger Bands, like any other trading technique, has its limits. For instance, they may give out misleading readings during high volatility. A disciplined trading strategy and supplementary indicators help traders get beyond these restrictions. Combining Bollinger Bands with other indicators like the Relative Strength Index (RSI) or the Moving Average Convergence Divergence (MACD) may assist in eliminating spurious signals and boost the strategy's consistency.
Improving Your Use of Bollinger Bands
How to Use Price Movement with Bollinger Bands
The term "price action" describes the fluctuations in the value of securities, which are often shown in real-time on a chart. Bollinger Bands are helpful, but you may get more insight into market behavior by including price action in your strategy. For instance, pin bars and engulfing patterns are two examples of price action patterns that may indicate a market reversal. Strong trading signals may be generated by the appearance of such patterns at the band's upper or lower boundary.
Bollinger Bands and the Importance of Candlestick Patterns Trading
Potential market reversals might be predicted with the use of candlestick patterns. Bollinger Bands help determine when to enter and leave a market. For example, in the lower band, a bullish engulfing pattern might indicate a buying chance, while near the higher bar, a bearish engulfing pattern could indicate a selling opportunity.
The Importance of Risk Management in Bollinger Bands Trading
A successful trading strategy must prioritize risk control. Stop-loss orders may
Control losses and gains can be cashed at predefined points. Stop-loss orders may be placed above the upper band or below the lower band when using Bollinger Bands to guard against potentially disastrous price swings. Similarly, take-profit orders might be placed in the opposite band to benefit from price increases.
Market Conditions and Bollinger Bands
Market Trends and Bollinger Bands
Bollinger Bands help determine when to enter and leave moving markets. The upper and lower bands can serve as shifting support and resistance zones. In an upward trend, for instance, a price that encounters resistance at the lower Bollinger Bands may rebound off that level and proceed toward the upper Bands, creating a purchasing opportunity. When prices fall, they can bounce off the upper band and go back down, creating a selling opportunity.
The Breakout Strategy for Bollinger Bands in Choppy Markets
Bollinger Bands are helpful in sideways markets because they reveal stretches of low volatility that usually precede a breakthrough. Investors might use this data to be ready for any price shifts. For instance, if the bands narrow, it may be a precursor to a breakthrough. When a breakout occurs, traders may cash in by placing entry orders either above the upper band or below the lower band.
Bollinger Bands: Riding the Waves in Turbulent Markets
When market volatility is high, Bollinger Bands widen to account for more price movement. Investors might use this data in their trading techniques. They may, for instance, increase the distance between their stop-loss and take-profit levels in anticipation of the higher levels of volatility.
Different Trading Strategies Using Bollinger Bands
Bollinger Bands for Swing Trading: Taking Advantage of Price Movements
Swing traders may use Bollinger Bands to forecast price changes. The higher and lower bands represent possible turning points. For instance, a chance to sell may present itself when the price increases to the upper band. The same holds for the bottom band, as a price touching that level may indicate a possible upward movement and a purchasing opportunity.

Using Bollinger Bands
Using Bollinger Bands for Intraday Trading
Day traders may use Bollinger Bands to monitor temporary price shifts. The strategy may aid in providing signs for entering and leaving markets quickly. For instance, a touch of the upper band may indicate a short-term selling opportunity, while a touch of the lower band may indicate a short-term purchasing opportunity.
Using Bollinger Bands Patiently for Long-Term Gains
Bollinger Bands may help long-term investors see possible shifts in the market's long-term trend. Signals for promising long-term investments may be gleaned by using the strategy. For instance, if the price stays above the upper band for an extended time, it may indicate a robust upward trend and a promising chance for long-term investment. Similarly, if prices stay below the lower range for an extended time, it may indicate a significant negative trend and provide an opportunity for short sellers.
Successfully Using Bollinger Bands, Final Thoughts
Bollinger Bands is a strategy that calls for time and dedication to master. However, if you take the time to learn how it works, you can use it to your advantage in the trading world, bolstering your strategy while increasing your earnings. In trading, remember that finding opportunities is just half the battle; the other half is risk management. Never put more money at risk in the market than you can afford to lose.
Read the full article
#BollingerBands#ForexTrading#MACD#MarketTrends#MovingAverage#PriceAction#RSI#StandardDeviation#TechnicalAnalysis#TradingSignals#TradingStrategy#Volatility
0 notes
Link
#AUMgrowth#BajajFinance#bankinglicense#bearishbias#BollingerBands#customeracquisitions#digitalecosystem#fintechinitiatives#loangrowth#loantrajectory#NBFC#netinterestmargin#NIMcompression#oversoldzone#paymentslandscape#RoE#stockmarket#targetprice#Tractor
0 notes
Text
https://blog.stockedge.com/bollinger-bands/
How to use Bollinger Bands?
Bollinger Bands are made up of a centre line and two price bands above and below it.
#BollingerBands#BollingerBandsFormula#HowToUseBollingerBands#StockScreenerIndia#StockScreener#StockMarketWebsite#ShareMarketWebsite#ToolforstockAnalysis#StockAnalysisTool#StockMarketBlogs
0 notes
Text

#IndicatorsMetatrader5#SupportResistance#BBands#Bollinger#Bollingerb#BollingerBands#JohnBollinger#mt5
0 notes
Text
Detaillierte Chartanalyse und Prognose für Bitcoin (BTC/USD)

Aktuelle Marktanalyse (31. Mai 2024)
Die vorliegenden Charts zeigen unterschiedliche Zeitrahmen und Indikatoren, die eine umfassende technische Analyse ermöglichen.
Kurzfristige Analyse (15-Minuten-Chart)
Stochastic RSI: Der Stochastic RSI zeigt aktuell eine überverkaufte Zone an (Werte unter 20), was auf eine mögliche kurzfristige Erholung hinweist.
Bollinger Bänder und Moving Averages: Der Preis liegt unterhalb des unteren Bollinger Bandes, was ebenfalls auf eine kurzfristige Überverkaufssituation hinweist. Der Kurs liegt auch unter den gleitenden Durchschnitten (9-MA und 20-MA), was auf einen Abwärtstrend hinweist.
RSI und MACD: Der RSI (Relative Strength Index) liegt bei etwa 33, was nahe der überverkauften Zone liegt. Der MACD zeigt negative Werte an und bestätigt den kurzfristigen Abwärtstrend.
Mittelfristige Analyse (1-Stunden-Chart)
Moving Averages und Bollinger Bänder: Der Preis befindet sich unterhalb der 9- und 21-Perioden gleitenden Durchschnitte, was auf einen mittelfristigen Abwärtstrend hinweist. Die Bollinger Bänder deuten auf eine erhöhte Volatilität hin.
Ichimoku Cloud: Der Preis liegt unterhalb der Ichimoku-Wolke, was einen anhaltenden Abwärtstrend bestätigt. Der Chikou Span ist ebenfalls unter dem Preis, was eine bärische Marktstimmung zeigt.
Volumenprofil: Das Volumenprofil zeigt eine erhöhte Aktivität in den letzten Stunden, was auf stärkeren Verkaufsdruck hinweist.
Langfristige Analyse (Tages-Chart)
Gleitende Durchschnitte: Der Preis liegt knapp über dem 100-Tage gleitenden Durchschnitt, was eine langfristige Unterstützung darstellt.
OBV (On-Balance Volume): Der OBV-Indikator zeigt eine Abflachung, was auf eine abnehmende Kaufkraft hinweist.
MACD: Der MACD-Indikator zeigt einen schwachen positiven Trend, der jedoch an Schwung verliert.
Prognose und Handelsempfehlungen
Long-Bereich
Einstiegspunkt: $67,200 (aktuelle Unterstützung)
TakeProfit: $68,800 (oberes Bollinger Band und vorheriger Widerstand)
StopLoss: $66,500 (unterhalb der aktuellen Unterstützung)
Short-Bereich
Einstiegspunkt: $68,400 (Widerstand nahe dem oberen Bollinger Band)
TakeProfit: $66,800 (unteres Bollinger Band und vorherige Unterstützung)
StopLoss: $69,200 (oberhalb des aktuellen Widerstands)
Leverage-Empfehlung
Aufgrund der erhöhten Volatilität und der aktuellen Marktunsicherheit wird ein moderates Leverage von 5x empfohlen. Dies ermöglicht eine angemessene Risikokontrolle bei gleichzeitiger Nutzung der Marktbewegungen.
Technische Einschätzung und Kursziel
Basierend auf der aktuellen technischen Analyse, scheint der kurzfristige Abwärtstrend wahrscheinlich weiterzugehen, bevor eine mögliche Erholung eintritt. Die Zielmarken für eine kurzfristige Bewegung liegen bei etwa $66,800 auf der Unterseite und $68,800 auf der Oberseite. Ein Durchbruch unter $66,500 könnte zu einem stärkeren Abverkauf führen, während ein Anstieg über $69,200 auf eine stärkere Erholung hindeuten könnte.
Es wird empfohlen, die Marktbedingungen regelmäßig zu überprüfen und die Positionen entsprechend anzupassen, um auf kurzfristige Veränderungen reagieren zu können.
Swing-Trading Empfehlung für Bitcoin (BTC/USD)
Swing-Trading zielt darauf ab, von mittelfristigen Preisbewegungen zu profitieren, indem Positionen über mehrere Tage bis Wochen gehalten werden. Basierend auf der aktuellen technischen Analyse der verschiedenen Charts, hier einige Empfehlungen:
Technische Indikatoren und Analyse
Bollinger Bänder: Der Preis bewegt sich am unteren Bollinger Band und könnte eine Erholung in Richtung des mittleren Bandes oder darüber hinaus erleben.
RSI (Relative Strength Index): Der RSI auf verschiedenen Zeitrahmen deutet auf eine überverkaufte Situation hin, was auf eine bevorstehende Erholung hindeuten könnte.
Ichimoku Cloud: Der Preis liegt unterhalb der Ichimoku-Wolke, was auf einen weiterhin bärischen Trend hindeutet. Ein Durchbruch über die Wolke wäre ein starkes Kaufsignal.
MACD (Moving Average Convergence Divergence): Der MACD zeigt negative Werte an, könnte jedoch bei einer Erholung ein Kaufsignal generieren.
Swing-Trading Setup
Long-Szenario
Einstiegspunkt: $67,200 (aktueller Unterstützungsbereich)
Zielbereich (Take Profit): $70,000 – $71,000 (nahe obere Widerstandslevel und oberes Bollinger Band)
Stop-Loss: $66,000 (unterhalb der aktuellen Unterstützung)
Begründung: Der Kurs zeigt kurzfristig überverkaufte Signale und könnte eine Erholung erleben. Ein Durchbruch über $68,500 würde die Erholung bestätigen und den Weg in Richtung $70,000 ebnen.
Short-Szenario
Einstiegspunkt: $68,800 (oberes Bollinger Band und Widerstandsbereich)
Zielbereich (Take Profit): $66,500 – $65,500 (nahe untere Unterstützung und unteres Bollinger Band)
Stop-Loss: $69,500 (oberhalb des aktuellen Widerstands)
Begründung: Falls der Kurs den Widerstand bei $68,800 nicht überwinden kann, könnte er wieder zurückfallen. Ein Abprallen von diesem Niveau würde eine Short-Position bestätigen.
Swing-Trading Strategie
Marktanalyse: Tägliche Überprüfung der Charts und Anpassung der Positionen basierend auf neuen technischen Signalen.
Risikomanagement: Setzen Sie immer einen Stop-Loss, um Ihr Kapital zu schützen. Für Swing-Trading wird empfohlen, nicht mehr als 2-3% des gesamten Handelskapitals pro Trade zu riskieren.
Positionsgröße: Basieren Sie die Größe Ihrer Position auf Ihrem Risikobudget und den Abständen zu Ihren Stop-Loss- und Take-Profit-Niveaus.
Leverage-Empfehlung
Für Swing-Trading wird ein moderates Leverage von 3x bis 5x empfohlen, um die Risiken zu kontrollieren und gleichzeitig von den Preisbewegungen zu profitieren. Zu hoher Leverage kann zu schnellen Verlusten führen, insbesondere in volatilen Märkten.
Fazit
Die aktuelle Marktstimmung zeigt eine kurzfristige Schwäche, jedoch könnten technische Indikatoren auf eine bevorstehende Erholung hindeuten. Es ist wichtig, flexibel zu bleiben und sich an die sich ändernden Marktbedingungen anzupassen. Ein ausgewogenes Risikomanagement und eine kontinuierliche Überprüfung der technischen Signale sind entscheidend für den Erfolg im Swing-Trading.
Langfristige Aussichten für Bitcoin (BTC/USD)
Technische Analyse der langfristigen Charts
Tages-Chart
100-Tage und 200-Tage Gleitende Durchschnitte (SMA): Der Bitcoin-Preis liegt derzeit über dem 100-Tage gleitenden Durchschnitt ($65,391), aber knapp darunter. Dies deutet auf eine langfristige Unterstützung hin. Der 200-Tage SMA liegt bei $61,992 und bildet eine wichtige langfristige Unterstützungsmarke.
Bollinger Bänder: Der Preis bewegt sich im mittleren Bereich der Bollinger Bänder, was auf eine neutrale bis leicht bullische Marktstimmung hindeutet.
RSI (14): Der RSI liegt bei 52 und befindet sich somit im neutralen Bereich, was keine überkaufte oder überverkaufte Marktsituation signalisiert.
MACD: Der MACD zeigt positive Werte an, was auf einen langfristigen Aufwärtstrend hinweisen könnte, obwohl der Impuls derzeit schwach ist.
Wöchentlicher Chart
Langfristige Trendlinien: Der langfristige Aufwärtstrend bleibt intakt, solange die Unterstützung bei den 200-Wochen SMA ($54,131) gehalten wird.
Ichimoku Cloud: Der Preis bewegt sich innerhalb der Ichimoku-Wolke, was auf eine Phase der Unsicherheit hinweist. Ein Durchbruch über die Wolke wäre ein starkes Kaufsignal.
On-Balance Volume (OBV)
OBV: Der OBV-Indikator zeigt eine Seitwärtsbewegung, was auf eine ausgeglichene Kauf- und Verkaufstätigkeit hinweist. Ein Anstieg des OBV wäre ein positives Zeichen für steigendes Interesse der Käufer.
Fundamentale Analyse
Marktakzeptanz und institutionelle Investitionen: Die zunehmende Akzeptanz von Bitcoin als Anlageklasse durch institutionelle Investoren, einschließlich Hedgefonds und Unternehmen, stärkt die langfristige bullische Perspektive.
Regulierung und Marktinfrastruktur: Fortschritte in der Regulierung und der Ausbau der Marktinfrastruktur (z.B. ETFs, regulierte Börsen) werden die Stabilität und das Vertrauen in Bitcoin weiter erhöhen.
Langfristige Prognose und Kursziele
Bullisches Szenario
Zielbereich (2024-2025): $80,000 – $100,000
Begründung: Die technische Analyse zeigt, dass Bitcoin weiterhin in einem langfristigen Aufwärtstrend bleibt. Fundamentale Faktoren wie zunehmende institutionelle Akzeptanz und positive Marktregulierungen könnten den Preis weiter in die Höhe treiben.
Bärisches Szenario
Zielbereich (2024-2025): $40,000 – $50,000
Begründung: Sollte es zu regulatorischen Rückschlägen oder einer signifikanten Marktkorrektur kommen, könnte der Preis auf die langfristigen Unterstützungsbereiche zurückfallen, die durch die 200-Tage SMA und 200-Wochen SMA definiert sind.
Handelsempfehlung für langfristige Investoren
Diversifikation: Langfristige Investoren sollten ihre Position in Bitcoin diversifizieren und nicht ihr gesamtes Kapital in eine einzige Anlageklasse investieren.
Dollar-Cost Averaging (DCA): Durch den regelmäßigen Kauf kleinerer Mengen Bitcoin können Investoren ihre Kostenbasis glätten und Marktschwankungen ausgleichen.
Hodling: Investoren sollten auf kurzfristige Marktvolatilität vorbereitet sein und an ihrer langfristigen Strategie festhalten. Hodling (langfristiges Halten) hat sich für viele Investoren als erfolgreich erwiesen.
Fazit
Die langfristigen Aussichten für Bitcoin bleiben positiv, unterstützt durch technische Indikatoren und fundamentale Faktoren. Ein vorsichtiger, gut diversifizierter Ansatz und die Anwendung von Dollar-Cost Averaging können helfen, die Risiken zu minimieren und von der langfristigen Wachstumsstory von Bitcoin zu profitieren. Die Kursziele von $80,000 bis $100,000 in einem bullischen Szenario und $40,000 bis $50,000 in einem bärischen Szenario bieten einen Rahmen für die zukünftige Entwicklung.
Disclaimer: Die bereitgestellten Informationen dienen ausschließlich zu Bildungs- und Informationszwecken und stellen keine Finanzberatung oder eine Aufforderung zum Kauf oder Verkauf von Finanzinstrumenten dar. Die technische Analyse und die daraus abgeleiteten Prognosen basieren auf historischen Daten und können keine zukünftige Marktentwicklung garantieren. Investitionen in Kryptowährungen sind mit hohen Risiken verbunden und können zum Verlust des eingesetzten Kapitals führen. Es wird empfohlen, vor einer Investitionsentscheidung eine gründliche eigene Recherche durchzuführen und gegebenenfalls einen professionellen Finanzberater zu konsultieren.
#Bitcoin#BTCUSD#Krypto#Cryptocurrency#TechnischeAnalyse#TechnicalAnalysis#Langfristig#LongTerm#SwingTrading#BullenMarkt#BullMarket#BärMarkt#BearMarket#RSI#MACD#BollingerBänder#BollingerBands#IchimokuCloud#Investition#Investment#Leverage#GleitendeDurchschnitte#MovingAverages#Marktanalyse#MarketAnalysis#Support#Widerstand#Resistance#Preisprognose#PricePrediction
0 notes
Video
youtube
Superior Quotex OTC Strategy | ADX and Bollinger Bands
0 notes
Text
Nifty Index Outlook: Key Levels to Watch for Market Movement
#bearishcandle #BollingerBands #closeabove19450 #correctioninthemarket #criticalforNiftysmovement #declinetowards1920019000levels #healthybuyinginterest #lackofconviction #marketsentiment #monitor19450level. #MovingAverages #narrowrange #nextfewsessions #Niftyindextechnicaloutlook #profitbooking #RelativeStrengthIndexRSI #strongglobalcues #successfulbreakout #target1960019700levels #technicalindicators #unexpectednegativedevelopment
#Business#bearishcandle#BollingerBands#closeabove19450#correctioninthemarket#criticalforNiftysmovement#declinetowards1920019000levels#healthybuyinginterest#lackofconviction#marketsentiment#monitor19450level.#MovingAverages#narrowrange#nextfewsessions#Niftyindextechnicaloutlook#profitbooking#RelativeStrengthIndexRSI#strongglobalcues#successfulbreakout#target1960019700levels#technicalindicators#unexpectednegativedevelopment
0 notes
Text
Bitcoin's 'Bollinger Band' signal indicates a potential surge, with predictions suggesting BTC could double by July.
Keep an eye on market trends and stay ahead in the cryptocurrency game.
0 notes
Text
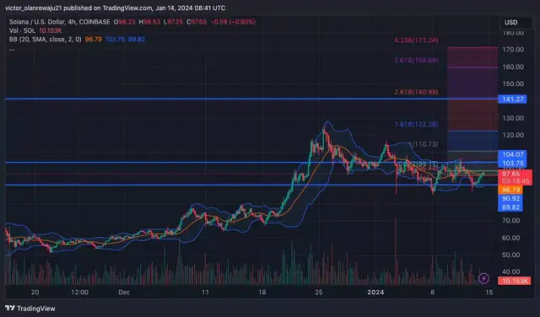
Solana (SOL) Price Analysis: Bulls Attempt Recovery After Recent Pullback
Solana (SOL) recently experienced a significant retracement following its surge above $100. During this correction, SOL's price dropped to $92.95, and on January 13, it continued to decline to $90.92 due to increased selling pressure.
Despite this, bulls made an effort to lift the price, utilizing the same region as support. On January 14, SOL's price recovered to $98.
If Solana can maintain itself above the lower Bollinger Band (BB), the token's price may rise to $104.07. However, this will only occur if the bulls remain active in the market.
In an extremely optimistic scenario, SOL could climb to $141.27, where the 2.618 Fibonacci extension is located. However, this would require a breakthrough of the $103.75 level, corresponding to the 0.382 Fibonacci level.
On the flip side, if bears take control, SOL's price could fall below $90. However, given the current dynamics, this seems highly unlikely.
The 4-hour SOL/USD chart from TradingView indicates that buyers are leading sellers, with the RSI at 52.77 as of the evening of January 14. If the RSI rises further, it could provide support for the initially possible bullish scenario.
A retest of the RSI value at 67.52 might push SOL towards $125, a price last seen on December 25, 2023. The Average Directional Index (ADX) stood at 15.69, indicating a neutral stance regarding a strong or weak trend.
At the same time, +DMI (green) and -DMI (red) were in stiff competition, suggesting that bulls haven't completely cleared the way. For a bullish trend confirmation, ADX (yellow) must exit the flat zone and rise above 25.
Moreover, +DMI should dominate -DMI. If this happens, confirming a bullish trend for SOL, the cryptocurrency may continue trading sideways otherwise.

Read the full article
0 notes
Text
Chiến lược giao dịch với nút thắt cổ chai Bollinger Band
Tổng quan về nút thắt cổ chai Bollinger Band. Tín hiệu giao dịch chi tiết tại:
https://forexno1.net/nut-that-co-chai-bollinger-band/
0 notes
Text
Understanding Technical Analysis in Cryptocurrency Trading & Market Sentiment

In the world of cryptocurrency trading, technical analysis plays a crucial role in helping traders forecast market movements. By examining price charts and using various indicators, traders aim to make informed decisions about buying and selling digital assets. Some popular technical analysis tools in the crypto market include Bollinger Bands, Fibonacci retracement levels, Moving Averages, and Candlestick patterns. These indicators help traders identify potential trends, reversals, and entry/exit points for their trades.
One of the key aspects of technical analysis is understanding market sentiment, whether it's bullish (optimistic) or bearish (pessimistic). Traders use tools like the Fear and Greed Index to gauge investor emotions and assess the overall market sentiment. Additionally, indicators like the Moving Average Convergence Divergence (MACD) and Relative Strength Index (RSI) help traders identify overbought or oversold conditions in the market. By combining these tools and techniques, traders can improve their chances of making successful trades in the volatile crypto market.
Technical analysis also involves recognizing chart patterns like Head and Shoulders, Triangles, and Breakouts, which can signal potential price movements. These patterns, along with support and resistance levels, provide valuable insights into market behavior and potential trading opportunities. Understanding tokenomics, the economic principles governing cryptocurrencies, is also essential for evaluating the long-term viability and stability of a digital asset. By staying informed about these technical analysis tools and concepts, traders can navigate the crypto market more effectively and make well-informed investment decisions. 📈
Related Hashtags: #BollingerBands, #Fibonacci, #CandlestickPatterns, #TechnicalAnalysis
Read the original article here
0 notes
Text
https://blog.stockedge.com/bollinger-bands/
How to use Bollinger Bands?
Bollinger Bands are made up of a centre line and two price bands above and below it.
#BollingerBands#BollingerBandsFormula#HowToUseBollingerBands#StockScreenerIndia#StockScreener#StockMarketWebsite#ShareMarketWebsite#ToolforstockAnalysis#StockAnalysisTool#StockMarketBlogs
0 notes
Last Seen Blogs

iridescene
WORLD'S END VALENTINE!

gendercorrecter
Gender Correcter

cuvepaciw
Untitled

papercrownsandpenguins
I Was the Turkey All Along

azjo-joestar
Bizarre Toolbar