#temperature map
Explore tagged Tumblr posts
Visit Tumblr Blog
Explore Tumblr blogs with no restrictions, modern design and the best experience.
Last Seen Tumblr Blogs


Fun Fact
Tumblr was named as a finalist in Lead411’s New York City Hot 125 in Aug 2010.
Text

Temperature Grid: 2024
The pattern is by Climbing Goat Designs, although I didn’t use their colors. I used the colors I've been using since 2018 just to be consistent. The fabric is 20 ct Lugana in the color Little Boy Blue by Zweigart.
Highs for December ranged from 15°F to 55°F
Lows ranged from 4°F to 45°F
Largest span: December 7 (High 50°F & Low 24°F) for 26 degrees
Smallest span: December 17 (High 39° & Low 33°) for 6 degrees
No, I don't live at O'Hare Int'l Airport. That's just the closest official weather station to me, yet it's still far enough away that I can't guarantee the temperature there is the same as in my town, so I didn't feel comfortable labeling it as the temperatures for my town.
#cross stitch#temperature map#climbing goat designs#finished#not!fandom#i don't know why i keep stitching things on blue fabric#my camera either wants to make the blue fabric white or the stitching all blue
20 notes
·
View notes
Text

Time to play America's favorite game show: #SpotTheColdFront!
2 notes
·
View notes
Photo

Temperature difference between Jan average low and Jul average high, showing the role mountains play in NW US climate
by DJCane/reddit
157 notes
·
View notes
Text

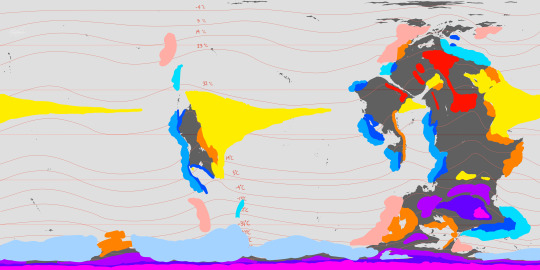
[Image Description: A map of the fictional planet Osmos V, a planet comprised of mostly land with a scattering of inland seas, the two largest of which could each fit all of the smaller seas with room to spare. The topography of the planet is shown with colors ranging from dark green to red-orange with large areas of green denoting low-lying regions and warmer colors showing higher and higher elevations. Around most bodies of water are patches denoting areas that receive regular rainfall, with brighter shades denoting rain and dark denoting heavy rain- red for northern hemisphere summer, blue for northern hemisphere winter, and raspberry where the two overlap. All together, the rainfall zones take up at maybe 20% of the map. /End description]
Hey! Look! Osmos V has precipitation maps now! So, ya know, if you were ever wondering 'but just how dry is this desert planet'... Pretty fucking dry. If it ain't a shade of red or blue, it's fucking dry.
Mad Ben's world? Everyone else is struggling but Kevin and Manny are sat there in the sunshine like nothing's up playing fucking Go Fish.
#osmos v#osmosians#'' 'boo hoo it's a hundred degrees out and there's no water' pansies!!''#you fuckers wait until i get the temperature maps done *that's* gonna be scary#summer temps on some parts of this planet are going to be fucking deadly for anything that isn't made of fire or capable of eating heat
7 notes
·
View notes
Text

Warm and cozy
#hyper-katt art#hyper katt art#digital art#artists on tumblr#my art#art#digital illustration#my oc#doodles#just laying in bed playing Infinity Nikki on my iPad#procreate art#temperature map doodle
9 notes
·
View notes
Text
The next phase of the Ayrum project was climate, which I'll introduce with the resource that made my work possible in the first place: these datasets created by Nikolai Lofving Hersfeldt, who runs WorldBuildingPasta and shared all of this with my client and me via Panoply. These were tremendously helpful and I wouldn't be able to achieve a fraction of the final detail without them.

My own adjustment to this data begins with Surface Temperature, which came down to correcting the coastlines (I mistakenly sent in a version of the elevation map that resulted in continental shelves appearing above sea level), refining the effects of elevation, and adding a color gradient.

I was then able to combine this data into Annual Minimum, Average, and Maximum temperature maps, seen above, which was pretty useful too.
One use for the Annual Average map, for example, was providing a baseline to compare each month's data against, seen in the sequence above.

And from the Annual Minimum and Maximum maps, I was able to create a map that presents the overall range of temperatures throughout the year, which does a good job of showing just how extreme the conditions are in higher latitudes and further inland.
#digital painting#imaginary climate maps#mapmaking#imaginary maps#Ayrum#Photopea#worldbuilding#commission#long term project#Surface Temperature maps#monthly data sequence#WorldBuildingPasta#Panoply#Christopher Maida Artwork
32 notes
·
View notes
Text

youtube
#India#Pakistan#for those not in the know#Both nations are nuclear powers#Usually the USA could be depended on to help lower the temperature#But I honest to god dont think trump could find Pakistan on a map
2 notes
·
View notes
Text
Mapped: The 10 Hottest and Coldest Countries
With the summer heating up, we all know what it’s like when it’s so hot that things get uncomfortable.
Well, what if the weather were that toasty all the time? The most discussed graphic this month highlights the countries with the highest (and lowest) average temperatures.

This visualization by Visual Capitalist kicked off a debate on whether certain countries were missed in the rankings, however users were quick to point out that these are average temperatures only, and not local extremes.
For example, although the U.S. has some sweltering cities, it also has some states that get very cold especially during the winter, that bring the overall average down.
🔥🔥🔥🔥🔥🔥🔥🔥🔥🔥🔥🔥🔥
#The Hottest & Coldest #Mapped
# global solidarity #global news
#global temperature #pucex
#xpuigc
5 notes
·
View notes
Text

s. s ave me, meoto…
#n o t me clinging to meoto to retain my sanity bc g o o d l o r d today was the worst#today was truly a very bad; very horrible day indeeeeeeed#man. today truly was a comedic tragedy in every way possible. i’d laugh if i were anyone else tbh#first i couldn’t start my workstation bc we were out of this cleaning acid thing.#t h e n this other branch lab sent over a precise amount of [reagent] that we needed to make the cleaning acid thing#*and* what’s worse was that they also demanded like. 1/5 of the acid we mixed. like bro. make it yourself mans.#but the worst part was when i tried to use a dropper to poke this sediment out of [tube i was supposed to be cleaning]#bUT THEN HALF OF THE DROPPER MELTED BC THAT BUGGER CAN’T HANDLE HIGH TEMPERATURES AAAAAAAAAAAAAA#stupid new droppers man. the old droppers could handle 100 degrees just fine. s o now the tube is clogged with melted plastic and it’s just.#life’s *really* great sometimes yk~~~~? (ʘ‿ʘ)#and so the night shift dude who came to take over the workstation against expectations seemed kinda pissed that i hadn’t started anything#and im just there. with my intestines wriggling about like internal abdominal worms. tryin not to cry in the face of my mistake.#while he’s fumin’ away like a freakin’ chimney or sth. like. man. no one asked you to take this workstation. you came here on your own. :(#anyway i ditched him and left for my break to calm myself down only to be approached by some random terribly lost middle aged to old lady#who was looking for directions to *somewhere* but she only spoke chinese aaaaaaaa#and i can’t read maps/i don’t even live in the area of my workplace so i have no idea if the lady managed to make it safely#but. lol. the lady showed me her message screen when she asked me for directions to her destination#and by pure coincidence the person she was texting is apparently related to someone with the same first name as me#the cons and cons of having common names man. i hope the lady managed to find her friend with the same name as me though lol#anyways. pls hw im begging. pls drop the crossfade for lxl birthday tmr i n e e d more meoto to carry on—#s o b s this is what im living for now ig. meoto………..
7 notes
·
View notes
Text

Temperature Butterflies 2023
The pattern is by StitchinMommy on Etsy, although I didn’t use her colors–I used the colors I’ve been using since 2018 to be consistent. The fabric is 18 ct. aida in the color Glacier by Vintage Needle Arts. The photo makes it look like a Wedgwood blue, but it's more of a Robin's egg blue that my camera somehow refuses to see and that I can only color correct to Wedgwood without blowing out the butterflies. 😠
Highs for December ranged from 33°F on December 19 to 59°F on December 25. It was one of our warmest Christmases, but it's an El Niño year and that usually means a mild winter for us.
Highs for 2023 ranged from 11°F on February 3 to 100°F on August 24. That's the first triple digit temperature since I started stitching these patterns, although not the first we've ever had. But I got to use a new color, so yay?
19 notes
·
View notes
Text

Ok I created some basic air temperature isotherm maps for Summer on Jom'Gol. While not EXACT, they should help me get a basic idea for surface temperature.
I also used a guide to add in some areas of significant temperature qualities.... cold costal areas, arid hotspots, warm water tropical gyres, cold areas, etc.
These are also very basic and not exact, but they helped me make some surface temperature calculations. Now I have to adjust my isotherms and I'm pretty close to getting on my surface temp maps !!
Working on the same thing for Winter as we SPEAK
#art#digital art#artists on tumblr#worldbuilding#jomgol#mapmaking#maps#speculative worldbuilding#temperature
6 notes
·
View notes
Text
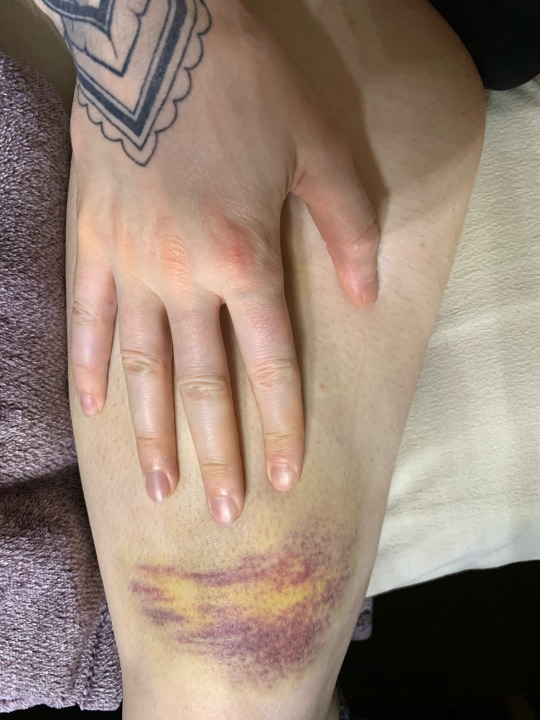
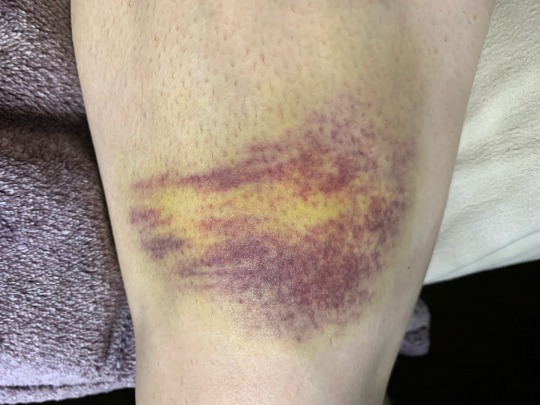
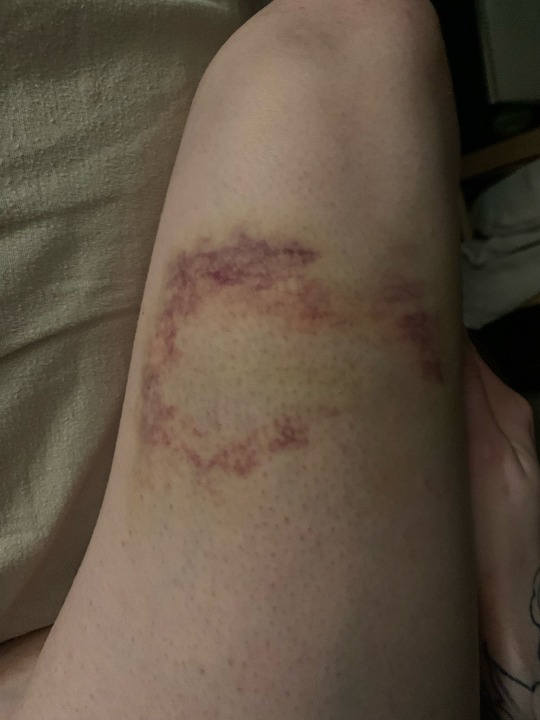
#this one i thought healed really cool#How the center drained and the outside remained#leaving a visually hollow space in the middle#evoking a contrast to the full feeling of the bruise as it happened#this was from a really solid messer strike to my thigh#i don’t wear thigh protection because I mostly spar for fun/improvement#and I thai boxed for years so getting my legs smashed is not that bad pain wise#and it’s a lot easier to regulate my body temperature without pants on.#although I think I had sweats on for this one#ps forgive my freshly plucked chicken looking legs#I’m not actually embarrassed but it is distinctly not aesthetic#i love how clearly you can see the profile of the muscle belly of my quadriceps#esp in the first photo#bruises are normal mapping but irl
2 notes
·
View notes
Photo

The Coldest Temperatures Around The World Mapped https://vividmaps.com/coldest-temperatures/
8 notes
·
View notes
Text

this is the firefox tabs of a man with several mental illnesses
#map to globe is my beautiful globe OMG i did a lot of work on it actually... i fixed up the poles a lot bc they were bothering me#they still arent perfect but yk. Unfortunately this does mean i have to redo the heightmap and ocean currents and by that token i have to#redo the temperature map Und the humidity map#but first i wanna redo the mountains bc i added a new mountain range that im Quite pleased with but its likee. previously all my mountains#were just kinda blobby shapes bc i was treating them more as likee. a series of altitudes#which tbf is what they were and it worked fine buttt i kinda wanna make them be more realistic mountain ranges.. ive already roughly#sketched out the ranges themselves like the lines and whatnot so probably tmrww i will go through and umm. yk.#i need to research more satellite imagery of actual mountain ranges so i can figure out the shape...#eventually One day im going to try and make my map actually look like a google earth kind of look at the world... but thats a ways away LOL
2 notes
·
View notes
Text

Sar Pass: Where the Mountains Showed Me Who I Am I signed up for the Sar Pass trek thinking it would be just another checkbox on my adventure list—a tough climb, pretty views, and a good story to tell afterward. I thought I was just here to hike. Turns out, the mountains had a lesson for me—and they weren’t gentle teachers. The second I stumbled into Parvati Valley, my city rhythm short-circuited. No more honking, no ping of texts—just my own heartbeat and the sound of snow compacting under my boots, like the earth whispering: Pay attention. The trail didn’t care about my excuses. Some days, the altitude punched the breath out of me. Other times, my legs burned so much I’d stop and glare at the next switchback like it had personally wronged me. But with every step, something stubborn in me woke up. Not the kind of stubbornness that clenches fists and fights, but the quiet kind—the one that whispers, "You’re still moving. That’s enough." Then came the nights. Oh, those nights. Inside my tent, wrapped in layers and my own thoughts, I’d unzip the door just to stare at the sky. A million stars, sharp and bright, like the mountains had pinpricked the darkness just to let the universe peek through. In those moments, I wasn’t a trekker or a city person or someone with a to-do list. I was just here, small and awestruck, part of something so much bigger. By the time I reached Sar Pass, the summit wasn’t even the point anymore. The real revelation had been the journey itself—how the wind carved patience into me, how the snow taught me to leave footprints but no baggage, how the trail mirrored life: brutal, beautiful, and worth every shaky step.
1 note
·
View note
Text
Brahmatal Trek: Frozen Dreams Await

Winter in the Himalayas unveils a mesmerising world of snow-covered landscapes, and the Brahmatal Trek is one of the best ways to witness this icy wonderland. Tucked away in Uttarakhand, this trek takes you through dense forests, scenic meadows, and breathtaking frozen lakes. Whether you’re a seasoned trekker or a first-timer, this journey promises an unforgettable adventure.
Understanding the route is essential before embarking on the trek. Starting from Lohajung, the trail winds through Mandoli Village and Khopdalia, leading to the stunning Brahmatal Lake. Along the way, trekkers pass through dense oak and rhododendron forests, vast meadows, and breathtaking viewpoints. Having a Brahmatal Trek Map ensures you stay on course while soaking in the beauty of the surroundings.
The Chilling Adventure: Brahmatal Trek Temperature
One of the biggest factors influencing this trek is the Brahmatal Trek Temperature. During peak winter, temperatures can drop to as low as -7°C at night, while daytime temperatures hover around 5°C to 10°C. Even in pre-winter and post-winter months, chilly winds and snowfall make this trek a thrilling yet challenging experience. Layering up with warm clothing and carrying high-quality trekking gear is a must!
When to Go: Brahmatal Trek Best Time
If you’re wondering about the Brahmatal Trek Best Time, the most magical months are from October to March. This is when the region is blanketed in snow, offering surreal landscapes and frozen lakes. While trekking is possible in other months, winter is when Brahmatal truly shines. However, avoid monsoons as trails can become slippery and difficult to navigate.
Reaching the Summit: Brahmatal Height
Situated at an impressive Brahmatal Height (12,150 feet), the summit offers an awe-inspiring panorama of snow-clad peaks. From the top, you get a spectacular view of Mt. Trishul and Mt. Nanda Ghunti. The sense of accomplishment upon reaching this height makes every step of the climb worthwhile.
Unpredictable Skies: Brahmatal Weather
The Brahmatal Weather can be quite dynamic. While winter months bring heavy snowfall, March onwards sees the snow gradually melting, revealing lush meadows beneath. The mornings are often clear, but afternoons can bring sudden cloud cover or light snowfall. Always check the weather forecast before your trek and be prepared for sudden temperature drops.
The Ultimate Snow Trek Experience
The Brahmatal Trek is more than just a winter trek; it’s a journey into a land where nature paints its most mesmerizing landscapes. From the frozen beauty of Brahmatal Lake to the thrill of trekking at high altitudes, this adventure promises memories that will last a lifetime. Ready to experience the magic of snow-covered mountains? Lace up your boots and take the plunge into this winter wonderland!
#Brahmatal Trek Map#Brahmatal Trek Temperature#Brahmatal Trek Best Time#Brahmatal Height#Brahmatal Weather
0 notes