#three tier architecture of data warehouse
Explore tagged Tumblr posts
Visit Tumblr Blog
Explore Tumblr blogs with no restrictions, modern design and the best experience.
Last Seen Tumblr Blogs


Fun Fact
Tumblr was named as a finalist in Lead411’s New York City Hot 125 in Aug 2010.
Text
The Three Tier Architecture for Data Warehouses consists of the bottom tier, which stores the data in a centralized database; the middle tier, which provides an analysis layer for processing and querying the data; and the top tier, which offers a user interface for reporting and visualization, facilitating data-driven decision-making.Check here to learn more.
0 notes
Text
Exploring Data Warehouse Architecture: The Backbone of Modern Analytics
In today’s data-driven world, organizations are inundated with vast amounts of data from diverse sources. To make sense of this data and leverage it for decision-making, businesses turn to data warehousing. At the heart of this process lies data warehouse architecture, a blueprint that structures how data is stored, managed, and accessed for analytics. Understanding this architecture is crucial for businesses aiming to harness the full potential of their data.
What is Data Warehouse Architecture?
Data warehouse architecture is a well-defined framework that organizes data from multiple disparate sources into a centralized repository. This repository is optimized for querying, reporting, and analysis, making it a cornerstone of business intelligence (BI). Unlike operational databases designed for transaction processing, data warehouses focus on read-heavy operations and support complex analytical queries.
The architecture ensures that data flows seamlessly from various sources into the data warehouse, where it is transformed into a consistent, usable format. This process not only enhances data quality but also enables organizations to generate valuable insights, track trends, and make informed decisions.
Core Components of Data Warehouse Architecture
A typical data warehouse architecture is divided into three primary layers:
Data Sources: This layer encompasses all the systems, platforms, and devices that generate raw data. Data sources can include:
Operational databases (e.g., relational databases like MySQL or Oracle).
Enterprise applications (e.g., ERP and CRM systems).
External data sources (e.g., social media feeds, weather data, or market research).
IoT devices and other real-time data streams.
The diversity of data sources highlights the need for a robust architecture that can handle structured, semi-structured, and unstructured data formats.
Data Staging Area: The staging layer is where data undergoes the Extract, Transform, Load (ETL) or Extract, Load, Transform (ELT) processes.
Extraction involves pulling raw data from multiple sources.
Transformation ensures the data is cleaned, deduplicated, and standardized into a consistent format.
Loading transfers the transformed data into the data warehouse for storage.
This layer is crucial for ensuring data accuracy, consistency, and reliability, as raw data is often messy and incomplete.
Data Warehouse Storage: The data warehouse itself serves as the central repository. It organizes data in a way that supports efficient querying and analysis. Two common storage models are:
Star Schema: Simplifies querying by organizing data into fact and dimension tables.
Snowflake Schema: Normalizes dimension tables to reduce redundancy.
Modern data warehouses often leverage columnar storage formats, which are optimized for analytical workloads by reducing storage space and speeding up query execution.
Presentation Layer: This is the user-facing layer where business users, analysts, and decision-makers interact with the data. Tools in this layer include:
Business intelligence (BI) platforms like Tableau, Power BI, or Looker.
SQL-based query tools for custom analysis.
Data visualization and reporting dashboards.
The goal of the presentation layer is to make insights accessible, enabling users to explore data, identify trends, and make data-driven decisions.
Types of Data Warehouse Architecture
Single-Tier Architecture: Focused on reducing data redundancy, this type integrates data into a single repository. While simple, it is less flexible and scalable compared to other architectures.
Two-Tier Architecture: In this design, the data staging and presentation layers are separate, offering improved performance. However, it may face challenges in scaling as data volumes grow.
Three-Tier Architecture: The most common and robust design, this architecture separates data sources, data warehouse storage, and the presentation layer. It provides scalability, flexibility, and high performance, making it ideal for complex analytical tasks.
Cloud-Based Architecture: With the rise of cloud computing, many organizations are adopting cloud-based data warehouses like Snowflake, Google BigQuery, and Amazon Redshift. These architectures offer:
Elastic scalability to handle growing data volumes.
Real-time data processing for faster insights.
Cost efficiency by utilizing pay-as-you-go models.
Benefits of a Well-Designed Data Warehouse Architecture
Centralized Data Management: Consolidating data from various sources into a single repository simplifies data governance and reduces silos.
Improved Data Quality: The ETL processes ensure that data is cleansed, standardized, and consistent, enhancing its reliability for decision-making.
Faster Insights: Optimized storage and querying mechanisms enable quicker access to insights, empowering businesses to act swiftly.
Scalability: Modern architectures, especially cloud-based ones, are designed to handle growing data volumes without compromising performance.
Enhanced Security: Robust security protocols in data warehouses protect sensitive information and ensure compliance with regulations like GDPR or HIPAA.
Future Trends in Data Warehouse Architecture
The field of data warehousing is evolving rapidly, with several trends shaping its future:
Integration with Artificial Intelligence (AI): AI-powered tools are enhancing data preprocessing, predictive analytics, and anomaly detection.
Real-Time Data Warehousing: The demand for instant insights is driving the adoption of architectures that support real-time data ingestion and analysis.
Hybrid and Multi-Cloud Solutions: Organizations are increasingly adopting hybrid architectures that combine on-premises and cloud environments for greater flexibility.
Data Lake Integration: Combining data warehouses with data lakes enables organizations to process both structured and unstructured data efficiently.
Conclusion
A well-architected data warehouse is more than just a repository; it is the backbone of a company’s analytics and business intelligence efforts. By providing a structured framework for data integration, storage, and access, data warehouse architecture empowers organizations to extract actionable insights, improve operational efficiency, and gain a competitive edge in the market. As technology evolves, embracing modern data warehousing practices and architectures will be essential for businesses looking to thrive in the era of big data and analytics.
0 notes
Text
Snowflake interview questions and answers

Snowflake provides cloud-based data warehousing that enables advanced solutions for organizational storage, handling, and analysis. Its unique characteristics include high speed, ease of use, and versatility making it stand out from other conventional offerings. Reporting and data warehousing are integral parts of any organization’s IT infrastructure.
To take on these tasks, Snowflake leverages the functionality of an innovative SQL query engine with a flexible architecture natively established for the cloud. This approach enables users to easily customize and start creating ready-to-query tables with little or no administration costs.
Snowflake Architecture:
Q: Can you explain the architecture of Snowflake?
A: Snowflake has a three-tier architecture: Compute, Storage, and Cloud Services. Compute handles query processing, Storage manages data storage, and Cloud Services coordinate and manage activities across the system.
2. Q: How does Snowflake handle scaling?
A: Snowflake can easily scale up or down by adding or removing virtual warehouses. Each warehouse consists of clusters of compute resources that can be adjusted based on the workload
SQL and Querying:
Q: What is the difference between a database and a schema in Snowflake?
A: In Snowflake, a database is a container for schemas, and a schema is a container for database objects. A database can contain multiple schemas, and each schema can contain tables, views, etc.
2. Q: How can you unload data from Snowflake to an external location?
A: You can use the COPY INTO command to unload data from Snowflake to an external location, such as an Amazon S3 bucket or Azure Data Lake Storage.
3. Q: Explain how data sharing works in Snowflake.
A: Data sharing in Snowflake allows sharing data between different accounts. A provider account can share a database or schema, and a consumer account can access the shared data using a share.
Security:
Q: What are Snowflake’s security features?
A: Snowflake provides features such as encryption at rest and in transit, multi-factor authentication, role-based access control (RBAC), and virtual private snowflake (VPS) for additional security.
Miscellaneous:
Q: How does Snowflake handle concurrency?
A: Snowflake’s multi-cluster, shared data architecture allows it to handle high levels of concurrency by scaling out compute resources. Each virtual warehouse operates independently and can be scaled up or down based on workload.
2.Q: Can you explain Snowflake’s time travel feature?
A: Snowflake’s time travel feature allows you to query data at a specific point in the past. There are two types: Time Travel (Data) lets you query historical data within a time window, and Time Travel (Schema) allows you to recover dropped or changed objects.
This course is designed to provide students with a solid understanding of the architecture and functionality of MuleSoft’s integration platform.
Advanced SQL and Performance Optimization:
1. Q: Explain Snowflake’s automatic clustering feature.
A: Snowflake’s automatic clustering optimizes data storage and query performance by organizing data based on usage patterns. It reduces the need for manual clustering and enhances query efficiency.
2. Q: How does Snowflake handle semi-structured data, and what are the benefits of using VARIANT data type?
A: Snowflake supports semi-structured data using the VARIANT data type, which allows storage of JSON, Avro, or XML data. VARIANT provides flexibility and performance benefits for handling nested and dynamic structures.
3. Q: Discuss the role of metadata in Snowflake and how it contributes to performance.
A: Snowflake uses metadata extensively to manage and optimize queries. Metadata includes information about data distribution, statistics, and storage, enabling the query optimizer to make informed decisions for efficient query execution.
Data Loading and Integration:
1. Q: Compare and contrast Snowflake’s different data loading options: COPY INTO, Snowpipe, and External Tables.
A: COPY INTO is used for batch loading, Snowpipe is a continuous data ingestion service, and External Tables allow querying data directly from external storage. Each option has specific use cases based on data volume and latency requirements.
2. Q: How does Snowflake handle data deduplication during data loading?
A: Snowflake’s automatic deduplication occurs during the data loading process. Duplicate records are identified based on the clustering key, and only unique records are stored, optimizing storage and improving query performance.
Administration and Monitoring:
1. Q: Explain the role of a Snowflake Virtual Warehouse. How can you optimize its performance?
A: A Virtual Warehouse (VW) is a compute resource in Snowflake. To optimize performance, consider adjusting the size of the virtual warehouse based on workload, using multiple warehouses for concurrency, and monitoring resource usage to make informed scaling decisions.
2. Q: What tools and techniques are available for monitoring and managing performance in Snowflake?
A: Snowflake provides features like Query Profile, Query History, and Resource Monitors for monitoring performance. External tools, such as Snowflake’s Snowsight or third-party tools, can also be used for performance analysis and optimization.
Case-Specific Scenarios:
1.Q: Describe a scenario where you might choose to use Snowflake’s secure data sharing feature.
A: Secure data sharing can be beneficial in scenarios where two organizations need to collaborate on analytics without physically moving data. For example, a retailer sharing sales data with a supplier for demand forecasting without exposing sensitive information.
2. Q: How would you design a data warehouse schema in Snowflake for a complex business analytics application with diverse data sources?
A: Consider factors such as data normalization, performance requirements, and access patterns. Leverage Snowflake’s features like clustering, semi-structured data types, and secure data sharing to design a schema that meets the application’s needs.
0 notes
Text
Data Warehouse Interview Questions
Data Warehouse Interview Questions. #sql #database #interview #query #schema #analytics #engineering #distributedcomputing #dataengineering #science #news #technology #data #trends #tech #architecture
Question: What is a Data Warehouse? Answer: A data warehouse is a repository of integrating data that are extracted from different data sources. Question: What are the different tiers in Data Warehouse architecture? Answer: The three tiers in the Data warehouse are as follows. Upper Tier Middle Tier Bottom Tier Question: What is Metadata or Data Dictionary? Answer: Metadata or Data…
View On WordPress
0 notes
Text
What is CBRS?

CBRS (Citizens Broadband Radio Service) has drawn much attention since the development of 5G technology becomes skyrocketed. But what on earth is CBRS?
What is CBRS?
CBRS, a 150 MHz wide broadcast band of the 3.5 GHz band (3.55 GHz to 3.7 GHz) in the United States, is also known as Band 48 (B48), which can be used for the deployment of private networks.
The Three-Tier CBRS Architecture
The access to the CBRS spectrum is shared among three sorts of users below: Tier 1: Incumbent users: the U.S. Navy and satellite ground stations Tier 2: Users with Priority Access Licenses (PALs): generally the operators who received the licenses by paying Tier 3: Users with General Authorized Access (GAA): the enterprises using this spectrum for private networks without obtaining a license

What's the function of CBRS?
Support large-scale expansion for Operators
Be used in FWA
Operate the mobile network for Enterprises and Governments
The use cases of CBRS
Port: to ensure the speed of transmission
Warehouse: to provide wider range of wireless connection
Enterprise: to operate network segment or to use private networks for data security...
However, CBRS is not the only band of spectrum available for private LTE and private 5G networks. So the policy of spectrum is always a noticeable topic in the telecom industry because it may influence the development of the market.
1 note
·
View note
Text
Data Warehousing: A Powerful Guide to Know Everything (2022)
An organization must be capable of accurate reporting and data analysis in the modern business climate. For various degrees of aggregation, including customer service, partner integration, and top-level executive business decisions, businesses require the consolidation and integration of their data. Data warehousing fills this gap by simplifying reporting and analysis. Data warehouse usage for managing company data also rises as a result of the increase in data.
In today's article, we will understand data warehousing in depth. So without any further ado, let's get started.
Data Warehousing: A Brief Introduction
Data warehouses (DWHs) are repositories where organizations store data electronically by separating it from operational systems and making it accessible for ad-hoc searches and scheduled reporting. Building a data warehouse, on the other hand, requires creating a data model that can produce insights quickly. In the operational environment, data is not the same as that which is kept in the DWH. It is set up so that pertinent information is grouped to make daily operations, analysis, and reporting easier. By using this information, users can make plans based on trends over time that have been identified. Therefore, it is even more crucial for firms to adopt data warehouses.
Data Warehousing Architecture
The enterprise's entire architecture for data transfer, processing, and presentation is defined by the data warehouse architecture. Despite the differences between each data warehouse, they nonetheless share several essential components in common.
Online transaction processing is built into production applications including inventory control, payroll, accounts payable, and purchase of products (OLTP). These programs acquire thorough information from ongoing operations.
Applications for data warehouses are made to accommodate user-specific, ad-hoc data requirements, which is now known as online analytical processing (OLAP). These consist of tools including trend analysis, summary reporting, profiling, forecasting, and more.
Dimensional models are used in data warehouse design to determine the most effective method for separating valuable information from unstructured data and transforming it into a structure that is simple to comprehend. But while creating a real-time corporate data warehouse, you need to keep in mind three main forms of architecture.
Architecture with a single tier
A two-tiered structure
Architecture in three tiers
Data Warehousing: Key Features
After understanding data warehousing and its architecture, we now proceed toward its key features. Here they are:
Subject-driven: Rather than focusing on the ongoing activities of the entire business, it offers information tailored to a particular subject. Information about products, sales statistics, client and supplier information, etc. are a few examples of subjects.
Integrated: It provides better data analysis by merging data from many sources, such as relational databases and flat files.
Time-Variant: Since the information in a DWH comes from a specific historical period, the data is categorized according to that period.
Non-volatile: When fresh data is added, older data that was previously there is not removed. Because a DWH and an operational database are separate, any frequent modifications made to the operational database do not affect the data warehouse.
Data Warehousing Examples
Big data is now an essential component of business intelligence and data warehousing across a variety of businesses. Let's look at a few instances of data warehousing in different industries that view it as a significant aspect of their daily operations.
Insurance and Investment
In the field of investments and insurance, a data warehouse is largely used to examine consumer and market trends as well as other data patterns. The importance of data warehouses can't be overstated in the forex and stock markets, two important subsectors where a single point discrepancy can result in widespread, huge losses. Real-time data streaming is the main focus of DWHs, which are typically shared in these industries.
Retail chains
DWHs are generally included for advertising and distribution in the retail industry to track products, look at pricing practices, monitor promotional offers, and assess consumer purchasing habits. For their demands in business intelligence and forecasting, retail chains typically use EDW systems.
Healthcare
In the healthcare industry, a DWH is employed to predict results, produce treatment reports, and communicate data with insurers, research facilities, and other medical facilities. Since the most recent, most accurate information on treatments is essential for preserving lives, EDWs constitute the foundation of healthcare systems.
Data Warehouses Types
Data warehouses generally come in three different varieties. Each performs a particular function in data management processes.
1- Enterprise Data Warehouse
EDW is key to successful decision-making throughout the departments of the company. The ability to conduct complicated queries, access to information from across organizations, and the ability to provide richer, long-range insights for data-driven choices and early risk assessment are some of the key advantages of having an EDW.
2- ODS (Operational Data Store)
The DWH in ODS is continuously updated. As a result, businesses frequently utilize it for standard business operations like keeping employee records. Enterprises leverage Operational Source Data to equip EDW with adequate data.
3- Data Mart
A department, area, or business unit is supported by this subset of a DWH. Take into account the following: You have several departments, such as those responsible for product development, sales, and marketing. There will be a central repository for data storage for each department. The term "data mart" refers to this source. Daily/weekly data storage in the ODS is done by the EDW using data from the data mart (or as configured). For data integration, the ODS serves as a staging place. To store the data and use it for BI, it is subsequently sent to the EDW.
Final Words
With this, we reach the end of this article. To summarize what we have discussed today, we first understood about data warehousing in brief. Then, we moved towards the architecture and features of data warehousing. Finally, we also looked at some examples and types of data warehousing.
If you have an interest in this subject and have data skills, data science is the perfect domain to start your career in, and if you require support and guidance, there is no institute better than Skillslash. Apart from having the recognition of the best data science institute in Bangalore, Skillslash also has a top-notch online presence. The Data Science Course In Bangalore with placement guarantee ensures you learn all the aspects of data science, apply them on real-time projects and get job assurance commitment or money back. Skillslash also offers Full Stack Developer Course In hyderabad with placement. To know more, Get in Touch with the support team. Good luck.
0 notes
Text
The Unique Architecture of The SAP HANA Data Lake
A data lake is a repository for data and is different from others in this genre like data warehouses. Data lakes allow data to be stored in its native format such as unstructured, semi-structured, or structured. Advanced data lakes with cutting-edge capabilities like SAP data lake is capable of improved database performance, faster access to data, and most critically at very cost-affordable rates.
SAP HANA Data Lake was launched in April 2020 and quickly introduced an element of robustness to the data lake environment. It also assured customers of a highly optimized data storage repository at cost-effective rates. SAP offered the complete package of a relational SAP data lake and a native storage extension out of the box. This helped to bring SAP data lake at par with the leaders in this niche like Microsoft Azure and Amazon Simple Storage Service in terms of data processing competencies and other functionalities.
SAP Data Lake Architecture
The SAP data lake architecture is unique with businesses having the option to store data frequently used and regularly accessed (hot data) separated from data that is not used much (warm data) stored in the Native Storage Extension (NSE) of SAP HANA.
To visualize the SAP data lake architecture, think of a pyramid divided into three layers.
The top portion of the pyramid contains data regularly accessed because it is critical for an organization to function. Hence, the costs of storing this data are very high too.
The middle of the pyramid or the second layer stores data not critical for daily operations but not so insignificant that it can be deleted from the system. This is warm data and is not as high-performing as the top tier hence, the cost of data storage is lower than the first layer.
The bottom half of the pyramid stores rarely-used data that in traditional databases would have been deleted to clear up storage space. But in SAP data lake, this space is offered at rock-bottom prices and companies prefer to hold on to the data for maintaining data history though access speeds are very slow here.
Therefore, in the SAP data lake, storage costs are lower than traditional data lakes where flat fees are levied regardless of the relevance of the data to the business. In SAP data lake, users can store data as per its importance and pay accordingly, thereby storing data through its full life cycle from hot to warm to cold data.
Innovative Features of the SAP Data Lake
One of the most innovative features of the SAP data lake is the 10x data compression capability. It leads to substantial reduction in costs as the volume of data stored is considerably reduced through compression. Further, users can either keep the SAP data lake in the existing HANA Cloud or move it to a new instance.
0 notes
Text
The Significant Role of Event-driven Apps in Software Development!

The ever-evolving digital revolution is transforming the way applications used to function. Since the past couple of years, apps have become way more advanced and complex with the usage of several innovative technologies, frameworks, and data centers. Here are some of the modern-age trends:
Implementing microservices architecture
Apps are moved to Cloud
Apps communicate with each other via lightweight protocols such as REST APIs, RPC calls, etc. instead of the erstwhile practice of sharing the same computational space.
These state-of-art practices have reshaped the methods of software development altogether. One such innovative approach is the usage of an event-driven architecture for building futuristic apps.
In traditional three-tier apps, data (base) used to be the core of the system. With the advent of event-driven applications, this focus shifted to events as well as the manner in which the events are flowing across the system. This shift has completely transformed the way how apps are designed.
This post takes you on an enlightening journey into the world of event-driven app development. Let’s explore the myriad aspects of event-driven architecture, its specific use cases as well as business benefits.
Event-driven Approach and the Data-driven Approach: Comparison
An event-driven architecture focuses on events, unlike the traditional model, service-oriented architecture that is based on data at rest. The shift from a data-centric model to an event-centric model means moving from the practice of gathering data/data lakes and emphasizing on data in flight as well as tracking the data while it is moving from one place to another. The event-driven model still considers data to be important; the only difference is that events become the most crucial component.
The service-oriented model prioritizes data and ensures that no data is lost; whereas the major focus of the event-oriented model is to ensure that you respond to the events as soon as they occur. This is because events are driven by a law of diminishing returns – as the events get older, their value diminishes. Nevertheless, both the service-oriented and the event-driven architectures are used together in most modern-era applications.
Understanding Event-driven Architecture?
Event-driven architecture refers to a specific kind of software architectural model that is used for designing an app. It is quite different from the conventional request-driven model. The reason is that, in an event-driven model, the core structure of the software solution is formed by the capture, processing, communication, as well as persistence of events.
This model is a programming approach implemented during product development and not a language or technology. Event-driven programming segregates the event-processing logic from the remaining portion of the program’s code. Hence, event-driven apps can be built using any programming language – most of the visual and object-oriented languages like Java, Visual Basic, Visual C++, etc. support this model.
What is an event?
An event is an identifiable occurrence or a change in the state that has significance for the hardware or the software of the system.
An event can originate from external as well as internal inputs. For instance, its source can be user-generated like the keystroke/mouse click, system-generated such as the loading of a program, or an external input like sensor output. The role of an event-driven app is to detect the events as soon as they take place and thereafter, manage/process those events employing event-handling processes.
Events: Examples
Take a look at some examples/use cases of events to serve diverse business requirements:
Web server: The receipt of an HTML message
Text editor: The pressing of a key or the request for resetting a password
Fraud detection: The detection of illegal trade patterns
Commercial business processes: The acceptance or rejection of a loan application
Real-time warehouse management: A warehouse updating its inventory, the arrival/delivery of a package to the desired location, or a robot reaching the desired destination.
Management System: A new rostering schedule being ready for distribution to the concerned personnel.
Gaming (Car racing): A car hitting another one in a computer game
Actions triggered as a response to events
Once the event notification is sent, this occurrence/change in state is captured by the system and then the app responds to the event. The aforementioned events are likely to trigger one or more actions as a response such as logging the event for further monitoring. Some instances of such responses are:
Virtual conferences where the sale of tickets are closed after all the seats are booked
An email for resetting the password is sent to the customer
The account involved in a fraudulent transaction is locked and the security team has been notified about this event
An order for more items (that are running low in the inventory) is placed
How does the Event-driven architectural Model function?
Event-driven architectures are employed for the purpose of building, detecting, consuming, and reacting to events. Publishers, subscribers, sources, and sinks are some of its crucial components. This is how they work.
Sources are the places where data gets generated.
The publisher captures the data contained within the event and then stores it in a repository.
This data is then consumed by the subscriber who potentially responds to the event.
Sinks refer to the destinations to where the data is sent by the subscribers.
For example, a retailer gathers data on every purchase that is taking place in all his stores around the globe. This data is fed into an event-driven system or app that is keeping a watch on fraudulent transactions and then sent to a credit card processor or for the next set of actions. From manufacturers’ perspective, they are informed about the data coming from their equipment that inform facts including temperature and pressure. This information obtained from the data helps them in real-time event monitoring and triggering of actions such as failure predictions, scheduling maintenance, etc.
Event-driven Architecture: Models and their Functions
Pub/sub Model:
This model is a messaging infrastructure that is based on subscriptions to a stream of events. After the occurrence/publishing of an event, it is sent to the concerned subscribers who are supposed to be informed.
Streaming Model:
Using this model, the events are written to a log instead of event consumers subscribing to an event stream. This model enables the event consumers to not only read any portion of the event stream but also join the stream at any time.
Event streaming is categorized into three types.
Event stream processing:
This category makes use of a data streaming platform such as Apache Kafka for ingesting events and processes or for transforming the event stream. This type of streaming is used for detecting meaningful patterns in the event streams.
Simple Event processing:
Under this category, an event triggers an action in the event’s consumer almost immediately.
Complex Event processing:
With this category, an event consumer is needed for processing a series of events to detect patterns.
What kind of Apps/Software Systems is best suited for Event-driven Architecture?
Event-driven app development leads to the creation of digital enterprise app solutions that are more agile, contextual, scalable, and responsive.
As the events take place, they are captured from their sources like IoT devices, apps, networks, etc. For this reason, the event producers, as well as consumers, can share the response information and status in real-time.
Owing to its scalability, this architecture allows you to create as well as respond to several events in real-time. So, modern-era apps that need to make use of consumer data in real-time, adopt this approach.
This approach is an ideal pick for future-friendly apps with distributed architectures because event-driven architecture allows minimal coupling.
Event-driven architecture is loosely coupled as the producers have no knowledge about the event consumers who are listening for an event and the events are not aware of the consequences of their occurrence. Therefore, it is a perfect pick for loosely coupled software like microservices. Microservices are designed for performing specific tasks based on event occurrences.
The event-driven model turns out to be very versatile as it functions well with unpredictable and non-linear events.
Event-driven Architecture: Business Benefits
The benefits of event-driven development are as follows:
Enterprises can obtain a flexible software system that is capable of adapting to changes and indulging in real-time decision-making.
Owing to this approach, businesses can think of their operations and generate data as events instead of viewing them as a couple of metrics on a quarterly/weekly report.
This real-time situational awareness enables business owners to make use of the available data that reflects the ongoing state of affairs of their systems while manual/automated decision-making processes. And, access to context and data leads to more effective and productive business decisions.
The organizational apps and systems utilizing the event-driven approach are more scalable and responsive as compared to other apps using traditional approaches.
How are Event-driven Applications hosted?
The aptest platform for hosting event-driven apps is the serverless platform. The reasons are given below:
Event processing needs simple responses unlike typical transaction processing wherein complex processing is needed.
Events may originate from any location.
The frequency of the events ranges from zero to tens of thousands each second.
The serverless platform has the capability to scale as per the rate of generation of events and is less likely to fail in situations when some of the cloud resources are lost.
Final words:
The software development industry has started focussing on event-driven applications to make their systems/apps future-ready and gain a competitive edge over peers. So, it’s high time to engage event-driven app developers for smartening and accelerating your business processes.
If you are looking to create an app using event-driven architecture, contact Biz4Solutions, a prominent event app development company. We have extensive experience in this architecture and our event app development services are worth a try!
0 notes
Photo

Data Pipeline Design: From Ingestion To Analytics
Using data pipelines, raw data is transported from software-as-a-service platforms and database sources to data warehouses, where it may be used by analytics and business intelligence (BI) tools to make decisions. It is possible for developers to create their own data pipelines by writing code and manually connecting with source databases; however, it is preferable to avoid reinventing the wheel and instead use a SaaS data pipeline.
Let’s take a look at the core components and phases of data pipelines, as well as the technologies available for duplicating data, to get a sense of how big of a revolution data pipeline-as-a-service is, and how much work goes into building an old-school data pipeline.
The architecture of the data pipeline
A data pipeline architecture is the design and structure of code and systems that copy, cleanse, and modify source data as needed, and then route it to destination systems such as data warehouses and data lakes, among other things.
A data pipeline’s processing speed is influenced by three factors: the amount of data being processed, the amount of data being moved, and how much data is being moved.
The rate, also known as throughput, of a pipeline, refers to how much data it can handle in a given length of time.
Reliability: Individual systems within a data pipeline must be fault-tolerant in order for the data pipeline to function reliably. It is possible to assure data quality by using a dependable data pipeline that includes built-in auditing, logging, and validation procedures.
Latency is defined as the amount of time it takes for a single unit of data to transit through a data pipeline. While latency is related to reaction time, it is less related to volume or throughput. When it comes to both pricing and processing resources, maintaining low latency may be a costly endeavour, and a company should find a balance in order to optimise the value it derives from analytics.
Data engineers should strive to make these elements of the pipeline more efficient in order to meet the demands of the company. When designing a pipeline, an enterprise must take into account its business objectives, the cost of the pipeline, as well as the type and availability of computational resources.
Building a data pipeline is a challenging task.
The architecture of the data pipeline is tiered. After that, each subsystem feeds data into the one before it reaches its target.
Sources of information
Considering that we’re talking about pipelines, we may think of data sources as the wells, lakes, and streams from which companies get their initial batch of information. Thousands of possible data sources are supported by SaaS providers, and every business maintains dozens of others on its own systems. Data sources are critical to the design of a data pipeline since they are the initial layer in the pipeline. There is nothing to ingest and move through the pipeline if the data is not of high quality.
Ingestion
As illustrated by our plumbing metaphor, the data pipeline’s ingestion components consist of operations that read data from data sources (i.e., the pumps and aqueducts). Extractions are performed on each data source using application programming interfaces (API) that are supplied by the data source. Before you can develop code that uses APIs, however, you must first determine what data you want to extract through a process known as data profiling. Data profiling is the process of assessing data for its features and structure, as well as evaluating how well it meets a business objective.
After the data has been profiled, it is ingested into the system, either in batches or in real time.
Batch ingestion and streaming ingestion
Batch processing is the process of extracting and operating on groups of records at the same time. Batch processing is sequential, and the ingestion mechanism reads, processes, and outputs groups of information based on criteria established in advance by developers and analysts. Batch processing is also known as sequential processing. The process does not continuously monitor for new records and move them forward in real-time, but rather operates on a timetable or responds in response to external events instead.
Streaming is an alternate data ingestion paradigm in which data sources automatically send individual records or units of information one at a time to the receiving system. Batch ingestion is used by all organisations for a wide variety of data types, but streaming ingestion is only used by businesses when they want near-real-time data for usage with applications or analytics that require the least amount of delay at the lowest feasible cost.
Depending on the data transformation requirements of a business, the data is either transferred into a staging area or delivered immediately along the flow path.
Transformation
Once data has been retrieved from source systems, it may be necessary to modify the data’s structure or format. Desalination stations, treatment plants, and personal water filters are the desalination stations, treatment plants, and personal water filters of the data pipeline.
Mapped values to more descriptive ones, filtering, and aggregation are all examples of transformations in data management. Combination is a particularly significant sort of transformation since it allows for more complex transformations. Included in this category are database joins, which take use of the relationships inherent in relational data models to bring together linked multiple tables, columns, and records in a single place.
Whether a company uses ETL (extract, transform, load) or ELT (extract, load, transform) as its data replication method in its data pipeline determines the time of any transformations (extract, load, transform). Early transactional load (ETL), an older technique that is still employed with on-premises data warehouses, can modify data before it is put into its intended destination. ELT is a data loading technique that may be used with contemporary cloud-based data warehouses to import data without doing any transformations. Users of data warehouses and data lakes can then perform their own transformations on the data contained within the warehouse or data lake.
Destinations
The data pipeline’s water towers and storage tanks serve as destinations. The primary destination for data repeated via the pipeline is a data warehouse. These specialist databases house all of an enterprise’s cleansed, mastered data in a single location for analysts and executives to utilise in analytics, reporting, and business intelligence.
Less-structured data may be fed into data lakes, where data analysts and data scientists can access massive amounts of rich and mineable information.
Finally, an organisation may input data into an analytics application or service that takes data feeds directly.
Monitoring
Data pipelines are complicated systems made up of software, hardware, and networking components, any of which might fail. Developers must build monitoring, logging, and alerting code to enable data engineers to maintain performance and fix any problems that emerge in order to keep the pipeline operational and capable of extracting and loading data.
Technologies and strategies for data pipelines
Businesses have two options when it comes to data pipelines: create their own or utilise a SaaS pipeline.
Organizations can delegate to their developers the responsibility of creating, testing, and maintaining the code necessary for a data pipeline. Several toolkits and frameworks may be used throughout the process:
Workflow management solutions can make it easier to create a data pipeline. Open-source technologies like Airflow and Luigi structure the pipeline’s operations, automatically resolve dependencies and allow developers to analyse and organise data workflows.
Event and messaging frameworks such as Apache Kafka and RabbitMQ enable organisations to create more timely and accurate data from their current systems. These frameworks gather events from business applications and make them available as high-throughput streams, allowing disparate systems to communicate using their own protocols.
Process scheduling is also important in any data pipeline. Many technologies, ranging from the basic cron utility to full specialised task automation systems, allow users to define comprehensive schedules regulating data intake, transformation, and loading to destinations.
Forget about building your own data pipeline; use Platingnum now. Platingnum transmits all of your data directly to your analytics warehouse.
https://platingnum.com/cloud-computing/data-pipeline-design-from-ingestion-to-analytics/
0 notes
Text
The Three Tier Architecture of Data Warehouse consists of the operational layer, which gathers data from various sources; the data integration layer, where ETL processes transform and consolidate data; and the presentation layer, which provides insights through reporting and analysis tools, enabling effective decision-making and strategic planning for organizations. Click here to learn more.
0 notes
Text
Enterprise Data Management Mastery Glossary Update

Enterprise Data Management: BI Mastery Glossary Terms
image
This month in my Enterprise Data Management class, I came across a few essential terms for my BI Mastery Glossary. Here are the terms below along with their definitions. Please note that the terms have been directly sourced from various sites and the definitions have not been edited. I have created usage / examples using my own words.
Data Warehouse Architecture
Data Warehouse Architecture encapsulates facets of data warehousing for an enterprise or business environment which consists of three tiers: bottom, middle and top.
Source: Chegg.com
Used in a sentence: A poor data warehouse architecture could cause inaccurate analyses and could influence bad decision-making.
Data Governance
Data governance (DG) is the overall management of the availability, usability, integrity and security of data used in an enterprise. A sound data governance program includes a governing body or council, a defined set of procedures and a plan to execute those procedures.
Source: TechTarget.com
Used in a sentence: Every organization who plans on leveraging big data to track KPIs should have a data governance committee to define their metrics.
Data Integrity
Data integrity refers to the accuracy and consistency (validity) of data over its lifecycle.
Source: DigitalGuardian.com
Used in a sentence: Data integrity is crucial to accurate analyses.
Data Collection
Data collection is the process of gathering and measuring information on variables of interest, in an established systematic fashion that enables one to answer stated research questions, test hypotheses, and evaluate outcomes.
Source: ORI.HHS.gov
Used in a sentence: Proper data collection can provide valuable insights.
Data Storage
Data storage is a general term for archiving data in electromagnetic or other forms for use by a computer or device.
Source: Techopedia.com
Used in a sentence: Data storage devices include flash drives, hard drives and compact discs (CDs).
Data Mining
Data Mining is an analytic process designed to explore data (usually large amounts of data - typically business or market related - also known as “big data”) in search of consistent patterns and/or systematic relationships between variables, and then to validate the findings by applying the detected patterns to new subsets of data.
Source: Statsoft.com
Used in a sentence: After data collection, hypotheses can be tested using data mining methods.
Data Management
Administrative process by which the required data is acquired, validated, stored, protected, and processed, and by which its accessibility, reliability, and timeliness is ensured to satisfy the needs of the data users.
Source: BusinessDictionary.com
Used in a sentence: Every database requires proper data management.
Dimensional Modeling
A database model that focuses on decision support outcomes rather than the normal relationships between data sets as in an entity relationship (ER) model.
Source: PCMag.com
Used in a sentence: Dimensional modeling which is used mostly for reporting makes data retrieval from a database easier.
Fact Tables
A fact table is the central table in a star schema or snowflake schema of a data warehouse and stores quantitative information for analysis.
Source: TechTarget.com
Used in a sentence: Both star and snowflakes schemas includes fact tables which point to various dimension tables.
Kimball BI/DW Life Cycle
The Kimball BI/DW Lifecycle methodology also known as the Business Dimensional Lifecycle approach provides an overall roadmap depicting the sequence of high level tasks required for successful DQ/BI projects.
Source: KimballGroup.com
Used in a sentence: The Kimball BI/DW Lifecycle methodology was developed in the 1980s.
ETL (Extraction, Transform, Load)
ETL is short for extract, transform, load, three database functions that are combined into one tool to pull data out of one database and place it into another database.
Source: Webopedia.com
Used in a sentence: ETL is used as a data integration method used to move data from one database to another.
I look forward to growing my BI Master Glossary in the coming months.
©2018 Richelle Desire
References:
Data Warehouse Architecture (2017). In Chegg. Retrieved July 29, 2018, fromhttps://www.chegg.com/homework-help/definitions/data-warehouse-architecture-3
Data governance (n.d.). In TechTarget . Retrieved July 29, 2018, fromhttp://searchdatamanagement.techtarget.com/definition/data-governance
Data integrity (2018). In Digital Guardian. Retrieved Retrieved July 29, 2018, from https://digitalguardian.com/blog/what-data-integrity-data-protection-101
Data Collection (2018). In Responsible Conduct in Data Management. Retrieved May 27, 2018, fromhttps://ori.hhs.gov/education/products/n_illinois_u/datamanagement/dctopic.html
Data Storage (2018). In Techopedia. Retrieved July 29, 2018, from https://www.techopedia.com/definition/23342/data-storage
What is Data Mining (Predictive Analytics, Big Data) (2018). In Statsoft. Retrieved July 29, 2018, from http://www.statsoft.com/Textbook/Data-Mining-Techniques#mining
Data Management (2018). In Business Dictionary. Retrieved July 29, 2018, from http://www.businessdictionary.com/definition/data-management.html
Encyclopedia (2018). In PC Mag. Retrieved July 29, 2018, fromhttps://www.pcmag.com/encyclopedia/term/62297/dimensional-modeling
Fact Table (2018). In Tech Target. Retrieved July 29, 2018, from http://searchdatamanagement.techtarget.com/definition/fact-table
Kimball DW/BI Lifecycle Methodology (2018). In Kimball Group. Retrieved July 29, 2018, from https://www.kimballgroup.com/data-warehouse-business-intelligence-resources/kimball-techniques/dw-bi-lifecycle-method/
ETL - Extract, Transform, Load (2018). In Webopedia. Retrieved July 29, 2018, from https://www.webopedia.com/TERM/E/ETL.html
1 note
·
View note
Photo

Which is the most popular language for three-tier web application development?
A 3-tier architecture is a type of software architecture that consists of three "tiers" or "layers" of logical computing. They are often used in applications such as a specific type of client-server system. 3-tier architectures offer many benefits to development and production environments by modularizing the user interface, business logic, and data warehouse layers. This gives development teams more flexibility because they can update a particular part of an application independently of the other parts. This added flexibility can reduce total time to market and shorten development cycle times by allowing development teams to replace or upgrade separate layers without affecting other parts of the system.
This architectural system is often ideal for embedding and integrating third-party software into an existing application. This integration flexibility also makes it ideal for incorporating analytics software into existing applications, and for this reason it is widely used by embedded analytics providers. 3-tier architectures are often used in on-premises or cloud applications, as well as SaaS (software as a service) applications.
This article is sponsored by https://itechscripts.com/. A leading resource of inspired clone scripts. It offers hundreds of popular scripts that are used by thousands of small and medium enterprises.
0 notes
Text
Scaling Datastores at Slack with Vitess
From the very beginning of Slack, MySQL was used as the storage engine for all our data. Slack operated MySQL servers in an active-active configuration. This is the story of how we changed our data storage architecture from the active-active clusters over to Vitess — a horizontal scaling system for MySQL. Vitess is the present and future of Datastores for Slack and continues to be a major success story for us. From the solid scalability fundamentals, developer ergonomics, and the thriving community, our bet on this technology has been instrumental for Slack’s continued growth. Our migration to Vitess began in 2017 and Vitess now serves 99% of our overall query load. We expect to be fully migrated by the end of 2020. In this post, we will discuss the design considerations and technical challenges that went into choosing and adopting Vitess, as well as an overview of our current Vitess usage. Availability, performance, and scalability in our datastore layer is critical for Slack. As an example, every message sent in Slack is persisted before it’s sent across the real-time websocket stack and shown to other members of the channel. This means that storage access needs to be very fast and very reliable.In addition to providing a critical foundation for message sending, over the last three years Vitess has given us the flexibility to ship new features with complex data storage needs, including Slack Connect and international data residency.Today, we serve 2.3 million QPS at peak. 2M of those queries are reads and 300K are writes. Our median query latency is 2 ms, and our p99 query latency is 11 ms.The beginning Slack started as a simple LAMP stack: Linux, Apache, MySQL, and PHP. All our data was stored on three primary database clusters based on MySQL: Shards: These virtually contained all the customer data tied to using Slack, such as messages, channels, and DMs. The data was partitioned and scaled horizontally by workspace id (a workspace is the specific Slack domain you login into). All the data for a given workspace was stored on the same shard, so the application just needed to connect to that one database. Metadata cluster: The metadata cluster was used as a lookup table to map a workspace id to the underlying shard id. This means that to find the shard for a particular Slack domain to a workspace, we had to lookup the record in this metadata cluster first. Kitchen sink cluster: This cluster stored all the other data not tied to a specific workspace, but that was still important Slack functionality. Some examples included the app directory. Any tables that did not have records associated with a workspace id would have gone into this cluster. The sharding was managed and controlled by our monolith application, “webapp”. All data access was managed by webapp, which contained the logic to look up metadata for a given workspace, and then create a connection to the underlying database shard. From a dataset layout perspective, the company started out using a workspace-sharded model. Each database shard contained all of a workspace’s data, with each shard housing thousands of workspaces and all their data including messages and channels. From an infrastructure point of view, all those clusters were made up of one or more shards where each shard was provisioned with at least two MySQL instances located in different datacenters, replicating to each other using asynchronous replication. The image below shows an overview of the original database architecture. Advantages There are many advantages to this active-active configuration, which allowed us to successfully scale the service. Some reasons why this worked well for us: High availability: During normal operations, the application will always prefer to query one of the two sides based on a simple hashing algorithm. When there are failures connecting to one of the hosts, the application could retry a request to the other host without any visible customer impact, since both nodes in a shard can take reads and writes. High product-development velocity: Designing new features with the model of having all the data for a given workspace stored on a single database host was intuitive, and easily extensible to new product functionality. Easy to debug: An engineer at Slack could connect a customer report to a database host within minutes. This allowed us to debug problems quickly. Easy to scale: As more teams signed up for Slack, we could simply provision more database shards for new teams and keep up with the growth. However, there was a fundamental limitation with the scaling model. What if a single team and all of their Slack data doesn’t fit our largest shard? View into how a single shard is configured with multi-primary replication Disadvantages As the company grew, so did the number of product teams working on building new Slack features. We found that our development velocity was slowing down significantly in trying to fit new product features into this very specific sharding scheme. This led to some challenges: Scale limits: As we onboarded larger and larger individual customers, their designated shard reached the largest available hardware and we were regularly hitting the limits of what that single host could sustain. Stuck to one data model: As we grew, we launched new products such as Enterprise Grid and Slack Connect, both of which challenge the paradigm that all data for a team will be on the same database shard. This architecture not only added complexity to developing these features, but also a performance penalty in some cases. Hot spots: We found that we were hitting some major hotspots, while also massively underutilizing the majority of our database fleet. As we grew, we onboarded more and more enterprise customers with large teams, consisting of thousands of Slack users. An unfortunate outcome with this architecture was that we were unable to spread the load of these large customers across the fleet and we ended up with a few hot spots in our database tier. Because it was challenging to split shards and move teams, and difficult to predict Slack usage over time, we over provisioned most of the shards, leaving the long tail underutilized. Workspace and shard availability concerns: All core features, such as login, messaging, and joining channels, required the database shard that housed the team’s data to be available. This meant that when a database shard experienced an outage, every single customer whose data was on that shard also experienced a full Slack outage. We wanted an architecture where we can both spread the load around to reduce the hot spots, and isolate different workloads so that a unavailable second tier feature couldn’t potentially impact critical features like message sending Operations: This is a not standard MySQL configuration. It required us to write a significant amount of internal tooling to be able to operate this configuration at scale. In addition, given that in this setup we didn’t have replicas in our topology and the fact that the application routed directly to the database hosts, we couldn’t safely use replicas without reworking our routing logic. What to do? In the fall of 2016, we were dealing with hundreds of thousands of MySQL queries per second and thousands of sharded MySQL hosts in production. Our application performance teams were regularly running into scaling and performance problems and having to design workarounds for the limitations of the workspace sharded architecture.— we needed a new approach to scale and manage databases for the future. From the early stages of this project, there was a question looming in our heads: should we evolve our approach in place or replace it? We needed a solution that could provide a flexible sharding model to accommodate new product features and meet our scale and operational requirements. For example, instead of putting all the messages from every channel and DM on a given workspace into the same shard, we wanted to shard the message data by the unique id of the channel. This would spread the load around much more evenly, as we would no longer be forced to serve all message data for our largest customer on the same database shard. We still had a strong desire to continue to use MySQL running on our own cloud servers. At the time there were thousands of distinct queries in the application, some of which used MySQL-specific constructs. And at the same time we had years of built up operational practices for deployment, data durability, backups, data warehouse ETL, compliance, and more, all of which were written for MySQL. This meant that moving away from the relational paradigm (and even from MySQL specifically) would have been a much more disruptive change, which meant we pretty much ruled out NoSQL datastores like DynamoDB or Cassandra, as well as NewSQL like Spanner or CockroachDB. In addition, historical context is always important to understand how decisions are made. Slack is generally conservative in terms of adopting new technologies, especially for mission-critical parts of our product stack. At the time, we wanted to continue to devote much of our engineering energy to shipping product features, and so the small datastores and infrastructure team valued simple solutions with few moving parts. A natural way forward could have been to build this new flexible sharding model within our application. Since our application was already involved with database shard routing, we could just bake in the new requirements such as sharding by channel id into that layer. This option was given consideration, and some prototypes were written to explore this idea more fully. It became clear that there was already quite a bit of coupling between the application logic and how the data was stored. It also became apparent that it was going to be time consuming to untangle that problem, while also building the new solution. For example, something like fetching the count of messages in a channel was tightly coupled to assumptions about what team the channel was on, and many places in our codebase worked around assumptions for organizations with multiple workspaces by checking multiple shards explicitly. On top of this, building sharding awareness into the application didn’t address any of our operational issues or allow us to use read replicas more effectively. Although it would solve the immediate scaling problems, this approach seemed positioned to run into the very same challenges in the long term. For instance, if a single team’s shard got surprisingly hot on the write path, it was not going to be straightforward to horizontally scale it. Why Vitess? Around this time we became aware of the Vitess project. It seemed like a promising technology since at its core, Vitess provides a database clustering system for horizontal scaling of MySQL. At a high level Vitess ticked all the boxes of our application and operational requirements. MySQL Core: Vitess is built on top of MySQL, and as a result leverages all the years of reliability, developer understanding, and confidence that comes from using MySQL as the actual data storage and replication engine. Scalability: Vitess combines many important MySQL features with the scalability of a NoSQL database. Its built-in sharding features lets you flexibly shard and grow your database without adding logic to your application. Operability: Vitess automatically handles functions like primary failovers and backups. It uses a lock server to track and administer servers, letting your application be blissfully ignorant of database topology. Vitess keeps track of all of the metadata about your cluster configuration so that the cluster view is always up-to-date and consistent for different clients. Extensibility: Vitess is built 100% in open source using golang with an extensive set of test coverage and a thriving and open developer community. We felt confident that we would be able to make changes as needed to meet Slack’s requirements (which we did!). Image from SquareCash Vitess blog post. Check out their cool work too! We decided to build a prototype demonstrating that we can migrate data from our traditional architecture to Vitess and that Vitess would deliver on its promise. Of course, adopting a new datastore at Slack scale is not an easy task. It required a significant amount of effort to set up all the new infrastructure in place. Our goal was to build a working end-to-end use case of Vitess in production for a small feature: integrating an RSS feed into a Slack channel. It required us to rework many of our operational processes for provisioning deployments, service discovery, backup/restore, topology management, credentials, and more. We also needed to develop new application integration points to route queries to Vitess, a generic backfill system for cloning the existing tables while performing double-writes from the application, and a parallel double-read diffing system so we were sure that the Vitess-powered tables had the same semantics as our legacy databases. However, it was worth it: the application performed correctly using the new system, it had much better performance characteristics, and operating and scaling the cluster was simpler. Equally importantly, Vitess delivered on the promise of resilience and reliability. This initial migration gave us the confidence we needed to continue our investment in the project. At the same time, it is still important to call out that during this initial prototype and continuing for the years since, we have identified gaps in Vitess in ways that it would not work for some of Slack-specific needs out of the box. As the technology showed promise at solving the core challenges we were facing, we decided it was worth the engineering investment to add-in the missing functionality. Some key contributions by Slack include: Refactoring the topology metadata service for scalability across isolation regions. Closing some of the gaps in full MySQL query compatibility. [a], [b], [c], [d], [e]. New tools to enable migrations of data into Vitess. New tools to load test and introspect Vitess. More robust integrations with Prometheus, Orchestrator, and Percona xtrabackup. And more! Today, it is not an overstatement to say that some of the folks in the open source community are an extended part of our team, and since adopting Vitess, Slack has become and continues to be one of the biggest contributors to the open source project. Now, exactly three years into this migration, we are sitting at 99% of all Slack MySQL traffic having been migrated to Vitess. We are on track to finish the remaining 1% in the next two months. We’ve wanted to share this story for a long time, but we waited until we had full confidence that this project was a success. Here’s a graph showing the migration progression and a few milestones over the last few years: There are many other stories to tell in these 3 years of migrations. Going from 0% to 99% adoption also meant going from 0 QPS to the 2.3 M QPS we serve today. Choosing appropriate sharding keys, retrofitting our existing application to work well with Vitess, and changes to operate Vitess at scale were necessary and each step along the way we learned something new. We break down a specific migration of a table that comprises 20% of our overall query load in a case study in Refactoring at Scale, written with Maude Lemaire, a Staff Engineer at Slack. We also plan on writing about our change in migration strategy and technique to move whole shards instead of tables in a future blog post. Has Vitess at Slack been a success? Today, we run multiple Vitess clusters with dozens of keyspaces in different geographical regions around the world. Vitess is used by both our main webapp monolith as well as other services. Each keyspace is a logical collection of data that roughly scales by the same factor — number of users, teams, and channels. Say goodbye to only sharding by team, and to team hot-spots! This flexible sharding provided to us by Vitess has allowed us to scale and grow Slack. During March 2020, as our CEO Stewart Butterfield tweeted, we saw an unprecedented increased usage of Slack as the reality of the COVID-19 pandemic hit the U.S. and work/school shifted out of offices and became distributed. On the datastores side, in just one week we saw query rates increase by 50%. In response to this, we scaled up one of our busiest keyspaces horizontally using Vitess’s splitting workflows. Without resharding and moving to Vitess, we would’ve been unable to scale at all for our largest customers, leading to downtime.As product teams at Slack started writing new services, they were able to use the same storage technology we use for the webapp. Choosing Vitess instead of building a new sharding layer inside our webapp monolith has allowed us to leverage the same technology for all new services at Slack. Vitess is also the storage layer for our International Data Residency product, for which we run Vitess clusters in six total regions. Using Vitess here was instrumental to being able to ship this feature in record time. It enabled our product engineering team to focus on the core business logic, while the actual region locality of the data was abstracted from their efforts. When we chose Vitess, we didn’t expect to be writing new services or shipping a multi-region product, but as a result of Vitess’s suitability and our investment in it over the last few years, we’ve been able to leverage the same storage technology for these new product areas. Now that the migration is complete, we look forward to leveraging more capabilities of Vitess. We have been already investing in VReplication, a feature that allows you to hook into MySQL replication to materialize different views of your data. The picture below shows a simplified version of what our Vitess deployment at Slack looks like. Conclusion This success still begs the question: Was this the right choice? In Spanish, there is a saying that states: “Como anillo al dedo”. It is often used when a solution fits with great exactitude. We think that even with the benefit of hindsight, Vitess was the right solution for us. This doesn’t mean that if Vitess didn’t exist, we would have not figured out how to scale our datastores. Rather, that with our requirements, we would have landed on a solution that would be very similar to Vitess. In a way, this story is not only about how Slack scaled its datastores. It is also a story that tells the importance of collaboration in our industry. We wanted to give a shout out to all the people that have contributed to this journey: Alexander Dalal, Ameet Kotian, Andrew Mason, Anju Bansal, Brian Ramos, Chris Sullivan, Daren Seagrave, Deepak Barge, Deepthi Sigireddi, Huiqing Zhou, Josh Varner, Leigh Johnson, Manuel Fontan, Manasi Limbachiya, Malcolm Akinje, Milena Talavera, Mike Demmer, Morgan Jones, Neil Harkins, Paul O’Connor, Paul Tuckfield, Renan Rangel, Ricardo Lorenzo, Richard Bailey, Ryan Park, Sara Bee, Serry Park, Sugu Sougoumarane, V. Brennan and all the others who we probably forgot. The post Scaling Datastores at Slack with Vitess appeared first on Slack Engineering. https://slack.engineering/scaling-datastores-at-slack-with-vitess/?utm_source=rss&utm_medium=rss&utm_campaign=scaling-datastores-at-slack-with-vitess
0 notes
Text
Coronavirus impact on Private LTE & 5G Network Market Growing Demand, Size, Share & Future Trends To 2030
JULY 27, 2020: With the standardization of features such as MCX (Mission-Critical PTT, Video & Data) services and URLCC (Ultra-Reliable Low-Latency Communications) by the 3GPP, LTE and 5G NR (New Radio) networks are rapidly gaining recognition as an all-inclusive critical communications platform for the delivery of both mission and business critical applications.
By providing authority over wireless coverage and capacity, Private LTE and 5G networks ensure guaranteed and secure connectivity, while supporting a wide range of applications - ranging from PTT group communications and real-time video delivery to wireless control and automation in industrial environments. Organizations across the critical communications and industrial IoT (Internet of Things) domains - including public safety agencies, militaries, utilities, oil & gas companies, mining groups, railway & port operators, manufacturers and industrial giants - are making sizeable investments in private LTE networks.

To Request A Sample Copy Of This Report @: https://www.radiantinsights.com/research/the-private-lte-and-5g-network-ecosystem-2020-2030/request-sample
The very first private 5G networks are also beginning to be deployed to serve a diverse array of usage scenarios spanning from connected factory robotics and massive-scale sensor networking to the control of AVGs (Automated Guided Vehicles) and AR/VR (Augmented & Virtual Reality). For example, Daimler's Mercedes-Benz Cars division is establishing a local 5G network to support automobile production processes at its ""Factory 56"" in Sindelfingen, while the KMA (Korea Military Academy) is installing a dedicated 5G network in its northern Seoul campus to facilitate mixed reality-based military training programs - with a primary focus on shooting and tactical simulations.
In addition, with the emergence of neutral-host small cells, multi-operator connectivity and unlicensed/shared spectrum access schemes, the use of private LTE and 5G networks in enterprise buildings, campuses and public venues is expected to grow significantly over the coming years. The practicality of spectrum sharing schemes such as the three-tiered CBRS (Citizens Broadband Radio Service) framework and Japan's unlicensed sXGP (Shared Extended Global Platform) has already been proven with initial rollouts in locations such as corporate campuses, golf courses, race tracks, stadiums, airports and warehouses.
A number of independent neutral-host and wholesale operators are also stepping up with pioneering business models to provide LTE and 5G connectivity services to both mobile operators and enterprises, particularly in indoor settings and locations where it is technically or economically not feasible for traditional operators to deliver substantial wireless coverage and capacity.
To Browse Full Research Report @: https://www.radiantinsights.com/research/the-private-lte-and-5g-network-ecosystem-2020-2030
Topics Covered
The report covers the following topics:
- Private LTE and 5G network ecosystem
- Market drivers and barriers
- System architecture and key elements of private LTE and 5G networks
- Analysis of vertical markets and applications - ranging from mobile broadband and mission-critical voice to domain-specific applications such as CBTC (Communications-Based Train Control) and connected robotics for factory automation
- Operational models for private LTE and 5G networks including independent, managed, shared core, hybrid commercial-private and private MVNO networks
- Mission-critical PTT/video/data services, deployable LTE/5G systems, cellular IoT, TSN (Time Sensitive Networking), URLLC (Ultra-Reliable Low-Latency Communications) techniques, quantum cryptography, unlicensed/shared spectrum, neutral-host/multi-operator small cells, network slicing, MEC (Multi-Access Edge Computing) and other enabling technologies
- Key trends including the adoption of local and shared spectrum licensing, commercial readiness of private 5G systems for Industry 4.0, nationwide and city-wide public safety broadband network build-outs, regional mission/business-critical LTE networks for utilities and energy companies, localized private LTE/5G networks for railway infrastructure, ports, airports, mines, factories, warehouses, buildings, campuses and public venues, and pioneering neutral-host business models for enterprise and public wireless connectivity.
- Review of private LTE and 5G network engagements worldwide, including case studies of more than 40 live networks
- Spectrum availability, allocation and usage for private LTE and 5G networks across the global, regional and national regulatory domains
- Standardization, regulatory and collaborative initiatives
- Future roadmap and value chain
- Profiles and strategies of over 600 ecosystem players including LTE/5G network infrastructure suppliers and vertical-domain specialists
- Strategic recommendations for end users, LTE/5G network infrastructure suppliers, system integrators and commercial/private mobile operators
- Market analysis and forecasts from 2020 till 2030
Forecast Segmentation
Market forecasts are provided for each of the following submarkets and their subcategories:
Submarkets
RAN (Radio Access Network)
- Mobile Core
- Backhaul & Transport
Air Interface Technologies
- LTE
- 5G
Spectrum Types
- Licensed Spectrum
- Unlicensed/Shared Spectrum
Unlicensed/Shared Spectrum Frequency Bands
- 1.9 GHz sXGP/DECT
- 2.4 GHz
- 3.5 GHz CBRS
- 5 GHz
- Other Bands
Vertical Markets
- Critical Communications & Industrial IoT
• Public Safety
• Military
• Energy
• Utilities
• Mining
• Transportation
• Factories & Warehouses
• Others
- Enterprise & Campus Environments
- Public Venues & Other Neutral Hosts
Regional Markets
- Asia Pacific
- Eastern Europe
- Middle East & Africa
- Latin & Central America
- North America
- Western Europe
Key Questions Answered
The report provides answers to the following key questions:
- How big is the private LTE and 5G network opportunity?
- What trends, drivers and barriers are influencing its growth?
- How is the ecosystem evolving by segment and region?
- What will the market size be in 2023, and at what rate will it grow?
- Which vertical markets and regions will see the highest percentage of growth?
- What is the status of private LTE and 5G network adoption worldwide, and what are the primary usage scenarios of these networks?
Key Findings
The report has the following key findings:
- Expected to reach $4.7 Billion in annual spending by the end of 2020, private LTE and 5G networks are increasingly becoming the preferred approach to deliver wireless connectivity for critical communications, industrial IoT, enterprise & campus environments, and public venues. The market will further grow at a CAGR of 19% between 2020 and 2023, eventually accounting for nearly $8 Billion by the end of 2023.
- SNS Telecom & IT estimates that as much as 30% of these investments - approximately $2.5 Billion - will be directed towards the build-out of private 5G networks which will become preferred wireless connectivity medium to support the ongoing Industry 4.0 revolution for the automation of factories, warehouses, ports and other industrial premises, besides serving additional verticals.
- Favorable spectrum licensing regimes - such as the German Government's decision to reserve frequencies in the 3.7 - 3.8 GHz range for localized 5G networks - will be central to the successful adoption of private 5G networks.
- A number of other countries - including Sweden, United Kingdom, Japan, Hong Kong and Australia - are also moving forward with their plans to identify and allocate spectrum for localized, private 5G networks with a primary focus on the 3.7 GHz, 26 GHz and 28 GHz frequency bands.
- The very first private 5G networks are also beginning to be deployed to serve a diverse array of usage scenarios spanning from connected factory robotics and massive-scale sensor networking to the control of AVGs (Automated Guided Vehicles) and AR/VR (Augmented & Virtual Reality).
- For example, Daimler's Mercedes-Benz Cars division is establishing a local 5G network to support automobile production processes at its ""Factory 56"" in Sindelfingen, while the KMA (Korea Military Academy) is installing a dedicated 5G network in its northern Seoul campus to facilitate mixed reality-based military training programs - with a primary focus on shooting and tactical simulations.
List of Companies Mentioned
• 3GPP (Third Generation Partnership Project)
• 450 MHz Alliance
• 450connect
• 4K Solutions
• 5G PPP (5G Infrastructure Public Private Partnership)
• 5GAA (5G Automotive Association)
• 5G-ACIA (5G Alliance for Connected Industries and Automation)
• 5G-IA (5G Infrastructure Association)
• 7Layers
• A1 Telekom Austria Group
• Aaeon Technology
• AAR (American Association of Railroad)
• ABB
• Abu Dhabi Police
• Accelleran
• Accenture
• ACCF (Australasian Critical Communications Forum)
• Accton Technology Corporation
• Accuver
• Ace Technologies Corporation
• AceAxis
• ACMA (Australian Communications and Media Authority)
• Adax
• Addis Ababa Light Rail
• ADF (Australian Defence Force)
• ADLINK Technology
• ADNOC (Abu Dhabi National Oil Company)
• ADR (Aeroporti di Roma)
• ADRF (Advanced RF Technologies)
• ADTRAN
• ADVA Optical Networking
• Advantech
• Advantech Wireless
• Aegex Technologies
• AEP Renewables
• AeroMobile Communications
• AeroVironment
• Affarii Technologies
• Affirmed Networks
Many More……………………….
To See More Reports of This Category by Radiant Insights: https://latestmarkettrends.news.blog/
About Radiant Insights: Radiant Insights is a platform for companies looking to meet their market research and business intelligence requirements. It assist and facilitate organizations and individuals procure market research reports, helping them in the decision making process. The Organization has a comprehensive collection of reports, covering over 40 key industries and a host of micro markets. In addition to over extensive database of reports, experienced research coordinators also offer a host of ancillary services such as, research partnerships/ tie-ups and customized research solutions.
Media Contact: Company Name: Radiant Insights, Inc Contact Person: Michelle Thoras Email: [email protected] Phone: (415) 349-0054 Address: 201 Spear St #1100, Suite #3036 City: San Francisco State: California Country: United States
0 notes
Text
300+ TOP DATA WAREHOUSE Objective Questions and Answers
Data Warehouse Multiple Choice Questions :-
1. Which of the following features usually applies to data in a data warehouse? A.Data are often deleted B.Most applications consist of transactions C.Data are rarely deleted D.Relatively few records are processed by applications Ans: c 2. Which of the following statement is true? A.The data warehouse consists of data marts and operational data B.The data warehouse is used as a source for the operational data C.The operational data are used as a source for the data warehouse D.All of the above Ans: c 3. The following is true of three-tier data warehouses: A.Once created, the data marts will keep on being updated from the data warehouse at periodic times B.Once created, the data marts will directly receive their new data from the operational databases C.The data marts are different groups of tables in the data warehouse D.A data mart becomes a data warehouse when it reaches a critical size Ans: a 4. The following technology is not well-suited for data mining: A.Expert system technology B.Data visualization C.Technology limited to specific data types such as numeric data types D.Parallel architecture Ans: c 5. What is true of the multidimensional model? A.It typically requires less disk storage B.It typically requires more disk storage C.Typical business queries requiring aggregate functions take more time D.Increasing the size of a dimension is difficult Ans: b 6. The value at the intersection of the row labeled "India" and the column "Savings" in Table2 should be: A.800,000 B.300,000 C.200,000 D.300,000 Ans: a 7. We want to add the following capabilities to Table2: show the data for 3 age groups (20-39, 40-60, over 60), 3 revenue groups (less than $10,000, $10,000-$30,000, over $30,000) and add a new type of account: Money market. The total number of measures will be: A.4 B.More than 100 C.Between 10 and 30 (boundaries includeD. D.Between 40 and 60 (boundaries includeD. Ans: b 8. We want to add the following capability to Table2: for each type of account in each region, also show the dollar amount besides the number of customers. This adds to Table2: A.Another dimension B.Other column(s) C.Other row(s) D.Another measure for each cell Ans: d 9. The most common source of change data in refreshing a data warehouse is: A.Queryable change data B.Cooperative change data C.Logged change data D.Snapshot change data Ans: d 10. Which of the following statements is not true about refreshing a data warehouse: A.It is a process of managing timing differences between the updating of data sources and the related data warehouse objects B.Updates to dimension tables may occur at different times than the fact table C.The data warehouse administrator has more control over the load time lag than the valid time lag D.None of the above Ans: d
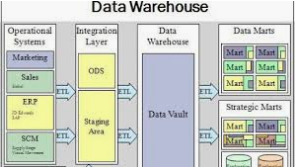
DATA WAREHOUSE MCQs 11. A data warehouse is which of the following? A. Can be updated by end users. B. Contains numerous naming conventions and formats. C. Organized around important subject areas. D. Contains only current data. Ans: C 12. An operational system is which of the following? A. A system that is used to run the business in real time and is based on historical data. B. A system that is used to run the business in real time and is based on current data. C. A system that is used to support decision making and is based on current data. D. A system that is used to support decision making and is based on historical data. Ans: B 13. The generic two-level data warehouse architecture includes which of the following? A. At least one data mart B. Data that can extracted from numerous internal and external sources C. Near real-time updates D. All of the above. Ans: B 14. The @active data warehouse architecture includes which of the following? A. At least one data mart B. Data that can extracted from numerous internal and external sources C. Near real-time updates D. All of the above. Ans: D 15. Reconciled data is which of the following? A. Data stored in the various operational systems throughout the organization. B. Current data intended to be the single source for all decision support systems. C. Data stored in one operational system in the organization. D. Data that has been selected and formatted for end-user support applications. Ans: B 16. Transient data is which of the following? A. Data in which changes to existing records cause the previous version of the records to be eliminated B. Data in which changes to existing records do not cause the previous version of the records to be eliminated C. Data that are never altered or deleted once they have been added D. Data that are never deleted once they have been added Ans: A 17. The extract process is which of the following? A. Capturing all of the data contained in various operational systems B. Capturing a subset of the data contained in various operational systems C. Capturing all of the data contained in various decision support systems D. Capturing a subset of the data contained in various decision support systems Ans: B 18. Data scrubbing is which of the following? A. A process to reject data from the data warehouse and to create the necessary indexes B. A process to load the data in the data warehouse and to create the necessary indexes C. A process to upgrade the quality of data after it is moved into a data warehouse D. A process to upgrade the quality of data before it is moved into a data warehouse Ans: D 19. The load and index is which of the following? A. A process to reject data from the data warehouse and to create the necessary indexes B. A process to load the data in the data warehouse and to create the necessary indexes C. A process to upgrade the quality of data after it is moved into a data warehouse D. A process to upgrade the quality of data before it is moved into a data warehouse Ans: B 20. Data transformation includes which of the following? A. A process to change data from a detailed level to a summary level B. A process to change data from a summary level to a detailed level C. Joining data from one source into various sources of data D. Separating data from one source into various sources of data Ans: A 21. A multifield transformation does which of the following? A. Converts data from one field into multiple fields B. Converts data from multiple fields into one field C. Converts data from multiple fields into multiple fields D. All of the above Ans: D 22. A star schema has what type of relationship between a dimension and fact table? A. Many-to-many B. One-to-one C. One-to-many D. All of the above. Ans: C 23. Fact tables are which of the following? A. Completely demoralized B. Partially demoralized C. Completely normalized D. Partially normalized Ans: C 24. A snowflake schema is which of the following types of tables? A. Fact B. Dimension C. Helper D. All of the above Ans: D 25. A goal of data mining includes which of the following? A. To explain some observed event or condition B. To confirm that data exists C. To analyze data for expected relationships D. To create a new data warehouse Ans: A 26. Which of the following statements does not apply to relational databases? A. Relational databases are simple to understand B. Tables are one of the basic components of relational databases C. Relational databases have a strong procedural orientation D. Relational databases have a strong mathematical foundation Ans: C 27. In the relational database terminology, a table is synonymous with: A. A column B. A row C. An attribute D. A relation Ans: D 28. A null value indicates: A. A numeric value with value 0 B. The absence of a value C. A very small value D. An erroneous value Ans: B 29. When the referential integrity rule is enforced, which one is usually not a valid action in response to the deletion of a row that contains a primary key value referenced elsewhere? A. Do not allow the deletion B. Accept the deletion without any other action C. Delete the related rows D. Set the foreign keys of related rows to null Ans: B 30. When an equi-join is performed on a table of N rows and a table of M rows, the resulting table has the following number of rows: A. M B. N C. The smaller of M or N D. A number in the range 0 to M*N Ans: D DATA WAREHOUSE Questions and Answers pdf Download Read the full article
0 notes