#tlt®
Text
What to expect from the stock market this week

Last week, the review of the macro market indicators saw heading into the unofficial end of summer and with August in the books, that equity markets showed a preference for some rest after the 3 week move higher. Elsewhere looked for Gold ($GLD) to continue its uptrend while Crude Oil ($USO) consolidated in a tightening range. The US Dollar Index ($DXY) continued to bounce to the upside while US Treasuries ($TLT) consolidated in their downtrend. The Shanghai Composite ($ASHR) looked to continue the downtrend while Emerging Markets ($EEM) consolidated over support in a possible start of a new uptrend.
The Volatility Index ($VXX) looked to remain low and stable making the path easier for equity markets to the upside. Their charts looked strong, especially on the longer timeframe. On the shorter timeframe the week long consolidation left the $SPY with only 2 hours to rocket to just shy of a new all-time high close while the $QQQ and the $IWM ended near the high of the week. All were prepped to start September stronger.
The week played out with Gold holding at the highs in consolidation while Crude Oil broke down to a nearly 10 month low. The US Dollar fell back from its quick bounce while Treasuries rose to test the December 2023 high. The Shanghai Composite fell to a 7 month low while Emerging Markets broke support to hit a 1 month low.
Volatility rose Monday out of the teens and held the rest of the week. This put pressure on equities and they responded by moving lower all week and closing the mid-August gaps. This resulted in the SPY, the QQQ and the IWM confirming lower highs as recession fear overtook the market. What does this mean for the coming week? Let’s look at some charts.
SPY Daily, $SPY

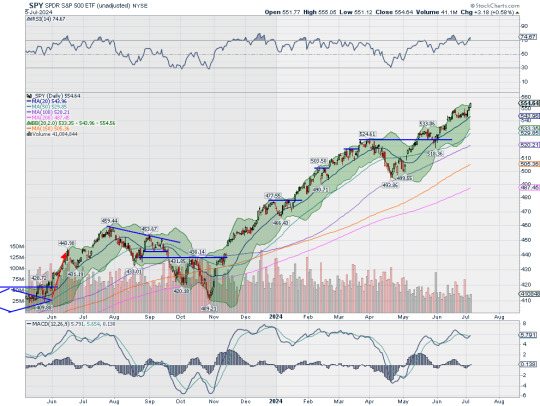
The SPY came into the week holding in consolidation just under the all-time high. It dropped Tuesday touching the 50 day SMA and held there through Thursday before a second big fall Friday closed the mid-August gap down. It closed at the lowest level since August 13th. The RSI is falling below the midline after making a lower high with the MACD crossed down but positive. The Bollinger Bands® are squeezing in with price now closing in on the 100 day SMA.
The weekly chart shows the confirmation of a reversal with a strong move lower following the doji. It ended at the 20 week SMA. There is also a momentum divergence with the RSI making a lower high as price made a higher high. The RSI remains bullish over the midline with the MACD positive but moving lower. There is support lower at 540 and 537 then 534 and 530 before 524.50 and 520.50. Resistance higher is at 542 and 545.75 then 549.50 and 556.50 before 561.50 and 565.50. Broad Consolidation with Possible Change of Character.
SPY Weekly, $SPY

With the first week of September in the books, equity markets reverted to weakness, trending lower all week. Elsewhere look for Gold to continue its uptrend while Crude Oil continues to move lower. The US Dollar Index continues in broad consolidation while US Treasuries show signs of a possible new uptrend. The Shanghai Composite looks to continue the downtrend while Emerging Markets drop back into a short term downtrend.
The Volatility Index looks to shift from low and stable to low and rising making the path more difficult for equity markets. Their charts look weak om the shorter time frame as price pulls back from a lower high, but they remain above making a lower low for now. On the longer timeframe they look stronger, but vulnerable with the SPY strongest then the IWM and the QQQ the weakest. Use this information as you prepare for the coming week and trad’em well.
Join the Premium Users and you can view the Full Version with 20 detailed charts and analysis: Macro Week in Review/Preview September 6, 2024
7 notes
·
View notes
Photo

Sabe aquele pequeno desconforto, aquele "INCOMODOZINHO"? . Ele pode se transformar em uma situação bem complicada, se você não perceber que ele existe. . E o nome disso é tomada de consciência... . . Mas, somente tomar consciência não faz o incômodo desaparecer. Pelo contrário! . Agora você percebe quando ele está presente e até, em alguns casos, quando ele está pra chegar... . Você pode até se surpreender com a quantidade de vezes que ele aparece, com a duração do incômodo e com a intensidade que ele vem alcançando! . Vai até achar que ele pode estar maior, pior, incomodando ainda mais, por não saber como lidar com ele. . . O que vai te ajudar a RESOLVER essa situação desagradável são as ações, as atitudes, os novos comportamentos e os novos hábitos! . Mais que a consciência, o que precisamos é de conscientizAÇÃO ( Consciência + AÇÃO ), de atitudes que nos ajudem a desatar os nós, a curar as dores, a cicatrizar as feridas, a mudar nosso estado interno, a exorcizar os fantasmas... . . E quando eu falo de incômodo, estou me referindo às dores, às lacunas, às feridas, aos anseios, e a todas as limitações, sejam físicas, emocionais, mentais, espirituais, energéticas... . . Por isso, meu amigo e minha amiga, CUIDE-SE! VALORIZE-SE! AME-SE!!!! . . E, se precisar, peça ajuda, procure um profissional, FAÇA TERAPIA! . . Já imaginou o quanto você vai se sentir melhor? . 🙌🏼✨❤️ . . . . ... #ACT #Terapia #Aceitação #Compromisso #Psicoterapia #Psicologia #PsicologiaPositiva #Mindfulness #MindfulnessFuncional #TLT® #PNL #TimeLineTerapy® #Programação #Neuro #Linguística #Hipnoterapia #HipnoseClínica #REC #Reeducação #Emocional #Comportamental ... . https://www.instagram.com/p/CWW2n00JW89/?utm_medium=tumblr
#act#terapia#aceitação#compromisso#psicoterapia#psicologia#psicologiapositiva#mindfulness#mindfulnessfuncional#tlt®#pnl#timelineterapy®#programação#neuro#linguística#hipnoterapia#hipnoseclínica#rec#reeducação#emocional#comportamental
0 notes
Text
What to expect from the stock market this week

Last week, the review of the macro market indicators saw with the Fed Jackson Hole meeting in the rear view mirror, that equity markets continued their progress higher, shifting from the large caps and tech names to small caps Friday, but without a rotation this time. Elsewhere looked for Gold ($GLD) to continue its uptrend while Crude Oil ($USO) consolidated in a narrow range and at risk for a drop. The US Dollar Index ($DXY) continued to move to the downside while US Treasuries ($TLT) consolidated in their downtrend. The Shanghai Composite ($ASHR) looked to continue the downtrend while Emerging Markets ($EEM) were prepped to start a new uptrend.
The Volatility Index ($VXX) looked to remain low and stabilizing making the path easier for equity markets to the upside. Their charts looked strong, especially on the longer timeframe, with the $IWM joining the $SPY and $QQQ in that view. On the shorter timeframe both the QQQ and SPY were slowing down and watching the short term money flow into the IWM.
The week played out with Gold continuing to make new all-time highs but moving more slowly while Crude Oil held at the bottom of the tightening range and bounced. The US Dollar found support at a retest of the year end low and bounced while Treasuries continued building a bull flag under resistance. The Shanghai Composite continued the downtrend to a nearly 7 month low while Emerging Markets consolidated in a tight range.
The Volatility Index continued to stabilize at low levels. This relieves pressure on equities, but despite this they held in a narrow range all week in light late summer trading. This resulted in the SPY ending near all-time highs with the QQQ and IWM holding short of their recent highs. What does this mean for the coming week? Let’s look at some charts.
SPY Daily, $SPY

The SPY came into the week holding in consolidation on the daily chart over the August 1 top. This was after a fast move higher, recovering the 3 day nearly 10% drop at the start of the month. It continued to hold there all week, just shy of the all-time high and at the 161.8% extension of the retracement of the 2022 drop. The RSI is back in the bullish zone and flat with the MACD positive and going flat. The Bollinger Bands® are open higher to allow for the consolidation to work higher as if it were a bull flag.
The weekly chart shows price holding after a 3 week recovery to the prior high. The RSI is stalling short of the prior tops and a move into overbought territory while the MACD is positive and trying to cross back up. The Bollinger Bands are open higher on this chart as well. There is resistance at 565.50 then a Measured Move to 580 above. Support lower sits at 561.50 before 556.50 and 549.50 then 545.75 and 542 before 540 and 537. Uptrend.
SPY Weekly, $SPY

Heading into the unofficial end of summer and with August in the books, equity markets showed a preference for some rest after the 3 week move higher. Elsewhere look for Gold to continue its uptrend while Crude Oil consolidates in a tightening range. The US Dollar Index continues to bounce to the upside while US Treasuries consolidate in their downtrend. The Shanghai Composite looks to continue the downtrend while Emerging Markets consolidate over support in a possible start of a new uptrend.
The Volatility Index looks to remain low and stable making the path easier for equity markets to the upside. Their charts look strong, especially on the longer timeframe. On the shorter timeframe the week long consolidation left the SPY with just 2 hours to rocket to just shy of a new all-time high close while the QQQ and the IWM ended near the high of the week. All are prepped to start September stronger. Use this information as you prepare for the coming week and trad’em well.
Join the Premium Users and you can view the Full Version with 20 detailed charts and analysis: Macro Week in Review/Preview August 30, 2024
9 notes
·
View notes
Text
What to expect from the stock market this week

Two weeks ago, the review of the macro market indicators saw heading into July Options Expiration week, equity markets showed early strength give way to rotation from large cap and tech names into small caps late in the week. Elsewhere looked for Gold ($GLD) to continue consolidation in the uptrend or break to new highs while Crude Oil ($USO) consolidated in a tightening range. The US Dollar Index ($DXY) continued to drift to the downside in consolidation while US Treasuries ($TLT) consolidated in their downtrend. The Shanghai Composite ($ASHR) looked to continue the move lower in consolidation while Emerging Markets ($EEM) had broken consolidation to begin an uptrend.
The Volatility Index ($VXX) looked to remain very low and stable making the path easier for equity markets to the upside. Their charts also looked strong, especially the $SPY on the longer timeframe. On the shorter timeframe both the $QQQ and SPY could use a reset on momentum measures as both were extended. But the story of the week was the $IWM joining the bull party after a 2½ year nap.
The 2 weeks played out with Gold pushing to a new high and then dropping back into consolidation and dropping back while Crude Oil maintained the consolidation range with a move to the downside to end the week. The US Dollar found support and bounced back to resistance while Treasuries consolidated in a tight range. The Shanghai Composite continued lower, ending at near 6 month lows, while Emerging Markets fell back to retest the breakout area and held.
Volatility picked up but ended the week dropping making for yet another lower high. This put pressure on equities and after starting the fortnight with 2 new all-time highs the SPY dropped the rest of the period, along with the QQQ. The IWM however held up in a consolidation range after a strong move higher. What does this mean for the coming week? Let’s look at some charts.
SPY Daily, $SPY

The SPY came into the week below the 20 day SMA for the first time since May 30th. It rose Monday back over it and held Tuesday before a gap down Wednesday and a drop below the 50 day SMA at the lower edge of the Bollinger Bands®. This was the first time below the 50 day SMA since the gap up May 3rd. It printed a reversal candle Thursday and moved higher Friday to close back above that 50 day SMA. The RSI turned higher as it touched the lower edge of the bullish zone with the MACD dropping and approaching zero.
The weekly chart shows a second down week but with a lower shadow appearing. The RSI on this timeframe is dropping out of overbought territory with the MACD crossing down looking for a reset lower. There is support lower at 542 and 540 then 537 and 534 before 530 and 524.50. There is a gap to fill to 553.27 and resistance higher is at 545.75 and 549.50 then 556.50 and 561.50. Pullback in Uptrend.
SPY Weekly, $SPY

With three trading days left in July, large cap and tech focused index equity markets showed weakness with small caps continuing to hold strong. Elsewhere look for Gold to continue its consolidation in the uptrend while Crude Oil consolidates in a tightening range. The US Dollar Index continues to drift in broad consolidation while US Treasuries consolidate in their downtrend. The Shanghai Composite looks to continue the short term move lower while Emerging Markets continue to hold their newfound short term uptrend.
The Volatility Index looks to remain low making the path easier for equity markets to the upside. This is with the backdrop of the July FOMC meeting and non-farm payroll reports next week among many large cap tech earnings reports. The charts of the SPY and QQQ look setup for more downside on the shorter timeframe and possibly the longer timeframe as well, but with no real damage in the weekly chart at this point. The prevailing narrative has been the rotation into small cap IWM and it is showing relative strength, but more in a consolidative mode then a full thrust forward this past week. A new high Monday could change that perspective fast. Use this information as you prepare for the coming week and trad’em well.
Join the Premium Users and you can view the Full Version with 20 detailed charts and analysis: Macro Week in Review/Preview July 26, 2024
11 notes
·
View notes
Text
What to expect from the stock market this week

Last week, the review of the macro market indicators saw with the June quadruple witching in the books in the books, equity markets looked a bit gassed after a good start. Elsewhere looked for Gold ($GLD) to continue its consolidation in the uptrend while Crude Oil ($USO) moved higher in consolidation. The US Dollar Index ($DXY) continued the short term move to the upside while US Treasuries ($TLT) continued their short term move higher in the secular downtrend. The Shanghai Composite ($ASHR) looked to continue the short term trend lower while Emerging Markets ($EEM) looked to be on the verge of breaking consolidation to the upside.
The Volatility Index ($VXX) looked to remain very low making the path easier for equity markets to the upside. The charts of the $SPY and $QQQ looked strong, especially on the longer timeframe, but with possible reversal or digestion candles ahead. On the shorter timeframe both the QQQ and SPY could use a reset on momentum measures as both were extended and pullbacks were helping there. The $IWM continued to go nowhere moving mainly sideways in the upper part of the 2½ year consolidation.
The week played out with Gold remaining in consolidation, holding in a narrow range over support while Crude Oil consolidated last week’s move higher. The US Dollar continued higher and is approaching the May high while Treasuries saw some midweek weakness and dropped back. The Shanghai Composite found some support as it hit a 4 month low while Emerging Markets have so far failed to produce that upside breakout.
Volatility continued to the 2024 lows after an early week spike. This put initial pressure on equities and they responded with a 2 day move lower to start the week. All found support by Wednesday and reversed with the SPY and QQQ climbing back to retest all-time highs while the IWM moved higher in the long consolidation range. Profit taking then saw the Friday gains evaporate. What does this mean for the coming week? Let’s look at some charts.
SPY Daily, $SPY

The SPY came into the week in a two day pullback from the all-time high on the daily chart. It dropped again Monday and then found support moving higher the next 3 days. Friday it opened higher, retesting the all-time high, after a calm Core PCE report on inflation but then fell back all day before a last 20 minute rally that left it nearly flat on the week. The RSI is stalled in the bullish zone but potentially at a lower high, with the MACD crossed down and falling but with lots of room before a turn to bearish.
The weekly chart printed the second highest weekly close on record. This came with the second candle with an upper shadow though. The Bollinger Bands® remain pointing higher with the RSI level in overbought territory and the MACD positive and rising. It looks more bullish on the longer timeframe than the shorter one. There is resistance at 545.75 and 549.50 then the target from the Cup and handle to 560 near the 161.8% extension of the retracement of the 2022 move lower at 562.19. Support lower sits at 542 and 540 then 537 and 533 before 530 and 524.50. Uptrend.
SPY Weekly, $SPY

With the 2nd Quarter of 2024 in the books and heading into the holiday shortened week, equity markets showed resilience with a rebound from a pullback and large caps and tech names holding at the highs. Elsewhere look for Gold to continue its consolidation after the record move higher while Crude Oil consolidates in a broad range. The US Dollar Index continues the short term move to the upside while US Treasuries continue in their secular downtrend. The Shanghai Composite looks to continue the downtrend while Emerging Markets consolidate under long term resistance.
The Volatility Index looks to remain very low and stable making the path easier for equity markets to the upside. Their charts look strong, especially on the longer timeframe. On the shorter timeframe both the QQQ and SPY are showing signs of a possible reset on momentum measures as both are extended. The IWM continues to lag in a long term channel. Use this information as you prepare for the coming week and trad’em well.
Join the Premium Users and you can view the Full Version with 20 detailed charts and analysis: Macro Week in Review/Preview June 28, 2024
Start of Summer Annual Sale! Hi all the Start of Summer Annual Sale is entering its last weekend at Dragonfly Capital. Get an annual subscription for 38.2% off or pay quarterly for 15% off. Both auto-renew at that discounted rate until you decide to leave.
10 notes
·
View notes
Text
What to expect from the stock market this week

Last week, the review of the macro market indicators saw with the 2nd Quarter of 2024 in the books and heading into the holiday shortened week, equity markets showed resilience with a rebound from a pullback and large caps and tech names holding at the highs. Elsewhere looked for Gold ($GLD) to continue in consolidation after the record move higher while Crude Oil ($USO) consolidated in a broad range. The US Dollar Index ($DXY) continued the short term move to the upside while US Treasuries ($TLT) continued in their secular downtrend. The Shanghai Composite ($ASHR) looked to continue the downtrend while Emerging Markets ($EEM) consolidated under long term resistance.
The Volatility Index ($VXX) looked to remain very low and stable making the path easier for equity markets to the upside. Their charts looked strong, especially on the longer timeframe. On the shorter timeframe both the $QQQ and $SPY were showing signs of a possible reset on momentum measures as both were extended. The $IWM continued to lag in a long term channel.
The week played out with Gold pushing up out of the descending triangle while Crude Oil moved up out of consolidation. The US Dollar met resistance and pulled back while Treasuries found short term trend support and bounced. The Shanghai Composite had a weak bounce and fell back while Emerging Markets moved up towards the May high.
Volatility held near the lows of the year. This created a positive environment for equities and by Tuesday they started rising. This resulted in the SPY and QQQ printing 3 more all-time high closes to end the week. The IWM continued to move to its own drumbeat though and fell back Friday, all within the long consolidation range. What does this mean for the coming week? Let’s look at some charts.
SPY Daily, $SPY
The SPY came into the week in a digestive consolidation after making the top in mid-June. It continued Monday getting tighter to the 20 day SMA on the daily chart. Tuesday it moved higher, printing a new all-time high, and followed that up with new highs Wednesday and Friday. The Bollinger Bands® are opening higher now with the RSI strong and bullish and the MACD crossing back higher and positive.
The weekly chart shows the break higher from the short consolidation. The RSI is strong and bullish with the MACD positive and rising. The target from the Cup and Handle at 560 is above with the 161.8% extension of the retracement of the 2022 drop at 562 and the 200% extension at 613 above that. Support lower sits at 549.50 and 545.75 then 542 and 537 before 533 and 530. Uptrend.
SPY Weekly, $SPY

With the first week of July in the books, equity markets showed strength from the large cap and tech focused S&P 500 and Nasdaq 100, but continued churn from the small caps. Elsewhere look for Gold to continue its consolidation in the uptrend while Crude Oil consolidates in a tightening range. The US Dollar Index continues to drift to the downside in consolidation while US Treasuries move lower in their downtrend. The Shanghai Composite looks to continue the short term move lower while Emerging Markets remain in broad consolidation.
The Volatility Index looks to remain very low and stable making the path easier for equity markets to the upside. The charts of the SPY and QQQ look strong, especially on the longer timeframe. On the shorter timeframe both the QQQ and SPY have reset momentum measures and both are also looking strong upon reversing. The IWM continues to be dead money, going on 30 months now. Use this information as you prepare for the coming week and trad’em well.
Join the Premium Users and you can view the Full Version with 20 detailed charts and analysis: Macro Week in Review/Preview July 5, 2024
If you like what you see sign up for more ideas and deeper analysis using the Get Premium button above.
8 notes
·
View notes
Text
What to expect from the stock market this week

Last week, the review of the macro market indicators saw with the June FOMC meeting and inflation data in the books, equity markets showed both strength and weakness with large caps and tech names continuing to make new all-time highs while small caps took a beating. Elsewhere looked for Gold ($GLD) to continue consolidation while Crude Oil ($USO) consolidated in a broad range. The US Dollar Index ($DXY) looked ready to test the top of the consolidation range while US Treasuries ($TLT) basked in a short term uptrend in the secular downtrend. The Shanghai Composite ($ASHR) looked to continue the short term move lower while Emerging Markets ($EEM) consolidated in the long channel.
The Volatility Index ($VXX) looked to remain very low and stable making the path easier for equity markets to the upside. The charts of the $SPY and $QQQ looked strong, especially on the longer timeframe. On the shorter timeframe both the QQQ and SPY negated prior possible momentum divergences. The $IWM continued to languish and showed possible renewed weakness moving lower on the week.
The week played out with Gold continuing to hold over support while Crude Oil moved up toward the top of the broad range. The US Dollar continued higher toward the April high consolidation zone while Treasuries continued higher toward a short term higher high. The Shanghai Composite continued lower cracking support at 3000 while Emerging Markets tried to break the short term consolidation to the upside in the long channel but failed to hold up.
Volatility continued to hold at very low levels but with a slight upward drift at the end of the week. This put pressure on equities after starting the week with new all-time highs and they ended the week with a 2 day move lower. This resulted in the SPY and QQQ working out of short term overbought signals. The IWM continued to do its own thing holding in the middle of the 2024 range. What does this mean for the coming week? Let’s look at some
SPY Daily, $SPY

The SPY came into the week after printing 5 consecutive new all-time highs the previous week. It was also holding a gap up on the daily chart. It made 2 more all-time highs to start the week before heading into the Wednesday holiday. Thursday saw a bearish engulfing candle though and it continued lower Friday, but with a doji, indecision. The 2 day pullback took the RSI out of overbought territory and turned the MACD lower in positive territory. The Bollinger Bands® are still pointing higher but have widened out suggesting a consolidation or pullback.
The weekly chart shows a positive candle but with a long upper shadow, possibly building an Evening Star reversal. But the Bollinger Bands are pointing higher on this timeframe with the RSI poking into overbought territory while the MACD is crossing up and positive. There is resistance higher at 549.50 and then the target of the Cup and Handle at 560 and the 161.8% extension of the retracement of the 2022 pullback at 562.20 above that. Support lower is at 543 and 540 then 537 and 533 before 530 and 524.50. Uptrend.
SPY Weekly, $SPY

With the June quadruple witching in the books in the books, equity markets looked a bit gassed after a good start. Elsewhere look for Gold to continue its consolidation in the uptrend while Crude Oil moves higher in consolidation. The US Dollar Index continues the short term move to the upside while US Treasuries continue their short term move higher in the secular downtrend. The Shanghai Composite looks to continue the short term trend lower while Emerging Markets look to be on the verge of breaking consolidation to the upside.
The Volatility Index looks to remain very low making the path easier for equity markets to the upside. The charts of the SPY and QQQ look strong, especially on the longer timeframe, but with possible reversal or digestion candles this week. On the shorter timeframe both the QQQ and SPY could us a reset on momentum measures as both are extended and pullbacks are helping there. The IWM continued to go nowhere moving mainly sideways in the upper part of the 2½ year consolidation. Use this information as you prepare for the coming week and trad’em well.
Join the Premium Users and you can view the Full Version with 20 detailed charts and analysis: Macro Week in Review/Preview June 21, 2024
Start of Summer Annual Sale! Hi all the Start of Summer Annual Sale is entering its last week at Dragonfly Capital. Get an annual subscription for 38.2% off or pay quarterly for 15% off. Both auto-renew at that discounted rate until you decide to leave.
8 notes
·
View notes
Text
What to expect from the stock market this week

Last week, the review of the macro market indicators saw heading into the May options expiration, equity markets showed renewed strength with a rebound from the pullback. Elsewhere looked for Gold ($GLD) to continue to pause in its uptrend while Crude Oil ($USO) consolidated in the pullback. The US Dollar Index ($DXY) continued to pullback in the 6 month uptrend while US Treasuries ($TLT) continued their downtrend. The Shanghai Composite ($ASHR) looked to continue the short term move higher while Emerging Markets ($EEM) flirted with a break out of a long channel to the upside.
The Volatility Index ($VXX) looked to remain very low and stable making the path easier for equity markets to the upside. The charts of the $SPY and $QQQ looked strong, especially on the longer timeframe. On the shorter timeframe both the QQQ and SPY continued to move up toward new highs as well. The $IWM looked good on the shorter timeframe but the longer timeframe continued to need more time.
The week played out with Gold pushing out of consolidation to new highs while Crude Oil continued to consolidate at support. The US Dollar continued to pull back while Treasuries moved up to to prior resistance in their downtrend. The Shanghai Composite moved to the top of the recent consolidation range while Emerging Markets rose to 2½ year highs.
Volatility dropped to 5 month lows, putting a tailwind behind equities and they responded by printing new all-time highs on the broad indexes. The SPY and QQQ made new all-time highs Thursday and held just below them Friday with the IWM back testing the high from the end of March. What does this mean for the coming week? Let’s look at some charts.
SPY Daily, $SPY

The SPY came into the week tiptoeing toward a retest of the all-time high. It held in place Monday before a small move higher Tuesday narrowly set a new high. It followed up with a break higher Wednesday to another new high and then held the move Thursday and Friday. The daily chart shows the Bollinger Bands® have opened higher with the RSI deep in the bullish zone and the MACD rising and positive.
The weekly chart shows a 4th week moving higher off the 20 week SMA with the Bollinger Bands open higher as well. The RSI is strong in the bullish zone with the MACD curling to cross up after resetting lower. There is resistance at 530 and a target for the Cup and Handle break to 560 above that. A Measured Move gives a target to 610 above that. There is support at 524.50 and 520.50 then 517.50 and 513.50 before 510 and 503.50. Uptrend.
SPY Weekly, $SPY

With the May options expiry in the books, equity markets showed renewed strength moving to new all-time highs. Elsewhere look for Gold to continue its uptrend while Crude Oil consolidates in a pullback. The US Dollar Index continues to pullback in its short term uptrend while US Treasuries bounce in their downtrend. The Shanghai Composite looks to continue the short term move higher while Emerging Markets build a short term uptrend.
The Volatility Index looks to remain very low and stable making the path easier for equity markets to the upside. Their charts look strong, especially on the longer timeframe. On the shorter timeframe both the QQQ and SPY are now consolidating moves to new all-time highs with the IWM closing in on 2½ year highs. Use this information as you prepare for the coming week and trad’em well.
Join the Premium Users and you can view the Full Version with 20 detailed charts and analysis: Macro Week in Review/Preview May 17, 2024
12 notes
·
View notes
Text
What to expect from the stock market this week

Last week, the review of the macro market indicators saw with the month of May in the books, equity markets showed some signs of weakness following divergences last week. Elsewhere looked for Gold ($GLD) to continue its consolidation in the uptrend while Crude Oil ($USO) consolidated in a narrow range after a pullback. The US Dollar Index ($DXY) continued to drift to in broad consolidation while US Treasuries ($TLT) continued their downtrend. The short term move higher in the Shanghai Composite ($ASHR) looked to be at risk of reversing while Emerging Markets ($EEM) entered a short term downtrend.
The Volatility Index ($VXX) looked to remain very low and stable making the path easier for equity markets to the upside. The charts of the $SPY and $QQQ looked strong on the longer timeframe, but with a possible momentum reset continuing in the short run. On the shorter timeframe, both the QQQ and SPY had reset to their 20 day SMA’s where they often find support. How they react during the week could tell if last week was meaningful or not. The $IWM continued to be the laggard, stalled near the top of a 2 year range.
The week played out with Gold pushing out of consolidation to the upside before dropping back Friday while Crude Oil dropped out of consolidation early but found support and recovered much of the drop. The US Dollar also dropped early before it found support and rebounded to end higher on the week while Treasuries broke trend resistance to the upside and then fell back to retest it as support. The Shanghai Composite continued to move lower while Emerging Markets held in short term consolidation at last week’s gap move lower.
Volatility inched lower relieving pressure on equities and the large cap and tech names. They responded mid-week with a 2 day move higher to new all-time highs on the S&P 500 and Nasdaq 100. All paused Thursday ahead of the payroll report Friday. Then the SPY and QQQ held just under the new highs while the IWM remained in a narrow range. What does this mean for the coming week? Let’s look at some charts.
SPY Daily, $SPY

The SPY came into the week holding over the rising 20 day SMA on the daily chart after a shallow pullback from an all-time high. It continued to ride the 20 day SMA on Monday and Tuesday and then broke higher Wednesday, ending at a new all-time high. It held there Thursday and probed to the upside Friday before pulling back to finish unchanged on the day. The RSI on the daily chart shows a push back higher leveling which could lead to a momentum divergence should it not continue up next week. The MACD crossed up Friday and is positive though with the Bollinger Bands® squeezing but shifting to point higher.
The weekly chart shows the break of the small consolidation to the upside. The RSI is on the edge of overbought, very strong, suggesting any weakness on the daily chart may be short lived or corrected through time, not price. The MACD is also high and positive and moving sideways. There is resistance at 535 and the target from the Cup and Handle above at 560. Support is now at 530 and 524.50 then 520.50 and 517.50 before 513.50 and 510. Uptrend.
SPY Weekly, $SPY

With the first week of June in the books, equity markets were mixed with the large caps and tech heavy Nasdaq showing renewed strength while small caps continue to flounder. Elsewhere look for Gold to continue to consolidate the long move higher while Crude Oil moves lower in a consolidation range. The US Dollar Index continues in broad consolidation while US Treasuries continue their long term downtrend. The Shanghai Composite looks to continue the short term move lower while Emerging Markets continue the short term move lower in a consolidation channel.
The Volatility Index looks to remain very low and stable making the path easier for equity markets to the upside. The charts of the SPY and QQQ look strong, especially on the longer timeframe. On the shorter timeframe both the QQQ and SPY continue to step higher and look strong as well with an eye on potential momentum divergences. The IWM continues to be dead money, as it has been for the past 2½ years. Use this information as you prepare for the coming week and trad’em well.
Join the Premium Users and you can view the Full Version with 20 detailed charts and analysis: Macro Week in Review/Preview June 7, 2024
Start of Summer Annual Sale! Hi all the Start of Summer Annual Sale is on at Dragonfly Capital. Get an annual subscription for 38.2% off or pay quarterly for 15% off. Both auto-renew at that discounted rate until you decide to leave.
7 notes
·
View notes
Text
What to expect from the stock market this week

Last week, the review of the macro market indicators saw with three trading days left in July, large cap and tech focused index equity markets showed weakness with small caps continuing to hold strong. Elsewhere looked for Gold ($GLD) to continue its consolidation in the uptrend while Crude Oil ($USO) consolidated in a tightening range. The US Dollar Index ($DXY) continued to drift in broad consolidation while US Treasuries ($TLT) consolidated in their downtrend. The Shanghai Composite ($ASHR) looked to continue the short term move lower while Emerging Markets ($EEM) continued to hold their newfound short term uptrend.
The Volatility Index ($VXX) looked to remain low making the path easier for equity markets to the upside. This was with the backdrop of the July FOMC meeting and non-farm payroll reports in the next week among many large cap tech earnings reports. The charts of the $SPY and $QQQ looked setup for more downside on the shorter timeframe and possibly the longer timeframe as well, but with no real damage in the weekly charts yet. The prevailing narrative had been the rotation into small cap $IWM and it was showing relative strength, but more in a consolidative mode then a full thrust forward. A new high Monday could change that perspective fast.
The week played out with a lot of fireworks, but the day after the FOMC meeting. Gold pushed to new all-time highs before profit taking while Crude Oil dropped out of the consolidation to the downside. The US Dollar dropped to a 4½ month low while Treasuries jumped to 6 month highs to end the week. The Shanghai Composite continued the series of lower highs and lower lows while Emerging Markets fell back to a 3 month low.
Volatility rose up to the highest level in nearly 18 months. This put pressure on equities late and they ended the week with a large 2 day move lower. This resulted in the SPY seeing its first 2% down day and ending at 3 month lows while the QQQ ended at 3½ month lows and the IWM gave up its break out, dropping into the prior consolidation zone. What does this mean for the coming week? Let’s look at some charts.
SPY Daily, $SPY

The SPY came into the week consolidating after a pullback to the 50 day SMA on the daily chart. It held there through Tuesday and then jumped Wednesday but could not clear the 20 day SMA. It fell back Thursday and then gapped down Friday, finding support at the 138.2% extension of the retracement of the 2022 downward move. The RSI is dipping into the bearish zone with the MACD negative and falling. The Bollinger Bands® are opening lower on this chart.
The weekly chart shows a 3rd weekly candle to the downside reaching to the 20 week SMA. This is where it found support with a similar 3 week move lower in April. The RSI is pulling back towards the midline in the bullish zone with the MACD crossed down and positive. There is support lower at 530 and 524.50 then 520.50 and 517.50 before 513.50 and 510. Resistance higher is at 534 before 537 and 540 then 542 and 545.75. Pullback in Uptrend.
SPY Weekly, $SPY

With the July FOMC meeting in the books, equity markets showed concern with a very weak end to the week with weak employment data. Elsewhere look for Gold to continue its assault on new highs while Crude Oil breaks consolidation lower. The US Dollar Index continues to short term move to the downside while US Treasuries possibly reverse to an uptrend. The Shanghai Composite looks to continue the short term move lower while the short term breakout higher in Emerging Markets is at risk of failing.
The Volatility Index looks to remain elevated and rising making the path easier for equity markets to the downside. The charts of the SPY and QQQ continue to look productive on the longer timeframe but with continued weakness on the shorter timeframe. The IWM looks to have given traders yet another disappointment with yet another failed breakout higher. Use this information as you prepare for the coming week and trad’em well.
Join the Premium Users and you can view the Full Version with 20 detailed charts and analysis: Macro Week in Review/Preview August 2, 2024
6 notes
·
View notes
Text
What to expect from the stock market this week

Last week, the review of the macro market indicators saw with the first week of July in the books, equity markets showed strength from the large cap and tech focused S&P 500 and Nasdaq 100, but continued churn from the small caps. Elsewhere looked for Gold ($GLD) to continue its consolidation in the uptrend while Crude Oil ($USO) consolidated in a tightening range. The US Dollar Index ($DXY) continued to drift to the downside in consolidation while US Treasuries ($TLT) moved lower in their downtrend.
The Shanghai Composite ($ASHR) looked to continue the short term move lower while Emerging Markets ($EEM) remained in broad consolidation. The Volatility Index ($VXX) looked to remain very low and stable making the path easier for equity markets to the upside. The charts of the $SPY and $QQQ looked strong, especially on the longer timeframe. On the shorter timeframe both the QQQ and SPY reset momentum measures and both were also looking strong upon reversing. The $IWM continued to be dead money, now for 30 months.
The week played out with Gold breaking consolidation to the upside with a new all-time high while Crude Oil continued to hold in a tight range. The US Dollar continued lower to 3 month lows while Treasuries bounced in the downtrend. The Shanghai Composite held at rising trend support and moved higher while Emerging Markets rose to a nearly 2½ year high.
Volatility continued to hold shy of the teens ending the week near the lows of the year. This made for a supportive backdrop for equities and the large cap S&P 500 and Nasdaq 100 started the week with 3 back to back new all-time highs. They pulled back Thursday and then reversed to finish the week Friday. The big news was the small cap Russell 2000 finally waking up and pressing to 2½ year highs. What does this mean for the coming week? Let’s look at some charts.
SPY Daily, $SPY

The SPY came into the week after 3 straight all-time highs to end the prior week. It continued with 3 more to start the week, ending Wednesday at the 161.8% extension of the drawdown of 2022 and the Cup and Handle on the weekly chart. This brought price above the Bollinger Bands®. It pulled back Thursday, moving inside the BB’s, and then reversed Friday to close the week with an inside candle on the daily chart. The RSI is rising on the edge of overbought with the MACD positive and moving higher.
The weekly chart shows a second strong week moving higher with the price outside of the Bollinger Bands. The RSI is strong and overbought with the MACD rising and bullish. There is resistance at 561.50 and now a Measured Move to 610 and the 200% extension of the retracement of the 2022 drop at 613 above. Support lower is at 556.50 and 549.50 then 545.75 and 542 before 540 and 537. Uptrend.
SPY Weekly, $SPY

Heading into July Options Expiration week, equity markets showed early strength give way to rotation from large cap and tech names into small caps late in the week. Elsewhere look for Gold to continue consolidation in the uptrend or break to new highs while Crude Oil consolidates in a tightening range. The US Dollar Index continues to drift to the downside in consolidation while US Treasuries consolidate in their downtrend. The Shanghai Composite looks to continue the move lower in consolidation while Emerging Markets have broken consolidation to begin an uptrend.
The Volatility Index looks to remain very low and stable making the path easier for equity markets to the upside. Their charts also look strong, especially the SPY on the longer timeframe. On the shorter timeframe both the QQQ and SPY could us a reset on momentum measures as both are extended. But the story of the week is the IWM joining the party after a 2½ year nap. Use this information as you prepare for the coming week and trad’em well.
Join the Premium Users and you can view the Full Version with 20 detailed charts and analysis: Macro Week in Review/Preview July 12, 2024
5 notes
·
View notes
Text
What to expect from the stock market this week

Last week, the review of the macro market indicators saw with the first week of June in the books, equity markets were mixed with the large caps and tech heavy Nasdaq showing renewed strength while small caps continued to flounder. Elsewhere looked for Gold ($GLD) to continue to consolidate the long move higher while Crude Oil ($USO) moved lower in a consolidation range. The US Dollar Index ($DXY) continued in broad consolidation while US Treasuries ($TLT) continued their long term downtrend. The Shanghai Composite ($ASHR) looked to continue the short term move lower while Emerging Markets ($EEM) continued the short term move lower in a consolidation channel.
The Volatility Index ($VXX) looked to remain very low and stable making the path easier for equity markets to the upside. The charts of the $SPY and $QQQ looked strong, especially on the longer timeframe. On the shorter timeframe both the QQQ and SPY continued to step higher and looked strong as well with an eye on potential momentum divergences. The $IWM continued to be dead money, as it had been for the past 2½ years.
The week played out with Gold consolidating over support at 2300/oz while Crude Oil jumped Monday and then held under resistance the rest of the week. The US Dollar moved higher in the broad consolidation range while Treasuries have reversed the 2024 downtrend, but still far from a long term higher high. The Shanghai Composite found support and held in a tight range while Emerging Markets remained in their recent narrow range.
Volatility continued to hold under the teens, nearly unchanged. This put a tail wind to the backs of the large cap and tech focused equity indexes and the SPY and QQQ responded with 5 consecutive new all-time highs on the week. The IWM continued to act like the aloof child doing its own thing all week with a strong Wednesday followed by a fast sell off to end the week lower. What does this mean for the coming week? Let’s look at some charts.
SPY Daily, $SPY

The SPY came into the week holding near the all-time high from Wednesday the prior week. It started higher Monday and continued Tuesday, then gapped up Wednesday out of the Bollinger Bands®. It added again Thursday and moved back toward the BB’s and held the gap Friday adding a 5th new all-time high. The daily chart shows the RSI climbing into overbought territory, ending the momentum divergence with a higher high. The MACD is rising and positive.
The weekly chart shows a strong candle higher closing near the high of the week. The RSI is rising into overbought as well and on the verge of negating the possible momentum divergence on this timeframe. The MACD is crossing up and positive. There is no resistance higher and a target on the Cup and Handle at 560. Support lower is now at 535 and 530 then 524.50 and 520.50 before 517.50 and 513.50. Uptrend.
SPY Weekly, $SPY

With the June FOMC meeting and inflation data in the books, equity markets showed both strength and weakness with large caps and tech names continuing to make new all-time highs while small caps took a beating. Elsewhere look for Gold to continue consolidation while Crude Oil consolidates in a broad range. The US Dollar Index looks ready to test the top of the consolidation range while US Treasuries bask in a short term uptrend in the secular downtrend. The Shanghai Composite looks to continue the short term move lower while Emerging Markets consolidate in the long channel.
The Volatility Index looks to remain very low and stable making the path easier for equity markets to the upside. The charts of the SPY and QQQ look strong, especially on the longer timeframe. On the shorter timeframe both the QQQ and SPY have negated prior possible momentum divergences. The IWM continues to languish and showed possible renewed weakness moving lower on the week. Use this information as you prepare for the coming week and trad’em well.
Join the Premium Users and you can view the Full Version with 20 detailed charts and analysis: Macro Week in Review/Preview June 14, 2024
Start of Summer Annual Sale! Hi all the Start of Summer Annual Sale is on at Dragonfly Capital. Get an annual subscription for 38.2% off or pay quarterly for 15% off. Both auto-renew at that discounted rate until you decide to leave.
6 notes
·
View notes
Text
What to expect from the stock market this week
Last week, the review of the macro market indicators saw with the first week of April in the books, equity markets looked in need of a rest. Elsewhere looked for Gold ($GLD) to continue its record run higher while Crude Oil ($USO) continued its move to the upside as well. The US Dollar Index ($DXY) continued to short term trend to the upside while US Treasuries ($TLT) might resume their downtrend. The Shanghai Composite ($ASHR) looked to continue the short term move higher while Emerging Markets ($EEM) consolidated under long term resistance.
The Volatility Index ($VXX) looked to remain low making the path easier for equity markets to the upside. Their charts also looked strong, especially on the longer timeframe. On the shorter timeframe the $QQQ was at risk for some downside with the $IWM in a messy short term uptrend and the $SPY the strongest but also seeing some profit taking show up.
The week played out with Gold continuing it run of record highs while Crude Oil met resistance and consolidated at 5½ month highs. The US Dollar found strength and pushed to 5½ month highs as well while Treasuries made new 4 month lows before a bounce Friday. The Shanghai Composite pulled back from a lower high while Emerging Markets broke down out of the rising short term channel.
Volatility rose up from a short term consolidation to the top of a rising wedge. This put pressure on equities late in the week and they responded by moving lower. This resulted in the IWM back at support which was prior resistance for 2 years, the QQQ continuing sideways in consolidation near the highs and the SPY touching a 1 month low. What does this mean for the coming week? Let’s look at some charts.
SPY Daily, $SPY
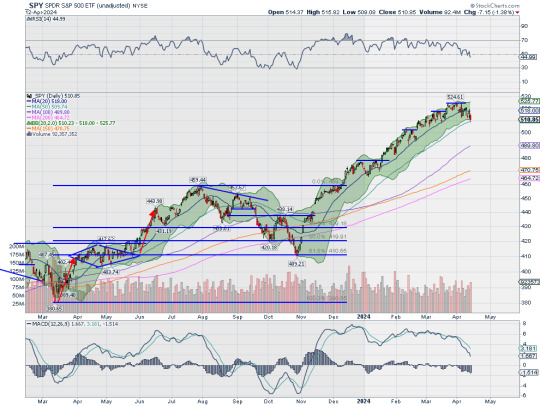
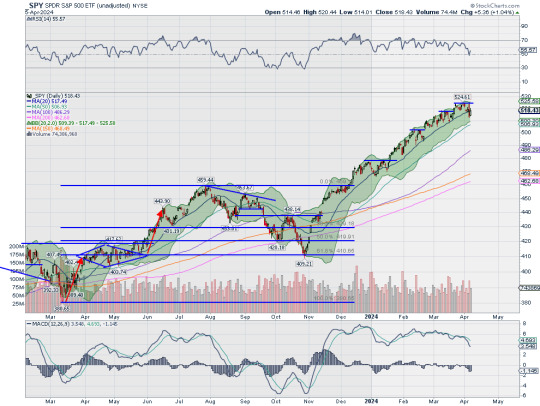
The SPY came into the week holding at the 20 day SMA on the daily chart after a pullback from the top. It held there Monday and Tuesday and then dropped below Wednesday in a reaction to the hotter than expected CPI print. Thursday saw it rise to retest the 20 day SMA and then fall back Friday to touch the 50 day SMA for the first time since the beginning of November. Price ended at the lower of the Bollinger Bands® with the RSI heading toward the bottom of the bullish zone and the MACD positive but dropping and approaching zero.
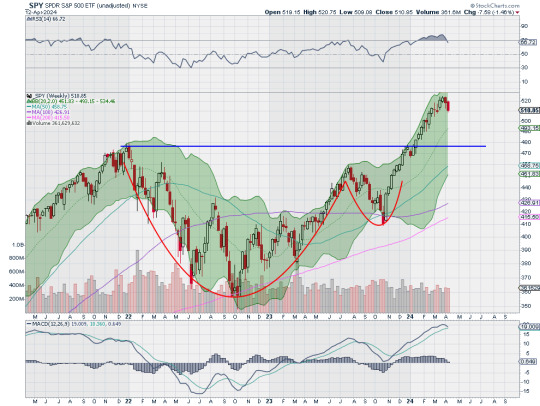
The weekly chart shows a second week headed lower, this one with a longer red candle. The RSI on this timeframe has dropped out of overbought territory with the MACD about to cross down. There is support lower at 510 and 503.50 then 501.50 and 498.50 before 495 and 491.50 with the retest of the Cup and Handle breakout at 476.75 lower. Resistance above is at 513.50 and 517.50 then 520.50 and 524.50. The 138.2% extension of the retracement of the 2022 pullback is above at 530 and then the Cup and Handle target at 560. Pullback in Uptrend.
SPY Weekly, $SPY
Heading into the April options expiration, equity markets showed some cracks in the uptrends. Elsewhere look for Gold to continue its uptrend, but with perhaps a short term pause while Crude Oil consolidates the move higher. The US Dollar Index looks to break to the upside while US Treasuries resume their downtrend. The Shanghai Composite looks to consolidate in its move higher while Emerging Markets consolidate in a broad channel.
The Volatility Index looks to continue to slow move higher keeping pressure on equity markets. The QQQ looks the strongest, especially on the longer timeframe as it consolidates while the SPY digests its strong move with a pullback. The IWM seems to have given up any chance of breaking out of the long consolidation as it falls back into the channel. Use this information as you prepare for the coming week and trad’em well.
Join the Premium Users and you can view the Full Version with 20 detailed charts and analysis: Macro Week in Review/Preview April 12, 2024
5 notes
·
View notes
Text
What to expect from the stock market this week

Last week, the review of the macro market indicators saw with the First Quarter of the year in the books, equity markets exhibited strength. Elsewhere looked for Gold ($GLD) to continue its uptrend while Crude Oil ($USO) built on its move higher. The US Dollar Index ($DXY) continued to drift to the upside in consolidation while US Treasuries ($TLT) consolidated in their downtrend. The Shanghai Composite ($ASHR) looked to reverse the short term uptrend while Emerging Markets ($EEM) consolidated in a broad range.
The Volatility Index ($VXX) looked to remain very low and stable making the path easier for equity markets to the upside. Their charts looked strong, especially the $SPY on both timeframes. The $QQQ was showing some momentum divergence that could lead to more consolidation or a pullback while the $IWM looked to step up as it broke to 2 year highs.
The week played out with Gold continuing to the upside, printing 4 new all-time highs and ending the week at one while Crude Oil also continued higher making 5 month highs. The US Dollar met resistance and then held in a tight range while Treasuries continued to flirt with a new move lower. The Shanghai Composite jumped to resistance and held there through Wednesday before closing for the week while Emerging Markets are threatening to break the rising channel to the downside.
Volatility rose to 5 month highs and held there Friday. This put pressure on equities mid week and they responded with a move lower. The SPY joined the QQQ pulling back from recent tops with the IWM looking like a possible failed break out. What does this mean for the coming week? Let’s look at some charts.
SPY Daily, $SPY
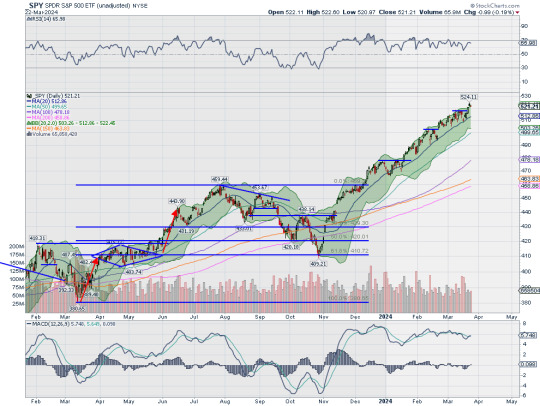
The SPY came into the week just pennies off the all-time high it set the day before. It held there Monday but then gapped down Tuesday to the 20 day SMA. It held there Wednesday and then opened higher in the typical bounce Thursday back at the all-time high. But that did not hold up as 4 Fed Presidents delivered the message that rate hikes will be delayed. It fell back and printed a bearish engulfing Marubozu candle, a potential reversal. Friday, however, did not deliver another move lower, but instead an inside day to the upside had it close back over the 20 day SMA. The RSI is moving back higher after a touch at the midline with the MACD leveling and positive.
The weekly chart, however, printed a bearish engulfing candle. This comes with the RSI overbought but now pulling back and the MACD starting to roll over after a 6 month move higher. The Bollinger Bands® do continue to point higher though. There is resistance at 520.50 and 524.50 with the 138.2% extension of the retracement of the 2022 pullback at 530 then the Cup and Handle target at 560. Support lower is at 517.50 and 513.50 then 510 and 503.50 before 501.50 and 498.50. Uptrend.
SPY Weekly, $SPY

With the first week of April in the books, equity markets are looking in need of a rest. Elsewhere look for Gold to continue its record run higher while Crude Oil continues its move to the upside as well. The US Dollar Index continues to short term trend to the upside while US Treasuries may resume their downtrend. The Shanghai Composite looks to continue the short term move higher while Emerging Markets consolidate under long term resistance.
The Volatility Index looks to remain low making the path easier for equity markets to the upside. Their charts also look strong, especially on the longer timeframe. On the shorter timeframe the QQQ is at risk for some downside with the IWM in a messy short term uptrend and the SPY the strongest but also seeing some profit taking show up. Use this information as you prepare for the coming week and trad’em well.
Join the Premium Users and you can view the Full Version with 20 detailed charts and analysis: Macro Week in Review/Preview April 5, 2024
2 notes
·
View notes
Text
What to expect from the stock market this week

Last week, the review of the macro market indicators saw with the March FOMC meeting in the books, equity markets showed strength moving higher despite the continued tone of rates staying higher for longer. Elsewhere looked for Gold ($GLD) to continue its consolidation in a bull flag at the highs while Crude Oil ($USO) continued the messy uptrend. The US Dollar Index ($DXY) looked to drift to the upside in consolidation while US Treasuries ($TLT) consolidated in their downtrend. The Shanghai Composite ($ASHR) looked to continue the short term uptrend while Emerging Markets ($EEM) consolidated in a broad range.
The Volatility Index ($VXX) looked to remain very low and stable making the path easier for equity markets to the upside. Their charts looked strong, especially on the longer timeframe with the $SPY at a weekly high and the $IWM and $QQQ consolidating the recent moves higher. On the shorter timeframe both the QQQ and SPY also looked strong making fresh all-time highs Thursday before dropping toward filling gaps Friday on profit taking. The IWM looked to have established a higher range.
The week played out with Gold breaking consolidation and moving to a new all-time high while Crude Oil also rounded up to a new 5 month high. The US Dollar drifted slightly higher while Treasuries moved higher in a tightening consolidation. The Shanghai Composite pulled back, ending the uptrend while Emerging Markets held in a tight range.
Volatility rose early in the week but fell back quickly and ended the week little changes at very low levels. This put initial pressure on equities and they fell to start the week. The damage was short lived and minimal though with the SPY and QQQ building short bull flags and the IWM slightly deeper. The SPY and IWM broke to the upside Thursday making new highs with the QQQ lagging and holding in consolidation. What does this mean for the coming week? Let’s look at some charts.
SPY Daily, $SPY
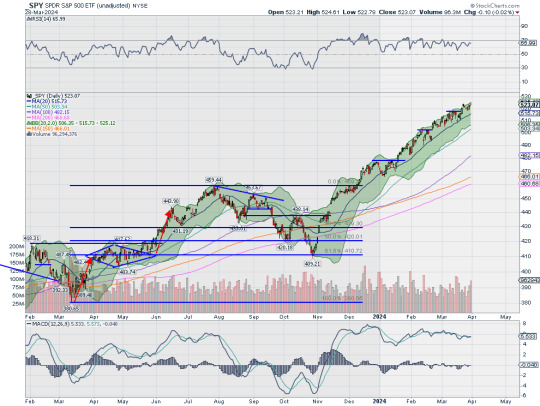
The SPY came into the week after seeing profit taking following a new all-time high on Thursday. It continued lower Monday and Tuesday but then reversed Wednesday to set a new all-time high. Thursday it gave back marginally and closed the week positive. The daily chart shows price has but broken below the 20 day SMA since January 17th in the rising Bollinger Bands®. The RSI is strong in the bullish zone with the MACD flat and positive.
The weekly chart shows a second week high after the brief 2 week consolidation. The Bollinger Bands on this timeframe also continue to point higher. The RSI is strong in overbought territory in the bullish zone with the MACD positive and rising. There is resistance higher at 524.50 and then the 138.2% extension of the retracement of the 2022 pullback at 530 and the target on the Cup and Handle at 560. Support lower sits at 520.50 and 517.50 then 513.50 and 510 before 503.50 and 501.50. Uptrend.
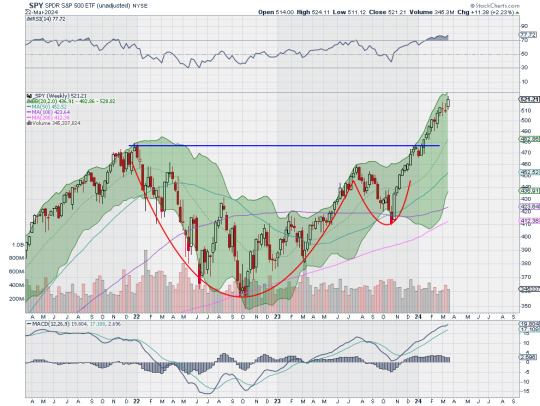
SPY Weekly, $SPY

With the First Quarter of the year in the books, equity markets have exhibited strength. Elsewhere look for Gold to continue its uptrend while Crude Oil builds on its move higher. The US Dollar Index continues to drift to the upside in consolidation while US Treasuries consolidate in their downtrend. The Shanghai Composite looks to reverse the short term uptrend while Emerging Markets consolidate in a broad range.
The Volatility Index looks to remain very low and stable making the path easier for equity markets to the upside. Their charts look strong, especially the SPY on both timeframes. The QQQ is showing some momentum divergence that could lead to more consolidation or a pullback while the IWM looks top step up as it breaks to 2 year highs. Use this information as you prepare for the coming week and trad’em well.
Join the Premium Users and you can view the Full Version with 20 detailed charts and analysis: Macro Week in Review/Preview March 29, 2024
5 notes
·
View notes
Text
What to expect from the stock market this week
Last week, the review of the macro market indicators saw with the March Quadruple Witching in the books and heading into the March FOMC meeting, equity markets showed some weakness after the long run higher. Elsewhere looked for Gold ($GLD) to continue its uptrend while Crude Oil ($USO) showed short term strength. The US Dollar Index ($DXY) continued in consolidation while US Treasuries ($TLT) consolidated in their downtrend. The Shanghai Composite ($ASHR) looked to continue the short term move higher while Emerging Markets ($EEM) consolidated.
The Volatility Index ($VXX) looked to remain very low and stable making the path easier for equity markets to the upside. The $SPY and $QQQ charts looked strong on the longer timeframe, perhaps building bull flags. On the shorter timeframe though both were showing some weakness as they reset momentum measures lower in the bullish range. The short term weakness in the $IWM was threatening to turn into a failed break out.
The week played out with Gold consolidating in a tightening range while Crude Oil met some resistance early in the week and pulled back. The US Dollar pushed up to recent resistance while Treasuries lifted higher in consolidation. The Shanghai Composite held in a narrow range around the 200 day SMA while Emerging Markets continued in consolidation in the rising channel.
Volatility continued to move lower, breaking its rising channel to a 1 month low. This took pressure off equities and they started moving higher Tuesday. By Wednesday the SPY had set anew all-time high, following that with another Thursday. The QQQ was one day beyond making a new high on Thursday and the IWM printing a new 23 month high as well. Friday all saw some profit taking. What does this mean for the coming week? Let’s look at some charts.
SPY Daily, $SPY
The SPY came into the week after pulling back to the 20 day SMA on Friday from a new all-time high 3 days earlier. It gapped up Monday and added to it Tuesday before a strong move Wednesday following the FOMC meeting saw it end at a new all-time high. Thursday printed another high with a gap up outside of the Bollinger Bands®. Friday then saw a tight range give back a small amount of the gains but move back within the Bollinger Bands. The RSI is strong in the bullish zone with the MACD crossing back up as the Bollinger Bands open higher again.
The weekly chart shows a strong move out of the short bull flag to the upside. The Bollinger Bands on this timeframe are pointing higher with the RSI strong, slightly overbought, but running flat and the MACD positive and rising. There is resistance at 524 and then the 138.2% extension of the retracement of the 2022 drop at 530 and the target on the Cup and Handle at 560. Support lower is at 520.50 and 517.50 then 513.50 and 510 before 503.50 and 501.50. Uptrend.
SPY Weekly, $SPY
With the March FOMC meeting in the books, equity markets showed strength moving higher despite the continued tone of rates staying higher for longer. Elsewhere look for Gold to continue its consolidation in a bull flag at the highs while Crude Oil continues the messy uptrend. The US Dollar Index looks to drift to the upside in consolidation while US Treasuries consolidate in their downtrend. The Shanghai Composite looks to continue the short term uptrend while Emerging Markets consolidate in a broad range.
The Volatility Index looks to remain very low and stable making the path easier for equity markets to the upside. Their charts look strong, especially on the longer timeframe with the SPY at a weekly high and the IWM and QQQ consolidating the recent moves higher. On the shorter timeframe both the QQQ and SPY also look strong making fresh all-time highs Thursday before dropping toward filling gaps Friday on profit taking. The IWM looks to have established a higher range. Use this information as you prepare for the coming week and trad’em well.
Join the Premium Users and you can view the Full Version with 20 detailed charts and analysis: Macro Week in Review/Preview March 22, 2024
4 notes
·
View notes
Last Seen Blogs

ky0k0z-dr34mz
ky0k0

if1g4v3up
where is duty, where is sacrifice ?

bhanwarlal02
Untitled

sanahroy
SANAH ROY

sweet2466971
Untitled