#unpivot
Explore tagged Tumblr posts
Visit Tumblr Blog
Explore Tumblr blogs with no restrictions, modern design and the best experience.
Last Seen Tumblr Blogs


Fun Fact
In 2020, Tumblr had 29.4 million users in the US.
Text
Demystifying SQL Pivot and Unpivot: A Comprehensive Guide
CodingSight
Demystifying SQL Pivot and Unpivot: A Comprehensive Guide
In the realm of data management and analysis, SQL Pivot and Unpivot operations shine as invaluable tools that enable the transformation of complex datasets into meaningful insights. This article is a deep dive into the world of SQL Pivot and Unpivot, providing a comprehensive understanding of their functions, applications, and when to employ them.
Defining SQL Pivot
SQL Pivot is a data manipulation technique that revolves around the reorganization of rows into columns, facilitating a shift from a "long" format to a more reader-friendly "wide" format. This operation streamlines data analysis and reporting, making it indispensable in numerous scenarios.
The Mechanism Behind SQL Pivot
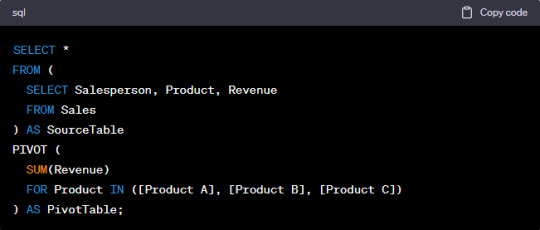
To execute a Pivot operation, you must specify the columns that should become new columns in the output, along with the values that will fill these columns. Typically, an aggregate function is employed to compute values for each new column. Here's a simple example to illustrate this:

In this instance, data is pivoted to display total revenue for each product and salesperson. The SUM function serves to aggregate the revenue values.
When to Employ SQL Pivot
SQL Pivot is the ideal choice when you need to transform data from a long format into a wide format for enhanced reporting or analysis. Common use cases include:
Generating sales and revenue reports, as exemplified above.
Creating cross-tabulated reports for survey data.
Converting timestamped data into time series data for trend analysis.
Understanding SQL Unpivot
Exploring SQL Unpivot
SQL Unpivot operates as the antithesis of Pivot. It reverses the process by transforming wide-format data back into a long format, which is more conducive to specific analytical tasks. Unpivot is used to normalize data for further processing or to simplify the integration of data from diverse sources.
The Mechanics of SQL Unpivot
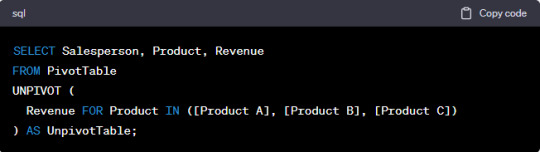
Unpivot works by selecting a set of columns to convert into rows. You must also specify the column that will store values from the chosen columns and the column that will hold the original dataset's column names. Here's an illustrative example:

In this example, the data is unpivoted, returning to its original long format. The "Product" column values become new rows, while the "Revenue" column houses the corresponding values.
When to Utilize SQL Unpivot
SQL Unpivot is indispensable when you need to normalize data or amalgamate information from multiple sources with varying structures. Common use cases include:
Analyzing survey data collected in a cross-tabulated format.
Merging data from different departments or databases characterized by distinct column structures.
Preparing data for machine learning algorithms that require specific input formats.
Conclusion
SQL Pivot and Unpivot operations emerge as indispensable assets in the realm of data manipulation and analysis. Pivot facilitates the transformation of data for improved reporting and analysis, while Unpivot streamlines data normalization and the integration of disparate information sources. Mastery of these techniques empowers data analysts, business intelligence professionals, and data scientists to unlock the full potential of their data, thereby enabling better decision-making and the revelation of hidden insights. Whether you're a seasoned data professional or just embarking on your data journey, SQL Pivot and Unpivot operations are vital tools to have at your disposal, ready to reveal the true potential of your data. Start exploring their capabilities today and embark on a data-driven journey of discovery and transformation.
0 notes
Text
Maaaan.
Maaaaaaaaaaaaaaaaannnnnn.
I am making a thing. I planned said thing before I even started stitching. Then I pivoted because I thought this would look better.
It does not.
I am entering this creation into a competition that is ending in 4 days.
There is no time to unpivot.
...
Maaaaaaaaaaaaaaaaaannnnn. ;-;
#crochet#yarnblr#my crochet#fiber arts#complaining#the thing I fucked up is sleeves#and I need to make them bigger not smaller#so I really don't have time to correct this#I needed to make them rectangles#instead#I made them tapered#q-q
5 notes
·
View notes
Text
Unpivot from video.

In Prince's funky name, amen.
63K notes
·
View notes
Text

🔄 Mastering Dataflows (Gen2): Transform Like a Pro
Q: What are some common data transformations in Dataflows Gen2?
✅ A: Here are some of the most used transformations:
🔹 Filter and Sort rows
🔹 Pivot and Unpivot
🔹 Merge and Append queries
🔹 Split and Conditional Split
🔹 Replace values and Remove duplicates
🔹 Add, Rename, Reorder, or Delete columns
🔹 Rank and Percentage calculators
🔹 Top N and Bottom N selections
🧠 These transformations help clean, shape, and enrich your data—making your downstream reporting more effective and insightful.
💬 Which transformation do you use the most in your projects?
Drop your favorite (or most underrated) one in the comments!
#DataPlatform #LowCodeTools
#MicrosoftFabric#DataflowsGen2#PowerBI#DataTransformation#ETL#DataEngineering#FabricCommunity#DataPreparation#DataCleaning#OneLake
0 notes
Text
Bridging the Gap: Aligning Tableau’s Data Prep with Power BI’s Power Query
As businesses increasingly transition from Tableau to Power BI for analytics and visualization, one key challenge often arises: how to align Tableau’s data preparation workflows with Power BI’s Power Query. While both tools offer robust capabilities for shaping and cleaning data, their architecture, user interface, and underlying logic differ significantly. For organizations migrating reports, dashboards, or entire BI ecosystems, understanding how to bridge this gap is essential for a smooth transition.
Understanding the Two Approaches
Tableau Prep is designed to help users visually prepare data using a flow-based interface. It emphasizes ease of use and visual transformations such as joins, unions, filters, and pivots, making it intuitive for analysts and business users. It supports a wide range of data sources and enables users to track their preparation steps in a linear, graphical layout.
Power BI, on the other hand, uses Power Query—a feature-rich data transformation tool built on the M language. Power Query is integrated across Microsoft’s Power Platform and allows for highly customizable and scalable data shaping using a functional, step-by-step interface. While less visual than Tableau Prep, Power Query offers deeper control and automation through scripting.
Bridging the Workflow Differences
To align these two ecosystems, it's essential to map Tableau Prep’s visual transformations to their Power Query equivalents. Here's how to approach this:
Joins and Unions: Tableau’s join and union steps can be directly mapped to Power Query’s Merge Queries and Append Queries functions. Power Query even allows multiple join types, including inner, left outer, right outer, and full outer, offering similar flexibility to Tableau.
Calculated Fields: Calculated fields in Tableau are usually straightforward to translate. Power Query supports custom columns using its M language, allowing similar expressions to derive new metrics or dimensions.
Filtering and Sorting: Basic filters and sorting rules applied in Tableau Prep can be replicated using Power Query's Filter Rows and Sort steps, although complex logic may require writing conditional statements in M.
Pivot and Unpivot: These operations are well-supported in both tools. Tableau’s pivot/unpivot transforms map neatly to Power Query’s Pivot Column and Unpivot Columns features.
Output and Integration: Power Query seamlessly integrates with Power BI’s data model, enabling streamlined connections to DAX measures and reports—something that needs to be manually configured post-export in Tableau.
A Migration Strategy That Works
At OfficeSolution, we specialize in automating the Tableau to Power BI migration process, ensuring not just the migration of visualizations but also a clean, functional transformation of data preparation pipelines. Using our AI-powered tooling, we can read Tableau Prep flows and generate equivalent Power Query steps, dramatically reducing manual effort.
By focusing on the functional equivalence of data prep operations, and leveraging automation where possible, businesses can save time and minimize errors during migration.
Final Thoughts
Aligning Tableau’s data prep with Power BI’s Power Query isn’t just a technical challenge—it’s a strategic opportunity to modernize your analytics stack. With the right approach and expert support, your organization can bridge the gap seamlessly and take full advantage of Power BI’s integrated ecosystem.
0 notes
Text
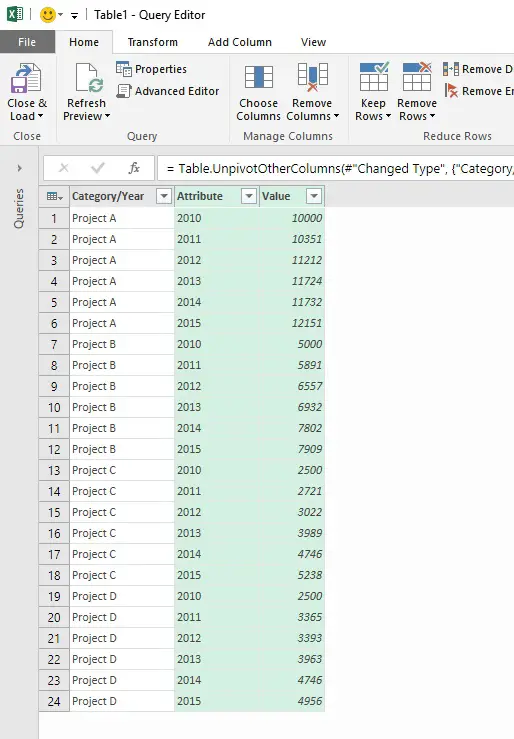
Struggling with wide datasets that are hard to analyze? Unpivoting Data in Power BI (Power Query) helps you *convert columns into rows*, making your data more structured and easier to work with. Whether you're dealing with *survey responses, financial reports, or time-series data*, unpivoting is essential for *transforming static tables into dynamic datasets*.
0 notes
Text
Mastering Pivot and Unpivot Tables in T-SQL Server
T-SQL Server Pivot and Unpivot: Transform Data Like a Pro Hello, fellow SQL enthusiasts! In this blog post, I will introduce you to Pivot and Unpivot Tables in T-SQL – one of the most powerful data transformation techniques in T-SQL Server – Pivot and Unpivot. Pivot allows you to convert rows into columns, making your data easier to analyze and report. Unpivot performs the reverse operation by���
0 notes
Text
Explain advanced transformations using Mapping Data Flows.

Advanced Transformations Using Mapping Data Flows in Azure Data Factory
Mapping Data Flows in Azure Data Factory (ADF) provide a powerful way to perform advanced transformations on data at scale. These transformations are executed in Spark-based environments, allowing efficient data processing. Below are some of the key advanced transformations that can be performed using Mapping Data Flows.
1. Aggregate Transformation
This transformation allows you to perform aggregate functions such as SUM, AVG, COUNT, MIN, MAX, etc., on grouped data.
Example Use Case:
Calculate total sales per region.
Find the average transaction amount per customer.
Steps to Implement:
Add an Aggregate transformation to your data flow.
Choose a grouping column (e.g., Region).
Define aggregate functions (e.g., SUM(SalesAmount) AS TotalSales).
2. Pivot and Unpivot Transformations
Pivot Transformation: Converts row values into columns.
Unpivot Transformation: Converts column values into rows.
Example Use Case:
Pivot: Transform sales data by year into separate columns.
Unpivot: Convert multiple product columns into a key-value structure.
Steps to Implement Pivot:
Select a column to pivot on (e.g., Year).
Define aggregate expressions (e.g., SUM(SalesAmount)).
Steps to Implement Unpivot:
Select multiple columns to unpivot.
Define a key-value output structure.
3. Window Transformation
Allows performing operations on a specific window of rows, similar to SQL window functions.
Example Use Case:
Calculate a running total of sales.
Find the rank of customers based on their purchase amount.
Steps to Implement:
Define partitioning (e.g., partition by CustomerID).
Use window functions (ROW_NUMBER(), RANK(), LEAD(), LAG(), etc.).
4. Lookup Transformation
Used to join two datasets based on a matching key.
Example Use Case:
Enrich customer data by looking up additional details from another dataset.
Steps to Implement:
Define the lookup source dataset.
Specify the matching key (e.g., CustomerID).
Choose the columns to retrieve.
5. Join Transformation
Allows joining two datasets using various join types (Inner, Outer, Left, Right, Cross).
Example Use Case:
Combine customer and order data.
Steps to Implement:
Select the join type.
Define join conditions (e.g., CustomerID = CustomerID).
6. Derived Column Transformation
Allows adding new computed columns to the dataset.
Example Use Case:
Convert date format.
Compute tax amount based on sales.
Steps to Implement:
Define expressions using the expression builder.
7. Conditional Split Transformation
Splits data into multiple outputs based on conditions.
Example Use Case:
Separate high-value and low-value orders.
Steps to Implement:
Define conditional rules (e.g., SalesAmount > 1000).
8. Exists Transformation
Checks if records exist in another dataset.
Example Use Case:
Identify customers who have made a purchase.
Steps to Implement:
Select the reference dataset.
Define the existence condition.
9. Surrogate Key Transformation
Generates unique IDs for records.
Example Use Case:
Assign unique customer IDs.
Steps to Implement:
Define the start value and increment.
10. Rank Transformation
Assigns ranking based on a specified column.
Example Use Case:
Rank products by sales.
Steps to Implement:
Define partitioning and sorting logic.
Conclusion
Azure Data Factory’s Mapping Data Flows provide a variety of advanced transformations that help in complex ETL scenarios. By leveraging these transformations, organizations can efficiently clean, enrich, and prepare data for analytics and reporting.
WEBSITE: https://www.ficusoft.in/azure-data-factory-training-in-chennai/
0 notes
Text
Data Cleansing and Structuring
Data cleansing and structuring are crucial steps in the data preparation process, ensuring that data is accurate, consistent, and formatted for analysis or machine learning. Here's a breakdown of each step:
1. Data Cleansing
This process involves identifying and correcting errors in data, improving its quality. Key activities include:
Removing Duplicates: Identifying and eliminating repeated records in the dataset.
Handling Missing Data: Using methods like imputation (filling missing values), deletion, or flagging to handle null or missing entries.
Correcting Inconsistent Data: Standardizing formats (e.g., date formats, address formats), fixing spelling mistakes, or converting numerical data into the right scale (e.g., removing currency symbols).
Outlier Detection: Identifying and handling data points that deviate significantly from the rest of the data. This might involve removing or correcting them depending on their context.
Noise Filtering: Removing irrelevant or meaningless data that may distort analysis (e.g., stopwords in text data).
2. Data Structuring
Data structuring involves organizing data into a format that is easy to analyze or use for machine learning. This step focuses on making raw data more usable:
Normalization: Scaling features (e.g., values between 0 and 1) to bring them to the same level of magnitude, which helps in various machine learning models.
Encoding: Converting categorical data (e.g., gender, location) into numerical form using techniques like one-hot encoding or label encoding.
Data Aggregation: Combining data from different sources or summary statistics (e.g., sum, average) into a cohesive form.
Feature Engineering: Creating new variables from existing data (e.g., extracting the year from a date field, categorizing data into bins).
Reshaping Data: Converting the dataset into a structured format like tables (e.g., pivoting or unpivoting data, creating time series).
Both of these processes are often done using programming tools like Python (with libraries like pandas, numpy, and scikit-learn for machine learning) or R, and may also involve using SQL for database-related cleaning tasks.
Do you have a specific dataset you're working with, or are you exploring general techniques?
0 notes
Text
Unlocking Data Insights with SQL Pivot and Unpivot: A Comprehensive Guide
CodingSight
In today's data-driven world, the ability to transform and analyze data efficiently is crucial for making informed decisions. SQL Pivot and Unpivot operations are powerful tools that can help you restructure and manipulate data, enabling you to extract valuable insights from complex datasets. In this article, we will delve into the world of SQL Pivot and Unpivot, explaining what they are, how they work, and when to use them.
What is SQL Pivot?
SQL Pivot is a data transformation operation that allows you to rotate rows into columns, essentially changing the data's orientation. This is particularly useful when you have data in a "long" format and need to display it in a more readable "wide" format. Pivot can simplify data analysis and reporting, making it a valuable technique in various scenarios.
How does SQL Pivot Work?
To perform a Pivot operation, you need to specify the columns that you want to become new columns in the output, along with the values that will populate those columns. You typically use an aggregate function to calculate the values for each new column. Here's a simplified example:
In this example, we are pivoting the data to display total revenue for each product and each salesperson. The SUM function is used to aggregate the revenue values.
When to Use SQL Pivot
SQL Pivot is ideal when you need to transform data from a long format to a wide format for reporting or analysis. Common use cases include:
Sales and revenue reporting, as demonstrated above.
Creating cross-tabular reports for survey data.
Converting timestamped data into time series data for trend analysis.
Understanding SQL Unpivot
What is SQL Unpivot?
SQL Unpivot is the reverse of Pivot. It allows you to transform data from a wide format back into a long format, which can be more suitable for certain analytical tasks. Unpivot can be used to normalize data for further processing or to simplify data integration from multiple sources.
How does SQL Unpivot Work?
Unpivot works by selecting a set of columns to transform into rows. You also specify the column that will hold the values from the selected columns and the column that will hold the column names from the original dataset. Here's a simplified example:
In this example, we are unpivoting the data to revert to the original long format. The "Product" column values become the new rows, and the "Revenue" column holds the corresponding values.
When to Use SQL Unpivot
SQL Unpivot is valuable when you need to normalize data or when you want to combine data from different sources with varying structures. Some common use cases include:
Analyzing survey data collected in a cross-tabular format.
Combining data from different departments or databases with different column structures.
Preparing data for machine learning algorithms that require a specific input format.
Conclusion
SQL Pivot and Unpivot operations are indispensable tools for data transformation and analysis. Pivot allows you to reshape data for clearer reporting and analysis, while Unpivot helps you normalize data and integrate information from diverse sources. By mastering these techniques, you can harness the full potential of your data, enabling better decision-making and insights. Whether you are a data analyst, a business intelligence professional, or a data scientist, these SQL operations will prove to be valuable assets in your toolkit. Start exploring their capabilities today, and unlock the hidden potential of your data.
0 notes
Text
Mastering Excel Power Query: With GVT Academy’s Advanced Excel Course

In today’s data-driven world, efficiency in data handling and analysis is vital for any professional. Businesses, students, and data enthusiasts alike benefit from tools that simplify data processes and make it easier to extract insights. Microsoft Excel, a staple in data analysis, continues to innovate with powerful tools, one of the most transformative being Excel Power Query. With Power Query, users can clean, transform, and load data seamlessly, saving hours of manual work and reducing errors. GVT Academy’s Advanced Excel Course is designed to empower students and professionals with the skills needed to harness the full potential of this tool. Here’s how this course can elevate your data management skills and why it’s an investment in your career.
What is an Excel Power Query?
Excel Power Query is a powerful tool within Excel that allows users to connect to various data sources, then organize, transform, and combine data seamlessly. It’s integrated into Excel as the Get & Transform feature, making it accessible for everyone from beginners to advanced users. Power Query allows you to automate data cleaning, removing redundancies and errors while keeping your data organized.
With Power Query, you don’t need to be an expert in complex functions or coding. This tool uses a simple, user-friendly interface to guide users through every step of the data transformation process. Power Query’s flexibility in connecting to numerous data sources, including databases, web pages, and CSV files, is a game-changer for those who work with large datasets or regularly update data from external sources.
Why Mastering Excel Power Query is Essential
Mastering Power Query offers several advantages:
Streamlined Data Preparation: Transforming raw data into a usable format can be one of the most time-consuming tasks in Excel. Power Query’s automated transformation capabilities make data preparation effortless.
Improved Accuracy and Consistency: Power Query reduces human error, which is often introduced during manual data handling, ensuring data consistency across reports.
Enhanced Data Analysis: With cleaner, well-organized data, users can analyze trends, patterns, and outliers with ease, unlocking insights that drive better decision-making.
Time Savings: Automating repetitive tasks like data cleaning, merging, and updating saves significant time, allowing users to focus on deeper analysis rather than manual data wrangling.
Key Skills You Will Learn in GVT Academy’s Mastering Advanced Excel Course
GVT Academy’s course is meticulously crafted to provide a comprehensive understanding of Power Query’s features and how to use them effectively. Here’s a breakdown of what you’ll learn:
1. Data Connection and Integration
Learn to connect Excel to multiple data sources, from databases to cloud services, and pull in data effortlessly.
Understand how to keep data refreshed and automatically updated from these sources, eliminating the need for manual imports.
2. Data Transformation Techniques
Discover techniques to clean, filter, and format data quickly using Power Query’s transformation tools.
Handle issues like missing data, duplicate values, and inconsistent formats, resulting in a clean, usable dataset.
3. Merging and Appending Data
Gain proficiency in combining multiple tables and data sets, which is essential for complex analyses.
Understand when to use merge versus append operations for effective data management.
4. Data Shaping and Modeling
Shape data into the right format for analysis, including pivoting, unpivoting, and grouping data.
Master the art of creating data models that allow for more advanced analyses, connecting various tables to derive insights.
5. Automation of Data Processing
Automate recurring data processing tasks, so reports and analyses can be updated with a single click.
Understand how to document your Power Query steps for easy replication and auditing.
6. Advanced Data Analysis
Learn advanced techniques like conditional columns, parameterized queries, and using M code to customize data transformations.
Explore methods to integrate Power Query with other Excel tools like Power Pivot for deeper insights.
Benefits of Taking the Advanced Excel Course at GVT Academy
Choosing GVT Academy’s Advanced Excel course means you’re investing in quality education and career-enhancing skills. Here’s what sets this course apart:
Hands-On Training: At GVT Academy, our course is designed to provide real-world applications, allowing you to work on sample datasets and case studies that mirror the challenges faced by businesses today.
Expert Guidance: The course is led by seasoned data analysts and Excel experts who bring a wealth of experience, ensuring that you gain valuable insights and practical knowledge.
Flexible Learning Options: Our course is available in both online and offline formats, making it accessible regardless of your schedule or location.
Certification and Career Support: Upon completing the course, you’ll receive a certification from GVT Academy that enhances your resume. Additionally, we offer career support to help you apply these skills in your current role or pursue new career opportunities.
How This Course Supports Your Career Growth
As data literacy becomes a highly sought-after skill across industries, Power Query expertise positions you as a valuable asset in your organization. This course:
Boosts Your Resume: Excel Power Query skills are in demand, and having this certification from GVT Academy makes your resume stand out.
Increases Your Efficiency: Employers value employees who can optimize workflows and make data-driven decisions. Power Query allows you to streamline your data processes and boost productivity.
Prepares You for Advanced Data Roles: Mastering Power Query can serve as a foundation for learning other data analysis tools, such as SQL, Power BI, or Python, which are essential for more advanced roles in data science.
Enroll in GVT Academy’s Power Query Course Today!
Mastering Excel Power Query is an investment in your career that pays dividends in saved time, increased accuracy, and improved data analysis capabilities. At GVT Academy, we’re committed to equipping you with practical, real-world skills that set you apart in the workplace.
Ready to become proficient in data transformation? Enroll in our Advanced Excel course today and start transforming and analyzing data with ease!
#gvt academy#advanced excel training institute in noida#excel training course#advanced excel training
0 notes
Text
Functions and Benefits of Power Query M | Infographic
Power Query M is a formula language used to transform and shape data in Power BI. It provides a flexible and powerful way to clean, combine, and manipulate data from various sources.
Here are the key steps to transform data using Power Query M in Power BI:
Load Data: Import your data source into Power BI using the "Get Data" option. You can connect to various sources like Excel, CSV, SQL databases, and more.
Edit Query: Once your data is loaded, right-click on the query name and select "Edit Query." This will open the Power Query Editor where you can apply transformations.
Apply Transformations: Use the available functions and operators in Power Query M to perform transformations like:
Cleaning: Remove duplicates, handle null values, and correct data types.
Combining: Merge multiple tables based on common columns.
Reshaping: Pivot or unpivot columns, add or remove columns.
Filtering: Apply conditions to extract specific data.
Sorting: Arrange data in ascending or descending order.
Grouping: Group data by specific columns and calculate aggregations.
Apply Steps: As you apply transformations, Power Query M generates a series of steps. You can edit or delete these steps to refine your data.
Close and Apply: When you're satisfied with the transformations, click "Close & Apply" to apply the changes to your Power BI report.
Found this interesting? Then check out our detailed Infographic on the use of Power Query M, and gain insights related to its benefits, market share, popular BI tools, and so on.

0 notes
Text
Use of Power Query in Power BI

Power Query in Power BI is a powerful tool used for data transformation and preparation before visualizing the data. It provides an intuitive interface to connect, combine, and refine data from various sources into a coherent, structured dataset ready for analysis. Excel Training in Mumbai often covers how to use Power Query to effectively prepare and transform data. Here's an overview of how Power Query is used in Power BI:
1. Connecting to Data Sources
Importing Data: Power Query can connect to various data sources like Excel files, databases (SQL Server, Oracle, etc.), online services (Azure, SharePoint, etc.), and even web pages.
Multiple Data Sources: You can combine data from multiple sources into a single dataset, which is especially useful when dealing with complex data architectures.
2. Data Transformation
Data Shaping: Power Query allows you to shape your data by removing unnecessary columns, renaming columns, filtering rows, and sorting data.
Data Cleansing: It provides tools to clean your data by handling missing values, removing duplicates, splitting and merging columns, and correcting data types.
Merging and Appending: You can merge (join) tables based on common columns or append (union) tables to create a unified dataset.
Conditional Columns: Power Query enables creating conditional columns based on specific logic, similar to using IF statements in Excel.
3. Advanced Data Manipulation
Grouping and Aggregation: You can group data by specific columns and aggregate data (e.g., summing, averaging) to create summary tables.
Pivoting and Unpivoting: Power Query allows pivoting rows to columns and vice versa, transforming your data into a more suitable structure for analysis.
Custom Columns: Using the M language (Power Query's formula language), you can create custom columns with complex calculations and logic.
4. Data Loading
Load to Data Model: Once the data is transformed, it can be loaded into the Power BI data model, where it can be used for creating reports and visualizations.
Direct Query vs. Import Mode: Power Query supports both Direct Query (where data is queried directly from the source) and Import Mode (where data is imported into Power BI for analysis).
5. Automation and Reusability
Query Dependencies: Power Query automatically tracks dependencies between queries, ensuring that changes in one query reflect in others that depend on it. This feature is crucial for maintaining accurate and up-to-date data models, especially in complex projects.
Reusable Steps: All transformation steps are recorded and can be modified or reused across different queries, ensuring consistency and efficiency. This capability allows users to standardize their data preparation processes and streamline workflows, which is often highlighted in Advanced Excel Classes in Mumbai to help professionals optimize their data management tasks
6. Integration with Other Power BI Features
Parameters: You can create parameters in Power Query that allow dynamic filtering and customization of data sources and queries.
Templates: Power Query transformations can be saved as templates and reused across different Power BI reports or shared with others.
7. Data Profiling
Column Quality and Distribution: Power Query provides tools to profile your data, showing column quality, value distribution, and statistics to help identify data issues early.
Error Handling: It highlights errors and outliers, allowing you to manage and clean data before loading it into the data model.
8. Performance Considerations
Query Folding: Power Query attempts to push data transformations back to the data source (query folding) whenever possible, optimizing performance by reducing the amount of data loaded into Power BI.
Example Use Cases
Sales Data Preparation: Importing sales data from multiple regional Excel files, cleaning it, and consolidating it into a single dataset for analysis.
Web Scraping: Extracting data from a web page, transforming it into a structured format, and using it in a Power BI report.
Data Integration: Combining data from an SQL Server database and a SharePoint list, transforming it, and creating a unified data model for reporting.
Steps to Access Power Query in Power BI
Open Power BI Desktop.
Go to the "Home" tab.
Click on "Transform Data" to open the Power Query Editor.
Use the various tools and options available in the Power Query Editor to connect to data sources, transform data, and prepare it for analysis.
Power Query is essential for anyone looking to perform robust data transformation and preparation in Power BI. It ensures your data is clean, well-structured, and ready for analysis, enabling better insights and decision-making. Learning Power Query is a key part of Advanced Excel Training in Mumbai, as it equips individuals with the skills needed to handle data efficiently and create powerful data models.
For more information, contact us at:
Call: 8750676576, 871076576
Email:[email protected]
Website:www.advancedexcel.net
#Excel Training in Mumbai#Advanced Excel Classes in Mumbai#Advanced Excel Training in Mumbai#advanced excel
0 notes
Text

Top 8 Data Analyst Courses In Thane With Practical Training
In today's world, analytics is not just the way of the future; it's the way of the present. Industries across the board, from airline route planning to manufacturing plant maintenance, rely on analytics for critical insights and decision-making. Even traditionally non-tech sectors like retail are leveraging analytics to enhance customer loyalty and personalize offerings. With the increasing adoption of analytics, possessing data skills has become a necessity rather than a luxury.
If you're looking to enhance your data analytics skills, Thane offers top-notch courses with practical training. Here's a curated list of the top 8 institutes offering data analyst courses in Thane:
Before we jump into our list of top data analytics courses in Thane, let's first explore what data analytics is and why it's crucial in today's business environment.
List of Institutes in Thane That Provide Data Analyst Courses
DeveLearn
DeveLearn, a prominent institute in Thane, offers comprehensive data analytics courses designed to provide students with practical skills and industry-relevant knowledge. Our curriculum focuses on hands-on training, data visualization techniques, and statistical analysis methods, ensuring students develop a strong foundation in data analytics. With experienced faculty and modern learning resources, we provides an ideal environment for aspiring data analysts to thrive and excel in the dynamic field of data analytics. Data Analyst course in Thane are available in both online and classroom formats for your convenience.
Our Course Curriculum:
Advanced Excel
The Advanced Excel course focuses on teaching advanced formulas, functions, data visualization, Pivot tables, and charts. It aims to enhance Excel skills for improved data handling and analysis in professional roles.
Data Cleaning and Preparation
Formulas and Functions
Pivot tables and Pivot charts
Data Analysis Tools
Power Query
Data Analysis and Power Pivot
Advanced Charting and Visualization
Macros and VBA
Data Annalysis with What If Analysis
Reporting and Dashboards
Python
This Python course is designed specifically for data analysts to harness Python's capabilities in data manipulation, exploration, visualization, and analysis. It equips learners with essential skills and libraries necessary for data-driven decision-making.
Python Programming Language
Data Manipulation Libraries
Data Visualization Libraries
Jupyter Notebooks
Data Cleaning and Preprocessing
SQL Integration
Statistical Analysis
Data Analysis Workflow
Web Scraping
NumPy
SQL
The SQL course provides a thorough understanding of SQL, a foundational skill for managing data and querying relational databases. It serves as an excellent starting point for beginners, enabling them to extract valuable insights and make data-driven decisions. Through hands-on learning, this course equips data analysts with the skills to efficiently query databases, perform complex data transformations, and conduct advanced data analysis using SQL.
SQL Basics
Data Manipulation
Data Aggregation and Grouping
Data Joins and Relationships
Subqueries and Derived Tables
Data Cleaning and Preparation
Window Functions (Analytical Functions)
Time Series Analysis
Pivoting and Unpivoting Data
Data Visualization with SQL
Tableau/Power BI
Tableau/Power BI course focuses on teaching users how to utilize Tableau and Power BI effectively. It covers creating interactive dashboards, charts, and reports to enhance data storytelling skills.
Data Connection and Data Source
Data Transformation and Data Modeling
Data Visualization Basics
Creating Basic Visualizations
Interactive Dashboards
Advanced Visualizations
Calculated Fields and Expressions
Table Calculations
Time Series Analysis
Level of Detail (LOD) Expressions
Course Details
Data Analyst Course in Thane
Eligibility Criteria = Fresher + Graduated
Course Duration - 1 year 2 Months
Online & Offline Training
Data Analytics Tools Covered:
R
Power BI
SQL
Python
Tableau Excel
Why Choose DeveLearn for Data Analytics Course in Thane?
🌟 Industry-Expert Instructors: Learn from seasoned professionals with hands-on experience, gaining valuable real-world insights.
📊 Cutting-Edge Curriculum: Stay updated with the latest tools and techniques in data analytics, ensuring readiness for the evolving industry.
💼 Practical Projects: Apply knowledge through hands-on projects reflecting real industry scenarios, boosting confidence and skills.
🌐 Networking Opportunities: Connect with a diverse group of learners, alumni, and industry leaders, expanding professional networks.
🔒 Seamless Career Transformation: DeveLearn offers top Data Analytics Course in Thane with Placement Assistance, facilitating a smooth entry into the dynamic analytics field.
📈 Proven Success: Benefit from a track record of successful graduates securing roles at leading companies, leveraging their data analytics expertise.
Read more - Top 8 Data Analyst Courses In Thane
0 notes
Text
Mastering Dataflow Gen2 In Microsoft Fabric (part 2)
Data transformations are an important part of any #Lakehouse project, and with #Dataflow Gen2 In Microsoft Fabric, you can start building your transformation pipelines without much training, using an easy graphical interface. In this tutorial, I explain how to apply aggregations,de-duplications and pivoting/unpivoting transformations in Dataflow Gen2. Check out here:https://youtu.be/0upqIqKlpDk
0 notes