
Don't wanna be here? Send us removal request.
Statistics
We looked inside some of the posts by tanay-soni-blog and here's what we found interesting.
Average Info
Notes Per Post
2
Likes Per Post
1
Reblog Per Post
1
Reply Per Post
0
Number of Posts By Type
Text
1
Last Seen Tumblr Blogs


Fun Fact
Tumblr was attacked by a cross-site scripting worm deployed by the Internet troll group GNAA on Dec 3, 2012.
Text
Monitoring using Sensu, StatsD, Graphite, Grafana & Slack.
At Airwoot, we are in the business of processing & mining real-time social media streams. It is critical for us to track heartbeat of our expansive distributed infrastructure and take timely action to avoid service disruptions.
With this blog post, we would like to share our work so far in creating an infrastructure watchdog and more. We started with following objectives:
Monitor everything under the radar and thereby learn how the system breath.
Use the monitoring framework to collect data and power an internal dashboard for identifying trends.
Alert anything that need attention to appropriate handlers (engineering and client servicing teams).
Let’s dive.
Monitoring Framework
Sensu
Sensu is a feature-packed distributed monitoring framework that executes health checks for applications/services and collects metrics across all connected Sensu clients, which then are relayed to a Sensu server. The checks’ results can be handled differently based on their severity levels. We choose Sensu out of the many monitoring tools available for the following reasons:
ability to write checks and handlers for check failures in any language.
large number of community plugins available and good documentation.
easy horizontal scaling by adding more clients and servers.
it acts as a “monitoring router” that publishes check requests and collects results across all Sensu clients. The results along with their context are directed to custom defined handlers for taking actions based on the criticality of results.
Source: Sensu Documentation - https://sensuapp.org
Sensu has three main components that are executed as daemon processes.
1. sensu-server runs on one or more machines in the cluster and acts as the command center for monitoring. It performs following actions:
schedules periodic checks on clients
aggregates the checks’ results and adds context to them to create events
events can be filtered and passed on to custom defined handlers for taking actions
2. sensu-client can subscribe to group(s) of checks defined on the sensu-server or can have their own standalone checks. sensu-client communicate with the server using the RabbitMQ.
3. sensu-api has a REST interface to Sensu’s data like connected clients, active events, and check results. It also has capabilities to resolve events, remove connected clients, and issue check requests.

Sensu Entities
StatsD
StatsD is a push-based network daemon that allows a statsD client to collect custom metrics and export them to a collecting server. The catch here is that StatsD uses lightweight UDP protocol for relaying metrics to the metric store, so a slow metric receiver shall not affect application’s performance. We used the Python client for statsD to collect application level metrics.
There are three main data types in statsD:
1. Counters are simply time correlated count of events taking place per unit time. There are incr and decr methods for altering the value of a counter. We extensively used counters to track brand-wise documents from social channels like Twitter and Facebook. Here’s a code snippet for tracking mentions of a brand on it’s Twitter handle:
https://gist.github.com/tanaysoni/76a6de3d7ab3e52b2860
These mentions’ metrics can be displayed at arbitrary time aggregations. Here’s how we did in our Grafana dashboard.
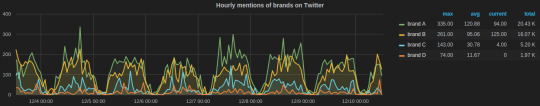
Grafana dashboard showing hourly brands’ mentions on Twitter calculated using StatsD counters.
2. Timers collect numbers times or anything that may be a number. StatsD servers then calculate the lower bound, upper bound, 90th percentile, and count of each timer for each period. We used timers to track the time in fetching social media conversation from Facebook and Twitter. Here’s the graph for the task that fetches comments on brands’ Facebook page:
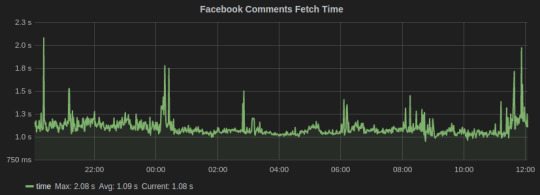
Facebook Comments
3. Gauges are a constant data type that are not subjected to averaging. They will retain their value until changed. We used gauges for computing the delays and queue lengths in our systems.
This is an excellent blog that explains these metrics in detail.
Graphite
Graphite is a database for storing numeric time series data. We use StatsD for collecting metrics, which are then stored in Graphite. There are three software components of Graphite:
1. carbon is a daemon that listens to the time series data. It has a cache that stores values in memory and subsequently flush them to disk at a regular interval. It has configuration files that define the storage schema and aggregation policies for the metrics. It tells whisper the frequency and the history of datapoints to store. We have configured carbon to store most our metrics in a frequency of 10 seconds and for a month’s time. Here’s an example config:
[storm_stats] # name of schema pattern = ^storm_stats.* # regex for matching metric names retentions = 10s:30d # frequency:history for retention
2. whisper is a database library for storing the metrics. The location of whisper files can be set from the carbon-conf file.
3. graphite webapp is the default web-based graphing library provided by graphite, but we used the more powerful Grafana dashboard.
New Relic
Infrastructure monitoring of all EC2 instances including memory, CPU, disks capacity and IO utilization. Many out-of-the-box solutions are available, so we decided not to reinvent the wheel. We have been using New Relic for a while now and it has worked perfectly(well almost!), so decided to stick with it.
New Relic has a quick step-wise guide for setting up. The problem we faced with New Relic is with their “Fullest Disk” alerts which are triggered when disk space of the fullest disk mounted on the machine being monitored is beyond alert thresholds. This fullest disk alert once open prevents alerts for the remaining disk from being triggered.
We solved this problem using Sensu disk check plugin which allows to select the disk(s) to be ignored from the check.
Supervisor
We run all the critical processes on Supervisor. It only has support for processes that are not daemonizing, i.e., they should not detach from the terminal from which they have been started. There are many process control features provided by Supervisor including restart on failures, alerts when set number of restart attempts fails, redirect output of processes to custom log directories, and autostart process on machine reboot.
We have instrumented a Sensu plugin that notifies on Slack if a process crashes. Here’s the code:
https://gist.github.com/tanaysoni/486ef4ad37ea97b98691
Monitoring of Services
Apache Kafka
The official monitoring doc is a good starting point for exploring metrics for monitoring Kafka. We use an open-source plugin released by Airbnb for sending the Kafka metrics to a StatsD server.
We have found the following metrics to be useful that we track,
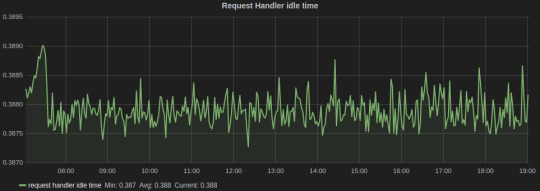
Request Handler Idle Time, which tells us the average fraction of time request handler threads were idle. It lies in the range of 0-1, and should be ideally less than 0.3.
Grafana dash for Kafka
In the above graph, the legends Min, Avg, and Current are added by Grafana. The average value for the entire graph is just under 0.4, which tells us that it’s time to scale our Kafka cluster.
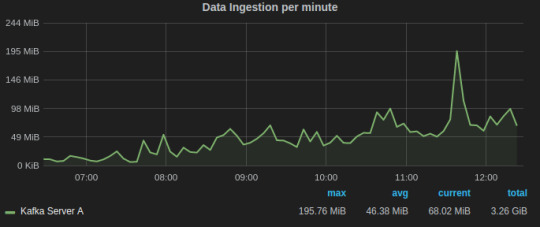
Data/Message Ingestion across all topics helps us to track and comprehend the load on the Kafka servers and how it varies with time.
Grafana dash for Kafka request handler idle time
Alerts for Kafka
A Kafka instance runs Zookeeper and Kafka-Server processes. We run them through Supervisor which automatically restarts a process if it crashes and notifies on Slack via Sensu Supervisor check.
Apache Storm
We use Storm to process data that is consumed from Kafka clusters. The command center of our Storm clusters is the Storm UI, which is provided as a daemon process in the official Storm distribution. This blog is a good documentation for Storm UI.
We run all Storm process under Supervisor, which is instrumented with Sensu to alert Slack if any process is not in the running state.
There could be instances when all Storm daemons are running, but the topology might have crashed due to a code-level bug. For this scenario, we have written a Sensu plugin that parses the output of “./storm list” to check if given topology is deployed and activated.
Since, we do stream processing using Storm and Kafka, an important metric is Kafka consumer lag which tells how far is the consumer from the producers. It is essentially the queue length of tuples yet to be consumed by the Storm. There are also Sensu alerts on consumer lag that notifies on Slack if it goes beyond a threshold.
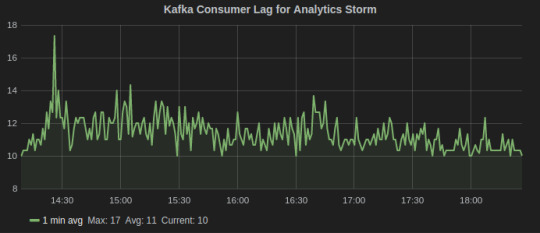
Consumer Lag metric for Kafka-Storm
Gunicorn
Gunicorn comes with a StatsD instrumentation that tracks all the metrics and sends to a StatsD client over UDP. Run Gunicorn with following command line arguments specifying the location of statsD server and an optional prefix to be added to the name of metrics.
gunicorn [ --statsd-prefix sentimentAPI.gunicorn_1] --statsd-host=localhost:8125
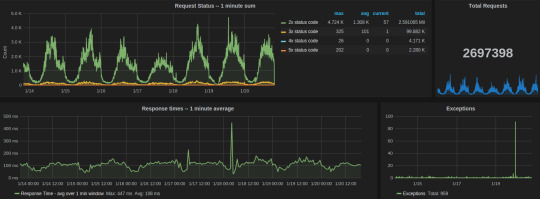
We used the following aggregations and transformations in Grafana for the Gunicorn dashboard:
Request status
series sum for all 2xx, 3xx, 4xx, and 5xx response codes
table of avg, current, and total legends help to summarize data for the given time interval
total count of exceptions in the given time range
response time average over one min window
Celery dashboard of last week
MongoDB
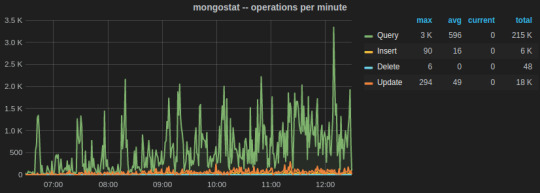
MongoDB has in-built set of utilities for reporting real-time statistics on database activities. We leveraged them to built Sensu plugin that periodically parse output from them to sent to a graphite server. These Graphite metrics are graphed on our Grafana MongoDB dashboard.
The two most important utilities are mongostat and mongotop.
mongostat tracks the load on the servers based on database operations by type including insert, update, query, and delete.
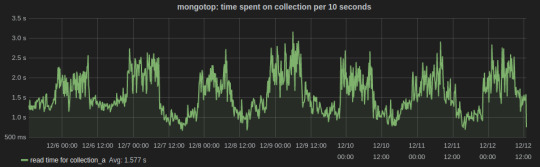
mongotop collect and reports real-time statistics on current read and write activity on a per collection basis. We wrote a Python script to send mongotop metrics to statsD client at an interval of 10 seconds.
https://gist.github.com/tanaysoni/780c4c68447cda8a0a38
Below is a Grafana dash of metrics for a collection graphed over a week time. The peaks and lows corresponds to the business hours, i.e., the reads from the collection were more during the business hours.
Sensu plugins for MongoDB monitoring
Sensu community has metrics and checks for MongoDB.
PostgreSQL
We are primarily tracking the number of connections including active, idle, and idle in transaction on PostgreSQL. For this, we created a Sensu plugin that runs periodically to fetch data from pg_stat table and output as Graphite metrics that are relayed by Sensu. Here’s the code:
https://gist.github.com/tanaysoni/30dabf820c500a58b860
PostgreSQL also provides built-in Postgres statistics collector, whose data can be relayed to a Graphite database using Postgres Sensu plugins.
Celery
Celery is an integral part of our system. Increase in the queue length beyond threshold is a critical state which the team should be informed of.
We have written a Sensu plugin which fetches the queue length of Celery every minute, which is then relayed to GraphiteDB by Sensu. If the queue length is above our warning thresholds, the team is notified on Slack.
Here’s how the Grafana dashboard for Celery looks like.
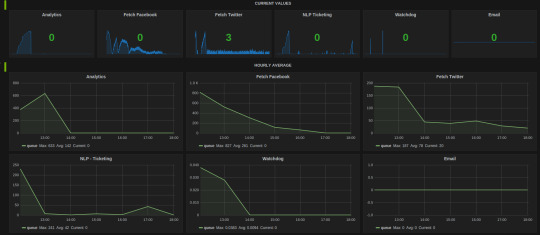
The hourly average summarization in Grafana smooths out the peaks(when bulk tasks get assigned by Celerybeat) to comprehend the load on the Celery cluster. It gives insight as to when to scale the Celery cluster to add more workers.
2 notes
·
View notes