
Scientific blog to document our adventures during the 2018 fieldcourse to Oban.
Don't wanna be here? Send us removal request.
Statistics
We looked inside some of the posts by uebays-marine-science and here's what we found interesting.
Average Info
Notes Per Post
1
Likes Per Post
1
Reblog Per Post
0
Reply Per Post
0
Time Between Posts
8 days
Number of Posts By Type
Text
14
Photo
3
Last Seen Tumblr Blogs


Fun Fact
Tumblr has been banned in Indonesia for providing people with access to pornographic content.
Text
Seol Searching
Please read and scroll right to the end...


Today, along with trying out some MATLAB, we travelled along Loch Etive to take CTD casts on the RV Seol Mara. See the video below to explain our process including casting, wind speed and direction measurements and data collection.


See you tomorrow,
The sleepy girls 👭 +1 👧

0 notes
Text
Stormy Labs and Titillating Titrations!
Today’s task was to analyse all the samples we collected on the research vessel Calanus. We tested all 30 of our samples for their amounts Chlorophyl and dissolved oxygen to check and calibrate the data from the sensors we used in the loch yesterday. We also tested the amount of phosphate in the samples. So we gladly hunkered down inside from storm Ali, cued the music and set to work for a day of chemistry.

Dissolved Oxygen – The (seriously fun) Winkler method

Using lots of fancy glassware, we worked in the laboratory to work out the oxygen concentration of our 32 samples. This was started by acidifying the samples to allow us to measure the oxygen. We then titrated (fancy science word for adding a precise amount of chemical) this sample we saw a colour change. This let us know the ‘end point’ of the titration. From this we can work out the concentration of dissolved oxygen in each sample.
Perhaps one problem with this process would be that different students titrated different samples. This could create variations in how the end point is taken for the titration. Also, as the titrations were manual (done by people) human error could affect the results.
An important part of the test was to make sure that all the chemicals we used weren’t giving a reading on their own. Fortunately this has a simple solution of adding the reagents in an order so that no oxygen is precipitated (reacted to form a solid from the liquids), then adding our indicator and checking no colour changed occurred.
After titrating dissolved oxygen samples, we then moved onto a standardisation test to check the exact concentration of the thiosulphate (titration solution) used, ensuring it was 0.0125N. To do this, we repeated the same titration process, but with a brand new made up sample solution of distilled water, sulphuric acid, iodide and manganate sulphate, as well as 5ml of iodate as an indicator. We did 4 simultaneous standardisation tests, and our readings in the end came within +/-0.1m


Chlorophyll samples

To find out the concentrations of chlorophyll at each depth we began by making a series of dilutions of given chlorophyll concentrations to act as standards. We put these through a fluorometer to measure the fluorescence given off by the chlorophyll present in the liquid. Once this was done, we started putting our chlorophyll samples from Calanus through the fluorometer, taking five readings from each sample and calculating an average. These results were collated onto a digital data sheet ready for use in Matlab.
Phosphate samples

To find out the concentration of phosphate in the water sample we compared the absorbancy of them to a calibration curve made from known concentrations of phosphate solution. We had 29 samples from 5 locations, at 6 different depths (one sample was lost due to a broken lid). To prepare the water samples for the measurements we filtered them to remove large particles. We then added a mixed reagent and left the samples to settle for two hours. One by one we measured the absorbancy of the samples using a spectrophotometer (records the light absorbed from the sample). From the calibration curve we worked out the phosphate concentration. Our method should have high precision as we did replicates on three samples, which gave extremely similar results however if we had more time and equipment it would have been preferable to do more repliceras. In general the loch we found very low levels of phosphate.


See you tomorrow,

The lab girls! 👭
1 note
·
View note
Text
Today's task
Today’s aim was to go out on the research vessel (RV) Calanus into Loch Linnhe just off the coast of Oban between the mainland and the Isle of Lismore. Whilst on the water we strategically launched our CTD rig at six locations to take data from the water and samples at six different depths of the Loch (ranging from 200m to just 30m!). The aim of this was to help us determine what makes up the Loch, such as how salty it is or if the water is in layers. Fortunately the weather was in our favour and in typical Oban style we got a taste of all four seasons. Read on to see how we took measurements!
CTD casts
The CTD profiler was launched off the side of the boat and went down to the depth determined by the principle scientist. The CTD profiler records the conductivity, temperature and depth as it travels up and down through the water. Alongside the CTD there were self closing bottles operated by the crew of the ship. These were closed at depths determined by the principal scientist to collect water samples that will be used tomorrow to calibrate or check our data. After the CTD rig was returned to the deck, water samples were taken from bottles by Ollie and Susie, ensuring no contamination occurred from the air or water. Whilst doing this Alex prepared the sample bottles and co-ordinated the labeling of the bottles. She also took them to the on board laboratory. Ensuring the lab and the records all had the correctly labelled bottle from the CTD rig.


Lab

The bottles were then passed onto the lab where phosphate, oxygen and chlorophyll specimens were prepped, ready for the lab tomorrow.
To prep the oxygen samples were preserved with chemicals. Phosphate bottles were simply placed in a cool box. While 50ml was taken from all the chlorophyll bottles and filtered through a syringe to separate the chlorophyll from the water. These filtered samples where then placed in tubes of acetone ready for analysis.


Secchi
We also used a secchi disk (a weighted disk with contrasting panels) to help determine the turbidity (transparency) of the water. The disk was lowered off the side of the Calanus, down into the water, until we couldn't distinguish between the white and black panels of the disk. This depth was recorded down (to the nearest 1 metre) and used to help determine how far down light travels through the water, and hence how far we expect chlorophyll to be.

Teamwork
What made today special was the teamwork! We all had a great day and I doubt we would have changed a thing!!
See you tomorrow,
The Scottish Girls 👭

0 notes
Text
Day 1
Activity 1
You, me and a CTD

The first section of our day involved learning all about Conductivity Temperature Depth profilers (CTDs). We experimented with two different types and practised reviewing the results, which came in different formats. The image above shows us looking at the second profile taken and considering the reasons for the results.
Activity 2
Getting cultured

Next was a great tour of the Scottish Association of Marine Sciences (SAMS) high tech facilities! We learnt about the history of the association. Went to see the world's largest culture collection where we were enthralled by the variety of bacteria, dinoflagellattes, protozoa, algae and more. Then we visited the robotics field store to see Autonomous Underwater Vehicles (AUVs) , gliders and Remote Oprrerated Vehicles (ROVs). Next we visited The Ocean Explore Centre which is open to the public weekdays between 10 and 4. Each of us enjoyed different parts of the tour and all enjoyed the gift shop. Big thanks to SAMS!!
Activity
Finding Nemo's Biogeochemical Impact

A fun-filled afternoon followed, we considered the interactions of a fish farm and its environment. Despite some challenging mathematics, we pushed through, kept each others spirits up and made it successfully to the end Fish Farm Workshop!

See you all tomorrow!

0 notes
Text


Just a few on the go photos of UEBays getting to grips with some CTD equipment on SAMS jetty!
0 notes
Text


A brilliant tour of the SAMS facilities! Gliders, cultures, history, glowing dinoflagellattes - lots of fun!
0 notes
Text


Just a few on the go photos of UEBays getting to grips with some CTD equipment on SAMS jetty!
0 notes
Text
The Winkler method for measuring dissolved oxygen in sea water: what’s good and bad about it?

Before discussing what’s good and bad about using the Winkler method, we are going to go over what the Winkler method is, the basics of how it is done and why the results are useful.
Why are the results useful?
Lots of marine scientists use dissolved oxygen measurements of sea water in their studies. Scientists use it to:
Tell apart different types of water.
Tell what is happening to organic matter in the water.
Determine rates of photosynthesis (absorption of sun light for food).
Determine rates respiration (how much oxygen organisms are using for energy).
Use it to tell how the sea is affecting climate change and CO2 concentrations.
What is the Winkler method?
The Winkler titration method is a chemical method for working out how much dissolved oxygen there is in a sample of water. It is done in a laboratory by either a person or it can be automated to a degree.
There are several variations of the Winkler method which can make the method more accurate. This will be discussed more later. There are also other ways to work out the concentration of dissolved oxygen. One of these ways often used is attaching an electronic oxygen sensor to the CTD as it is lowered into the water. This gives continuous dissolved oxygen measurements whilst in the water.
How is the Winkler Method done?
This is done by first collecting samples of sea water from the area you want, preserving them with chemicals and then taking them to the laboratory to analysis them. This is usually done from a research ship such as the R.V. Calanus shown in the photo below.

Photo: © The Scottish Association for Marine Science (SAMS), 2018
A series of water sample bottles are lowered off the ship into the water on a CTD sampler (photo below) allowing samples to be taken from different depths at the same location.

Photo: © The California Cooperative Oceanic Fisheries Investigations, 2018
These samples are then preserved onboard the ship by adding chemicals called ‘pickling reagents’. Once preserved these samples can be taken back to the lab and the concentration of dissolved oxygen worked out. This process is shown by the diagram below.

Photo: © FONDRIEST ENVIRONMENTAL INC, 2016
This is where the preserved sample is acidified with sulphuric acid to ‘release’ the preserved oxygen so it can be measured. Once this is done an accurate titration is performed whereby chemicals are added until an endpoint of the titration is found. This endpoint is known as a colour change takes place at it. This volume of chemicals added during the titration allows us to calculate the concentration of dissolved oxygen in the sample.
Whats good and bad about this version of the Winkler method?
In general the Winkler method is an easy and inexpensive way of working out the concentration of dissolved oxygen in the oceans. It is also necessary to calibrate some more autonomous methods such as electronic oxygen sensors that are attached to CTD’s. However, there are several short comings of the basic Winkler method which some other variations of it attempt to fix.
One of these archives this by optimising the concentrations of the picking reagents mean the sample is preserved better. However, this is more time consuming and adds another step to the analysis process. Also it is hard to know what concentration to optimise the pickling reagents to without first knowing more about the sample water. This would mean doing more repeat analysis of samples which is time consuming.
Also, adopting whole sample bottle titrations (analysing the whole sample in one titration) eliminates the loss of I2 (an intermediate proxy for dissolved oxygen) therefore giving a more accurate result. But this means no repeat titrations of the same sample can be done from the same bottle. Therefore, to do repeats more samples would have to be collected from the same point. This is time consuming especially considering the cost of operating some research vessels.
Some methods suggest the removal of nitrite before analysing the samples as this can interfere with the results, meaning the true value of dissolved oxygen is not given. This is especially true for sea water samples with high levels of nitrite. As well as this it is thought that the presence of hydrogen peroxide in sea water may mean that the Winkler method gives results that are higher than the actual level of dissolved oxygen.
Other improvements to the Winkler method are:
Gravimetric (very accurate) measurement of all solutions.
Pre-titration of the samples to minimise the effect of iodine volatilization, which leads to inaccuracies.
Using an accurate amperometric end point detection, this is a method that uses electric currents to find the end point of the titration instead of the naked eye and is more accurate.
Careful accounting for dissolved oxygen in the reagents
Despite all the potential shortcoming of the Winkler method, it remains a reasonably good measure of dissolved oxygen and is still used by scientists due to it ease and cheapness.
0 notes
Text
Nutrient Distribution in Coastal Zones - How did these get here?
A look into nutrient distributions in Coastal Zones
In the last few decades, the coastal Scottish seas have seen a large increase in unwanted algal blooms, impacting public health, marine life mortality and the sustainability of the aquaculture industry. Coastal algal blooms are attributed to an over influx in nutrients, in particular nitrates and phosphates, so it’s worth thinking about where these nutrients come from and where they go.
Nutrients can be input to coastal regions by both physical and biological processes, which will both be discussed in this post. This post will also touch on the human impacts on excess nutrient flux.
PHYSICAL PROCESSES:
Coastal water nutrients are input through a few key physical sources: rivers, exchanges with open oceans, topography of basins and atmospheric inputs (rainfall).

River runoff carries nutrients, primarily nitrates, from either natural weathering processes, or more significantly, from fertilizer runoff and atmospheric deposition. These nitrates can be carried downstream towards the coastal zones. Particularly during dry periods, nitrate concentrations in rivers increases substantially, hence once the first rainfall event occurs, the runoff will have very high nutrient concentrations.
While nitrate inputs tends to be riverine, phosphate inputs tends to be due to oceanic exchanges. Oceanic inputs draw in more saline water which establishes a horizontal salinity gradient. This is then followed by horizontal advection of nutrients, which regulates phosphate concentrations in the euphotic levels of lochs.
Additionally, topography also plays a role in the circulation of nutrients. In the following diagram, it is demonstrated how the riverine discharge influences coastward inflow of saline water. However, in coastal zones with a shallow sill, such as Loch Linnhe, the inflow of saline water can be held stagnant for periods of up to days or years, which has implications on the biogeochemical interactions of surface with bottom waters.
Atmospheric inputs are also of importance, in the form of rainfall deposition events, however these may be episodic and based on seasonal variation.

BIOLOGICAL PROCESSES:
Biological regulation of nutrients are usually due to denitrification, adsorption of nutrients with the environment, and the uptake of nutrients for biological growth.
Denitrification is an important process for coastal zones, whereby excess nitrate deposits are removed by carbon degradation, which helps regulate nutrient concentrations for marine habitats, and so denitrification can be thought of as a nitrate sink.
Adsorption refers to the oxidation of phosphates into other particulate matter such as clays. The nutrients stored here will then be released back out via porewaters or groundwater sources.
Dissolved nutrients are taken up by phytoplankton as a means of their biological food source. However, once these organisms die, they sink to the deeper ocean and carry with them the locked nutrients, storing them elsewhere in sediments of coastal zones.
THE ROLE OF HUMANS

The main external source of an imbalanced nutrient budget is due to human activity. Increasing populations and the demand for food and jobs have led to intensive agriculture and aquaculture practices. Both of which have led to an increase in nutrient runoff concentrations. Excessive manure and fertilisers have attributed to increases in N and P riverine runoff, and high concentrations of nitrates and phosphates can be found near areas of intensive fish farming. This surge in nutrients past what is necessary for optimal plant growth has led to the development of Harmful Algal Blooms which can prove poisonous to marine and terrestrial life, including humans.
0 notes
Text
How can fish breathe with no air?
What is deoxygenation?
Coastal deoxygenation is the removal process of oxygen from coastal waters. Oxygen is absorbed by aquatic organisms through photosynthesis (chemical process in plants using light to convert water and carbon dioxide into sugar and oxygen) and oxygen is used to help degrade organic matter. Oxygen is consumed by respiration in plants (chemical process producing energy from sugars and oxygen). When most of the oxygen from water is removed it becomes hypoxic, and when all of the oxygen is removed it becomes anoxic. Coastal deoxygenation occurs naturally in pelagic zone (water close to the shore or sea bed) and benthic zone (water in lowest ecological region) take in more oxygen than the supply of the water. It is particularly prevalent in isolated water basins.

Zones in the Ocean
Processes leading to deoxygenation
Timescale of water renewal Vs consumption of oxygen
When water is replenished, it becomes saturated with oxygen. Replenishing occurs when deep water is mixed with air, or water from a different zone in the ocean that has a higher levels of oxygen in it. The level of oxygen in the water depends on the time since mixing and the rate of consumption by pelagic and benthic biochemical processes. Water becomes hypoxic when the replenishment is less frequent than the rate of consumption.
Eutrophication
Eutropification can cause water to become hypoxic or anoxic. It is usually caused by agricultural fertilizers leaking into the ocean but can have other causes. The excess nutrients (nitrate and phosphate) fuel phytoplankton blooms, which consume oxygen and the bloom blocks light from the ocean below, which die and decay. Eventually the oxygen runs out and the algae bloom dies and decays and are broken down by bacteria, using up even more oxygen.

Algae Bloom
Aquaculture
Fish farming produces waste products, in the form of faeces and waste feed, which are discharged into the sea without treatment. The breakdown of the particulate organic matter relies of biochemical reactions that use oxygen, which leads to lowering oxygen levels in the water.

Fish Farm
Coastal Upwelling
Coastal upwelling is a process driven by northernly winds (in the northern hemisphere) that move water offshore. It causes nutrient rich water from lower levels rises, which increases its oxygen content as it mixes with water that is closer to the surface, and the air. This nutrient rich water encourages photosynthesis and phytoplankton growth. The cycle of upwelling can be relentless if the surface winds do not change direction over a long period of time as phytoplankton blooms can be formed. They can last for a long time as the nutrients supporting them are constantly being supplied from below. This also means that the water below, with low oxygen concentration cannot mix with other layers of water or the air, cause deoxygenation.

Coastal Upwelling
Oxygen Minimum Zones (OMZ)
An oxygen minimum zone (OMZ) is a layer of the ocean that is too low to mix with well oxygenated water and is below 600m. OMZ are normal features of oceans, but research suggests that they are expanding into the water above them as the oxygen concentration in the water above is declining. Water from oxygen minimum zones is upwelled, creating vertical mixing. However, the growth of OMZs is a problem for marine life as they rely on the oxygen in the upwelled water for survival.
Effects of deoxygenation on marine life
Marine Life
As oxygen is required for respiration, a lack of oxygen can have a dramatic impact on the marine life. Many pelagic creatures (fish) can migrate to an area with higher oxygen concentrations, however this is not always possible for basin of isolated water e.g. lochs. In these cases, the biomass of the pelagic organisms and organisms that cannot swim, such as benthic organisms (organisms that live close to the sea bed) decreases, until they die and decay. This can create ‘dead zones’ where there is no marine life.

Levels of marine life at different oxygen concentrations
Why this is becoming an increasing problem
Climate Change
There is the potential for hypoxic areas to experience a strong feedback mechanism through gases exchanges with the atmosphere. The consumption and production of nitrogen oxide (N2 0) and methane (CH4) is reliant on the oxygen concentration in the surface water. In areas of hypoxia the emission of these gases is higher than areas with typical oxygen concentrations. N2 0 and CH4 are both greenhouse gases which contribute to global warming, which can have knock on effects for the oceans.
Globally the temperature is predicted to increase, because of global warming. A warmer atmosphere will warm up surface water, making it less soluble, so will be able to absorb less oxygen, contribution to deoxygenation and making mixing with other layers of water more difficult. Climate models suggests oxygen concentrations will decrease by 1-7% over the next century, so the problem is only going to be exasperated!
Food Security
The demand for food is increasing and putting more pressure on resources, driven by the increasing human population and increased wealth. On land fertilisers are often used on crops, these can leak into river and cause algae blooms. The aquaculture industry is growing, requiring large volumes of oxygenated water and contributing to deoxygenation via the waste products.
Further Reading
‘Dead in the water’ by Zhang (2010)
0 notes
Text
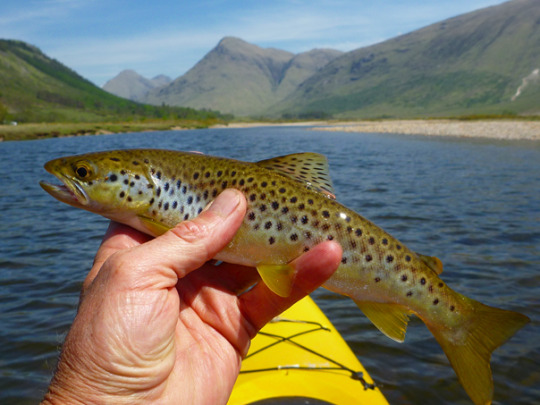
Loch Etive: Fish or No Fish?
Background
Loch Etive is a 30 km sea loch in Argyll and Bute, Scotland, situated 5 km north of Oban. It reaches the sea at Connel by a narrow sill (about 300m wide). It is 31.6 km long, 1.2 to 1.6 km wide, and up to a maximum of 150 m deep (Fig. 1). There are already some small scale fish farms in operation, mostly salmon and trout farms in the lower loch and concentrated mussel farming in the upper basin.

Figure 1. The (a) geographical map, and (b) bathymetry profile of Loch Etive.
In general, the loch system provides a suitable habitat for a variety of fish. There is sufficient oxygen, space and food supply, and appropriate temperature for fish growing and breeding.
1. Oxygen and Deep Water Renewal
The concentration of dissolved oxygen (DO) is very important in fish farming, because it is vital for the fish and also the zooplankton and other small consumers that the fish feed on. At the beginning of April, the sill water is usually saturated with oxygen, and the water above 30m has the DO of around 10mg/L, which is more than enough for the oxygen-consuming species to survive. There’s a sharp oxygen gradient at about 50m. In the meantime the water at the bottom has about only half the oxygen concentration, due to the stagnation of the water. Therefore in the bottom waters, the respiration and remineralisation of the bacterium takes up the oxygen and increases the nutrients concentration.
The deep water can be renewed in some cases. Deep water renewal in Loch Etive is considered to be salinity induced, when the dense water to the entry sill replaces the water occupying the deep basins. In order for deep water to be renewed, there should be a steady flow of water leaving the system, and it is necessary that runoff from the loch should be low. This process will bring in streams of oxygenated water to the basin and mix up the water bodies, leaving the DO at a rather high value (around 8mg/L) from the surface to the bottom (Fig. 3), which is good news for fish farming. However, among Scottish lochs, Loch Etive has an exceptionally high runoff, whereas its tidal range is relatively small. This will possibly lead to strong stratification, slow diffusion, and consequently, longer periods of stagnation in the loch, so at the bottom of the basins the oxygen concentration may not be ideal. Fortunately, fish farms don’t usually reach such depth.

Figure 2. Temperature (℃), oxygen (mg/L) and salinity (‰) contours of Loch Etive.
2. Temperature
The thermocline appears at 50-80m in April, with lower temperatures near the surface (around 7-9 degrees) and higher temperatures at the bottom (around 11 degrees) (Fig. 2), resulting from the high salinity of the bottom water. In May, after the deep water renewal, the thermocline disappears and the water temperature stays at about 9-10 degrees. However, the water starts to stratify again soon due to solar radiation at the surface, raising the surface temperature to about 13 degrees in July. The warmer surface water also enables the growth of phytoplankton.
3. Primary Production
Phytoplankton as the primary producer in the ocean, provides food for fish and zooplankton, which are prior to the fish in the food chain. Therefore, the photosynthesis of phytoplankton to some extent determines the food availability of the fish. As the water temperature, nutrients and light intensity varies throughout the year, primary production shows quite strong season cycles.
For most marine ecosystems, production is usually low in winter, limited by light and temperature, but the nutrient accumulates. When the spring comes with increasing light and temperature, production reaches its peak, using up most of the nutrients in the surface water by summer. As for Loch Etive, another factor for high production is the deep water renewal, bringing the nutrients in the bottom waters to the surface, where there’s sufficient light and oxygen. According to previous research, primary production in Loch Etive is relatively low from October to February, reaching its peak in March, followed by fluctuations around a relatively high average from April to July and a decline in August and September. The composition of the phytoplankton in Loch Etive keeps the primary production of winter from being particularly low, which provides sources of food for the fish in winters.
A research on the mussel growth in Loch Etive showed similar results. As the water temperature, salinity and food availability showed a clear seasonal cycle, consequently the growth of mussels was relatively rapid from May to October and rather slow during the rest of the year. In addition, the greatest tissue growth occurred during April to May while body length during June to August. It is worth mentioning that the annual length increments at sites in Loch Etive were significantly greater than those in Loch Leven, due to greater temperature and food availability in Loch Etive.
Could there be any problems?
The existence of fish will definitely have impacts on the environment. There would be changes in the turbidity of the water, the composition of the suspended organic matters and sediment. For Loch Etive, there’s also effects of fish escaping.
According to the report from The Oban Times in this April, Loch Etive suffered two large escapes of fish from its farms since last August, and most recently more than 5,000 rainbow trout were spread into the rest of the loch, causing modifications and damage in the loch habitat.
Conclusion
From the discussion above, it can be concluded that Loch Etive is capable of supporting fish farms, and its conditions will be changed greatly by the deep water renewals, which in this case, is mostly driven by the tides. And there’s no evidence so far that suggests major difficulty in operating fish farms in the loch. However, regulations need to be set up so that the farms doesn’t cause pollution or damage to the surrounding environment, and work in a sustainable way.
0 notes
Text
Not Blooming Plankton

Plankton are organisms ‘whose power of movement are insufficient to prevent them from being moved by water currents’ that are found in fresh or marine waters - split into phytoplankton and zooplankton referring to plant and animal species respectively. Phytoplankton is particularly important to the marine environment by contributing approximately 50% of the global annual primary production. The variety of plankton species in Scottish waters is not explained by the diversity of environments (fjordic sealochs, deep and shallow areas, thermally stratified), but in fact by the dispersive nature of the waters, particularly the clockwise circulation of water around Scotland.
A plankton bloom, like the one below, is normally made of one species of plankton which has experienced rapid growth and become ‘sufficiently abundant to colour the sea’. Blooms occur where there is enough light to allow rapid growth, sufficient levels of nutrients and mechanisms that clump plankton together are also vital requirements.

Blooms can vary in colour forming red, brown and green blooms depending on the plankton species pigments, commonly green blooms on the east coast of Scotland, as seen in the image below. A bloom can last from a couple of days to a week and the size of the bloom is dependent on the optimum combination of different environmental conditions.

Phytoplankton bloom to the east of the Scottish coast captured by NASA’s Aqua satellite.
Environmental Conditions That Encourage Blooms
As primary producers, plankton requires light for photosynthesis and dissolved organic carbon to convert to oxygen. The image below shows a simplified planktonic food web to show how changes in environmental conditions that may only effect one aspect of the web could have a negative effect to the organisms reliant upon it.
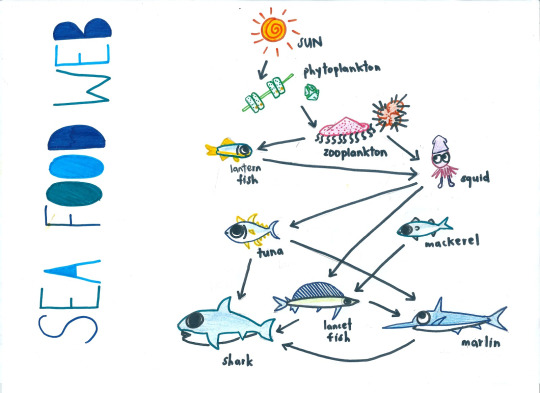
The environmental conditions encouraging blooms such as the example previous are listed below, as well as some anthropogenic activities that could be increasing the frequency or intensity of blooms:
Light
Plankton growth is limited to the euphotic zone (the section of the ocean penetrated by light)due to their photosynthetic nature. Variability in light is predominately linked to seasonality and stratification.
Nutrients
In recent years the quantity of nitrogen entering the coastal waters surrounding Scotland has increased due to anthropogenic activities. As studies have shown the nitrogen is the limiting factor to plankton growth until a N:Si ratio of 4:1 is seen, it could be said that the continuing increases in nitrogen is likely to increase the size of plankton blooms when all other conditions become optimum. Eutrophication, for example run-off of fertiliser from farmland causing excessive levels of nutrients, can increase nutrient levels and cause a bloom.
Freshwater input
Most coastal waters to the east of Scotland receive less freshwater input than west coast lochs (e.g. Creran or Striven), which significantly helps to prolong the plankton growth season. It helps because inconsistent influxes of varying quantities of freshwater input sometimes causes layering of the water column and sometimes doesn’t which allows nutrients to be used and renewed during times of mixing. The cycle between the mixed and stratified times allows the period in which blooms can be seen to not be only during thermal stratification during the short periods of warm weather experienced in the midsummer. A cycle between mixed and layered waters can help blooms to form.
Stratification
Stratification occurs when water masses with different temperatures, densities and salinities form barriers to mixing of the water column. In Scottish coastal waters this occurs when a balance between surface heating, wind-stirring, tidal-stirring and freshwater input is reached, restricting the turbulent transport of plankton out of the photic zone. Plankton can use all the available inorganic nutrients, resulting in nutrient-depleted waters, not allowing the plankton to grow and hence a decline in abundance. However, this doesn’t occur everywhere – some Scottish estuaries (e.g. those of the Forth of Tay) have strong tidal movements cause high levels of sediment suspension so that the water is so murky that growth of plankton into blooms is prevented by lack of light.
Toxic blooms
Blooms can become harmful when plankton produces toxic or negative effects on the marine ecosystem, which in turn can have negative social and economic consequences. The cause of toxicity is very complex, different for each environment and species of plankton. One species that can become harmful, native to coastal Scotland, is the Pseudo-nitzschia which when consumed through the food chain by shell fish causes amnesic shellfish poisoning. Monitoring of such toxins causes fisheries to close when the maximum permitted level of toxins in shellfish are reached, in this case 20 micrograms. Research has been and further will be carried out to study patterns of outbreaks to help predict when a bloom could occur, which would help fishermen plan for the shellfish season efficiently. As well as real-time monitoring solutions allowing for a quicker return to fishing.

MORE...
A daigram and link that may take your fancy if you found this interesting - which i guess you did as you’re reading this...

A very descriptive review of plankton ecology in a section of the western Scottish coast and further out into the Irish Sea - gives more understanding, references and a broad view of the varaibility and causes of blooms away from the coatline:
https://www.researchgate.net/publication/282644205_The_Plankton_Ecology_of_SEA7_Scottish_West_Coast
0 notes
Text
Diving deep to flush out the old and wash in the new
Deep water renewal is the process whereby the bottom most water in a lake is flushed out and replaced by new water. This process mixes the lake and can redistribute nutrients to bottom waters previously isolated by thermoclines (heat gradients) and pycnoclines (density gradients) which dramatically reduce the transfer of: heat, oxygen, salt and vital nutrients between the layers of the lake. Renewals can be partial – only some of the bottom water is replaced, or they can be full – all of the water underneath the sill water is changed.
There are three stages of deep water renewal:
1. Stagnation of bottom water, in this stage the lake is stratified, the deep water is motionless and only being lightly eroded at its top most layer where it meets the sill water.

2.Over flow of sill water, here the sill water sinks down and replaces the bottom water.

3. New bottom water stagnates, in this stage the water column re-stratifies and the new deep water becomes isolated at the lowest point of the lake.

Deep water renewal is highly dependant on changes in waters’ density which in turn is extremely dependant on salinity concentration. It is important to note that saline water is considerably denser than freshwater. For deep water renewal to occur the sill layer must become denser than the underlying bottom water. Loch Etive is a Scottish fjord which undergoes deep renewal fairly frequently. Etive has three basins and is connected to the sea by a 10m deep sill. It has the largest catchment area of any Scottish fjord measuring 1400km2; another nearby catchment from the adjacent Loch Awe drains in to Loch Etive. The flow from Loch Awe is altered by a hydroelectric scheme which has been operating for over a decade but Loch Awe is still a large freshwater input. In the last 12 years, renewal at Etive has occurred 9 times and varied from a short few weeks apart to a longer 2.5 years apart. Renewal at Etive occurs in approximately 1 week, most often in the spring and summer months, particularly at the end of April. At this time the sill water starts to become denser moves from the sill into the deep water layer. While the transfer is occurring, the mixed water results in the density of the lake layers being rather homogenous. By the middle of May the density of the sill water density has reduced, and the water column begins to stratify once more. Roughly 10% of the time, density fluctuations are due to temperature changes, but most of the time density changes are driven by the salinity concentration/ the volume of freshwater input. This is most likely to occur in dry weather conditions, particularly when there is a drought. This is because when surface runoff is high and/or precipitation is high, a lot of freshwater will be added to the lake. This dilutes the salinity of the top most water layers, causing them to become less dense. Renewal can also be caused by coastal up-welling (rising of cold bottom waters from the deep ocean), this has been shown to occur in Saanich inlet, Vancouver. Up-welling occurs off the Washington – Oregon coast; this water is cold and saline rich. It moves along the Strait of Juan de Fuca and floods in to the inlet, flooding the shallow 70m deep sill and mixing with the existing water; this new water is much denser due to its high salinity and cool temperature. This leads to the sinking of the new denser water when circulation ceases and fresh deep water, replenished in oxygen, which will once more become stratified.

Coastal up-welling Atmospheric conditions can greatly affect aquatic systems too, in the Baltic Sea pressure and winds largely dictate deep water renewal. The Baltic Sea is located in Northern Europe and almost entirely land locked, joined to the North Sea only by the Øresund, Great and Little belt. The Baltic Sea is permanently stratified with strong haloclines(salt gradients) leaving the lower layers of water devoid of oxygen. Renewals will often occur for several years one after the other but then stop for 2-3yrs until correct conditions rise again. Major Baltic inflows are large influxes of highly saline and oxygenated water which cause deep water renewal, these inflows come from the North Sea. It is only when major Baltic inflows occur that the deep water in the centre of the Baltic can be fully renewed. These arise in high pressure conditions when pressure fields form over the Atlantic and Europe in combination with strong easterly winds. The high pressure reduces run off from rivers into the Baltic and lessens precipitation, this in turn decreases the sea level – intensifying deep currents and causing the mixing required for renewal. In summary, deep water renewal occurs in three main stages and is mainly driven by the changing density of water which is greatly altered by its salinity. Renewal can be caused by: coastal up-welling, periods of drought and atmospheric conditions such as high winds and pressure.
References: Anderson J. J. and Devol A. H. (1973) Deep water renewal in Saanich Inlet, an intermittently anoxic basin. Estuarine and Coastal Marine Science. Pp.1-10.
Edwards A. and Edelsten D. J. (1977) Deep water renewal of Loch Etive: a three basin Scottish fjord. Estuarine and Coastal Marine Science. Volume 5 pp.575–595.
Schinke H. and Matthäus W. (1998) On the causes of major Baltic inflows--an analysis of long time series. Continental Shelf Research. Volume 18 pp.67–97.
0 notes
Photo

Whisky in the Rain: Welcome to Oban
Welcome to Oban, where we’re always open, The colosseum is here, you should enter with fear, Lochs surround, let’s not run aground, Markie Dans is buzzing, the locals are scuffing, The waves are wild, the swimming is mild, The boats are moored, seas that plenty have toured, Tenant’s taps are flowing, rosy cheeks are glowing, It’s pouring with rain, we’ll have fun all the same, On a research vessel we go, salinity is our foe, The distillery is waiting, we’re only here for the tasting!
(Image source: Wikipedia)
0 notes
Photo

Better late than never!
Hi everyone, I’m Adrian! I’m a (now going onto) 3rdyear Meteorology and Oceanography student. Here’s a few things you should know about me:
· I come from a tiny country in South East Asia called Brunei. The easiest way to describe it is that Brunei is basically a “little sister” country to Malaysia. My British friends once took the liberty to find out that Brunei is roughly 5 times the size of London, but with a population that is 20 times smaller.
· While managing the 2nd year workload, I was in 3 UEA society committees last year and will be doing the same this year. So, if you’re ever looking to get in touch with the UEA Table Tennis Society, Catholic Society, or Brunei Society (for which I am now president), you know who to contact!
· Getting through the grind of university wouldn’t be possible without finding some sort of stress relief, so you’d be bound to find me doing some form of sports; be it badminton, swimming, running or table tennis. Otherwise I fill my time either playing guitar, sketching or playing unofficial photographer on days out with my friends.
· While being a MetOcean student and having experienced the Shelf Sea Dynamics & Coastal Processes and Ocean Circulation modules, I am particularly interested in Physical Oceanography, and will be most looking forward to the activities involving taking actual CTD readings and investigating vertical water profiles.
· I have also joined the 1st year Slapton and 2nd year Lake District Weather Applications field courses, so I understand the challenges of group projects, but also the satisfaction of when a good collective idea comes together.
· I have had limited experience working with SPSS so may not be the most reliable for Statistical analyses, however I do have quite a bit of experience with MATLAB, thanks to my 2nd year Shelf Sea Dynamics & Coastal Processes and Mathematics for Scientists C modules. I am also primarily utilising MATLAB in my final year project.
· Additionally, through a summer internship, I have attained more professional experience in MS Office (particularly Excel) and I have basic abilities in using ArcGISfor mapping.
This Oban field course is gearing up to be my most anticipated field course yet; not only because I will be getting to do practical oceanographic work, but also because I can’t wait to be back in Scotland (I’d only been to Edinburgh before). Can’t wait to meet all of you, and here’s to a great field course ahead!
0 notes
Photo

Who am I? Hi, I’m Ollie, as you’ve probably guessed reading this blog I’m joining this year’s Marine Sciences field course to Oban. I’m currently a 3rd Year chemistry (MChem) student studying on exchange at the University of Wollongong (UOW) in Australia and I can’t wait to kick off 4th year up in Oban.
What do I do? Normally my degree involves a wide variety of Chemistry, from computationally modelling proteins to analysing sediment from Sydney Harbour for heavy metals. I can safely say sitting in a lab cooking up (anti-cancer) drugs is where I am most comfortable, and, what I will probably spend a good proportion of this year doing. So after being skyped into a seminar to meet the rest of my group, I’m looking forward to, even if a little apprehensively, getting out of the lab and into the great outdoors (even if that does mean going to Scotland).
What have I been doing in Australia? This question was asked to me by another member of the team, however, Skype decided to cut out! I am currently doing the “year abroad” part of my degree, studying at UOW for a year starting July 2017. Whilst here, I’m not only studying (and going to the beach across the road), but I’ve also taken the opportunity to go travelling around a bit. This has included hiking across an active volcano in New Zealand, snorkelling the Great Barrier Reef, and drinking cocktails atop one of the tallest buildings in Singapore. Obviously, all of this doesn’t compare to life in Norwich where you can hike to Bowthorpe, swim at SportsPark and have a drink in the square on a sunny afternoon.
Why this field course? Why not! I can safely say my experience of marine science is limited, I have absolutely no fieldwork experience and my skills on MatLab are a little rusty at best. But not being from these backgrounds is my key strength. I’m here to learn about marine science and can hopefully give slightly different perspective to the project whilst trying to do what many chemists fail, and get out in the real world. I also do have a love for the water and enjoy being on boats, even if I am more used to little ones with sails than research vessels.
0 notes
Text
Hello! I’m Susie!

I’m a first year geographer at UEA and am really looking forward to this trip. About a month ago I was on a field trip in Slapton, Devon which was a huge amount of fun and where I went on a boat, taking water samples along the river Dart which I did chemical analysis on. Also I have really enjoyed learning about some aspects of oceans in geography and am excited to expand this knowledge and my interest in oceanography through the trip. I love going to places and being able to understand and explain the formation of geographical features (although my friends and family aren’t always so interested), so I would love to be able to do that with the ocean. I’m involved in Ultimate Frisbee at UEA, which I love and have been to several tournaments, including nationals! I’ve been to Scotland once before, where I visited John O’Groats with my family, and so I can’t wait to explore more of Scotland!!
:)
0 notes