
Don't wanna be here? Send us removal request.
Statistics
We looked inside some of the posts by ultraharshagarwalposts and here's what we found interesting.
Average Info
Notes Per Post
1
Likes Per Post
1
Reblog Per Post
0
Reply Per Post
0
Time Between Posts
1 day
Number of Posts By Type
Text
4
Last Seen Tumblr Blogs


Fun Fact
When “GIF” was named word of the year in 2012, Oxford Dictionaries U.S.A. credited Tumblr for pushing the word.
Text
Assignment 4 on data management and visualization.
Hello everyone,
I am Very excited to show the results which i found on the graphical analysis of the code in week 4 in data management and visualization using SAS programme.
MY research question are How income per person is affecting urban rate. and How urbanization increases the energy consumption. which are from GAPMINDER.
My code for it is as follows

Output is:-
1:- Univariate
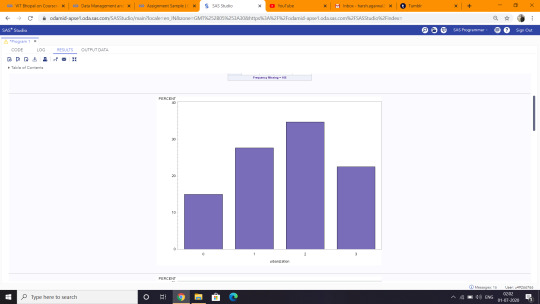
I observed from the above results for urbanization that graph is unimodal with skewed to the left and maximum percentage of approx 35% in 2nd category for the x axis.

I also observed from the above results for energy that graph is unimodal with skewed to the right and maximum percentage of approx 65% in 0 category for the x axis.

It is also observed from the above results for income that graph is unimodal with skewed to the right and maximum percentage of approx 35% in 0 category for the x axis.
2:- Bivariate

It is observed from the above results for urbanization Vs energy that as urbanization increases energy consumption also increases.

Last observation from the above results for urbanization Vs income that as urbanization increases income per person also increases.
Thanks
0 notes
Text
Assignment 3 using SAS programme
Hii eyeryone.
This is the 3rd assignment for the data management and visualization.
My research question is How income per person is affecting urban rate. and How urbanization increases the energy consumption. which are from GAPMINDER.
My SAS programme is given below.

My result are as follows.


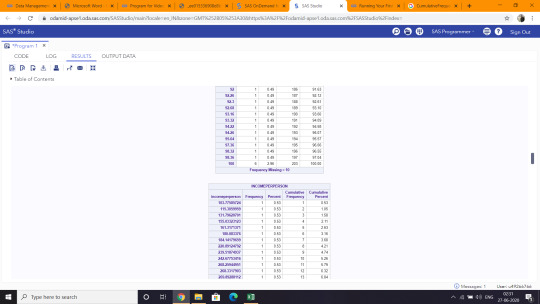
For the above result I collapsed the results in 3 variables which are urbanization, energy and income.
I founded that the countries which has urbanization less than 25 are 32,greater than 25 but less than 50 are 59 ,greater than 50 but less than 75 are 74 and the countries greater than 75 or 100 are 48 with no missing data.
I also found that the countries having energy less than 1000 are 65.65% ,greater than 1000 but less than 2000 are 16.79% ,greater than 2000 but less than 3000 are 9.16%, greater than 3000 but less than 4000 are 1.53% and greater than 4000 are 6.87% with missing data of 82 countries.
Lastly I got that countries having the income per person less than 100 but greater than 10000 are 76.88%, less than 10000 but greater than 20000 are 9.14%, less than 20000 but greater than 30000 are 7.53%, and greater than 30000 but less than 40000 are 6.45% with a missing data of 27 countries.
0 notes
Text
Assignment 2 using SAS programme
Hey! everyone
As my research question is from gapminder so I chose the variable as urbanrate, relectricperperson and incomeperperson.
My SAS programme is written below.

MY results are given below


The data of 214 countries is provided. In urban rate we saw a large similarity in the data.10 countries didn’t provide any data so the missing frequency shows 10 and except the last frequency almost all countries has its unique value in number for urban rate and 6 countries reports 100% urban rate.
The next variable is about income per person in which 23 countries data is unavailable but rest of the countries also has different values of income per person. All countries report 0.53% of income per person which is a unique one.
The last variable shows the electricity consumption per person and here also we saw the same similarity. 77 countries provides no data ie missing frequencies and every country has its unique value for data in electricity consumption per person
0 notes
Text
Assignment 1 in Data management and Visualization
Hi everyone This is a blog in which I will discuss about my research question.
I have decided to go with the data GAP MINDER as the data set.
My specific topic of interest is How income per person is affecting urban rate.
code book:-
Question- How does urbanization affect our economy?
Answer- It is generally accepted that economic growth promotes the expansion of modern industries and an increase in the urban population; in turn, urbanization also promotes economic growth to some extent leading to increase in income per person.
Question-Positive and negative impact of urbanization?
Answer- Urbanization affects the physical environment through the impacts of the number of people, their activities and the increased demands on resources. Urbanization has negative consequences on health due mainly to pollution and overcrowded living conditions.
Question- Relationship between urbanization and development?
Answer- The level of urbanization and economic development are positively related. An increase in concentration of population at one place yield many positive externalities, increasing productivity and efficiency.
My second question for the assignment is how urbanization leads to increase in electricity production?
Code book:-
Urbanisation has increased energy consumption along three main pathways: urban spatial expansion, where urban sprawl has increased energy consumption in new buildings and the transport sector; urban motorisation, which induces energy-intensive transportation; and the rising quality of energy-intensive lifestyles. Urban households consume 50% more energy than rural households per capita, which indicates that continued urbanisation will promote the growth of national energy consumption. Urban policies designed to encourage compact urban growth, green buildings and new energy vehicles could thus play a vital role in saving energy. Undoubtedly, the changes in lifestyle and growth of a consumption society and e-Society will bring new challenges to energy-saving policies and climate change mitigation initiatives
Literature:-
The relationship between urbanization and level of income has been the subject of considerable theoretical debate and empirical study for many years. However, little recent work has been done to determine whether or not previous findings still hold, and there has been even less multi-country analysis to explore the degree of generality. Analysis of data for metropolitan areas in the United States from 1970 to 1990 indicates per capita income increases directly with population size. For states of the United States and 113 countries for 1960 and 1980 a strong positive relationship exists and holds temporally between level of per capita Gross Domestic Product and percent of the population that is urban.
Hypothesis:- Does increase in income per person is proportional to the increase in the rate of urbanization?
References:-
1- https://link.springer.com/article/10.1007/BF02404704
2- Ahluwalia, Montek. 1976. Inequality, poverty, and development.Journal of Development Economics
https://linkinghub.elsevier.com/retrieve/pii/0304387876900274
3- The impact of urbanisation on energy consumption
https://www.sciencedirect.com/science/article/abs/pii/S2212095517301013#:~:text=Urbanisation%20has%20increased%20energy%20consumption,quality%20of%20energy%2Dintensive%20lifestyles.
1 note
·
View note