#DIATradeSignals
Explore tagged Tumblr posts
Visit Tumblr Blog
Explore Tumblr blogs with no restrictions, modern design and the best experience.
Last Seen Tumblr Blogs


Fun Fact
In 2020, 27% of US Tumblr users had an annual household income of over $100,000.
Text
Crono-Crash & The Slingshot
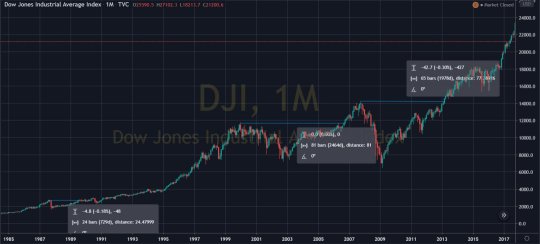
Livio, I exited with the Wealth Preserver on the on March 2nd. The last couple of bullish days brought to mind the Slingshot, are we there and have we missed the first 2 days. In your recent Celente video post you mentioned we're entering into a global depression which may be even worse than the Great Depression. Before all that happens is it possible we see DOW tumble another 5K-10K? There seems to be an incredible amount of liquidating-at-all-costs mentality at the moment. I worked on an equity desk during the 2008 crisis, and currently at a very small non-bank FX dealing desk and have never seen anything like this. Your feedback is always appreciated. Thanks, Victor"Great Question Victor. The simple answer is NO. The worst-case scenario appears to be testing the reversal technical line in the 15,000 level and do not see a drop to 5-10K. That is way too far for a slingshot. I see the slingshot build and breakout to new highs by 2023. However, let's tale a look at history to guide us on recovery times with similar drops to our current CronoCrash. Look at the two charts below.What you see is that it took 65 months from the 2007-2009 Crash to get back to even. The 1987 Crash appears to be a likely type of pattern from a timing perspective to our current Crono-Crash. That was a 53% decline and took 24 months to break even. The 2000 -2003 Bear Market was a 3 year 54% decline and took 81 months to break even. If we were to fall on par with those declines, we would be looking at a drop to the mid-15000 level.Because InterAnalyst members s stepped aside (red signals) for most of the Corona-Crash, they will miss all those months of recovery just to get back to even. More importantly, while everyone else is back to even, those who stepped aside will be 100% - 400% ahead of those buy and hold investors who did not step aside of the Corona-Crash. As for the future, when we get back in (green signal) we could reach the test of just below the 40,000 level happening in 2024. Read the full article
#BearMarket#bearmarketprotection#DIA#DIATradeSignals#DowJonesMarketUpdate#DowJonesTradeSignals#DowJonesTradingSignals#DowJonesupdate#InterAnalyst#MarketCrash#MarketUpdate#Nasdaq#NasdaqTradingSignals#QQQ#QQQTradeSignals#QQQTradingSignals#Russell2000#Russell2000MarketUpdate#Russell2000TradingSigals#RUT#RUT&SPYTRADINGUPDATE#RUTTradeSignals#RUTTradingSignals#RUTTRADINGSTRATEGY#s&p500#S&P500#S&P500Index#S&P500MarketUpdate#S&P500TradingSignals#SPX
0 notes
Text
Marxism, Buffett, Dalio, Stalin & The Bottom

As always, the Democrats just can't stand the fact that Trump might take credit for helping people and have blocked and relief package. Democrats claimed in true Marxist fashion in the Senate that the GOP’s push to set aside $425 billion for loans to help select companies and industries, dubbing it a “slush fund” for the Treasury to direct as it sees fit. They said the bill is tilted toward corporations instead of working people. What they fail to even address is that those working people rely upon small businesses the Democrats hate so much which provides 70% of their employment. Small businesses have been ordered to close down. They cannot pay employees and nobody has suspended their rents. The destruction of small businesses will be devastating to the economy and this is all about playing politics. I am saddened. The closing for March, if down from last Friday may spark more serious liquidation as Hedge Funds dump everything and some may more to suspend withdrawals as is taking place in European bond funds. The Solus Alternative Asset Management LP, Hedge Fund, known for its investment in retail chain Toys “R” Us, informed its investors that it is shutting its flagship fund and will restrict redemption's as it works to sell off holdings. Even Warren Buffett's Berkshire Hathaway may have lost more than $70 billion on its 10 biggest investments. This type of decline shows that the buy-and-hold strategy fails in a serious market correction. Ray Dalio, who will go down in history for his proclamation that "cash is trash" on January 21, 2020, has lost probably more than $4 trillion in Bridgewater. Where the 2007-2009 Crash took out Lehman Brothers and Bear Stearns, this time we will see Hedge Funds go down in flames. This undermines liquidity and makes the market vulnerable because market-makers pull back just to survive. We are headed into a Global Recession which could become even worse than the Great Depression. Here's why? This time we have politicians taking advice from the medical industry. The medical people who do not understand that you cannot shut down the economy on this grand scale because of the devastation is insurmountable to people, their jobs, and wiping out their pensions. This economic shut down on such a massive scale is far worse than if the Corona death toll was even 8%. Never before has the economy been crashing with such speed for this is orchestrated by people who only look at how diseases spread and not how the economy contracts.

Yes, it is true that if we all stayed home we can even beat the common cold. But the post-coronavirus world is going to be far more damaging to the future than any of these people understand. To have the Democrats playing politics in the middle of the is just insane. Liquidity is collapsing everywhere. Bank failures rose after the 1929 crash because liquidity failure with a declining velocity = less money with even less money moving around the economy = recession and potential depression. A monthly closing on Oil below $20.50 will warn of the economic recession ahead as people stay home and this command of quarantine and social distancing may undermine the very cooperation which is the foundation of civilization. If people are afraid to interact and suspect everyone, that is precisely the atmosphere created by Stalin during the Communist era. We are voluntarily limiting and quickly losing all rights including the freedom of assembly. Even Twitter has shut down those who dissent against the coronavirus and this is calling into question our freedom of speech as well. InterAnalyst will help guide everyone out of this time of insecurity and political misdirection via selfish ignorance. Look at the chart below: As the markets find the bottom, it will be laced with volatility and insecurity with the media frightening you to the point of insecurity. this is not done for YOU as an InterAnalyst member. It is done for those Buy and Holders who never exited at the top and now have been scared into submission. However, as an InterAnalyst member, you recognize that it likely will become the best entry point of your life! Yes, insecurity will be there but you know the stock market is going nowhere! The stock market never lies and it always returns when there is "blood in the street" and the bottom arrives. Thus, follow the guideline to a risky to safe entry back into the coming slingshot move.When the Daily chart delivers a green signal, jump for joy, then choose to enter a position or wait to see if the daily signal is holding for a few days for stability. If we are at or close to a bottom, volatility will be very high so prepare for it if you choose to trade it.When the Daily is followed by a Weekly green signal you know that the economy is attempting to settle and gain strength. You should begin to feel a bit more secure. Entering a bullish position here is a bit less risky because the weekly signal has some economic strength attached rather than pure daily volatility. You can even wait another week to see if it develops more strength.Once the Green signal has elevated from the Daily to the Weekly and the Weekly has moved into a second or third week of a bullish trend, you may select to beat the green monthly Wealth Preserver signal by entering a bullish position before month end. If you look at The Wealth Preserver chart above, ask yourself whether you remember the days or weeks Just prior to the bottom green signals in 2003 and 2008? NOPE, right. You don't remember them, but what you would have remembered is getting in after preserving your money at the prior top, before the full devastating decline those bear markets delivered. The same is true now. So, the bottom is going to come. You must be patient, it will arrive, it always does! Enter in when you feel most comfortable, but recognize that the Wealth Preserver has proven to be deadly accurate at economic turning points. The phrase to be true: "Better Safe, than Sorry!" Obviously, entry at any point has its risks, but as you look closely at The Wealth Preserver chart above, making a move using the monthly charts is rarely a poor decision...ESPECIALLY OFF THE BOTTOM. This time it is coming with a slingshot. Read the full article
#BearMarket#bearmarketprotection#China#CryptoTrading.#DIA#DIATradeSignals#dowjones#DowJonesMarketUpdate#DowJonesTradeSignals#DowJonesTradingSignals#MarketCrash#MarketUpdate#Nasdaq#NasdaqTradingSignals#Oil#QQQ#QQQTradeSignals#QQQTradingSignals#QQQTRADINGUPDATE#Russell2000#Russell2000MarketUpdate#Russell2000TradingSigals#RUT#RUT&SPYTRADINGUPDATE#RUTTradeSignals#RUTTradingSignals#RUTTRADINGSTRATEGY#RUTTRADINGUPDATE#sp500etf#s&p500
0 notes
Text
The Virus Peak & Stock Market Bottom

I cannot make any claims about the virus itself and this post is the reaction of major stock markets. A good explanation I’ve found on epidemics and exponential growth is this one on YouTube which I recommend watching if you are not already up to speed. Looking at the current situation it appears that the market has room to fall further as the economic fallout continues and the virus spreads. If the virus starts to slow down, it won’t be long before stocks find a bottom given the huge amount of stimulus that central banks are providing. The most important thing is that we need to see the number of new daily cases start to flatten out. Currently the virus is spreading at an exponential rate and that is causing businesses and services around the world to enter lock-down. That has dire consequences for company profits.
Exponential Growth
To summarize some of the information in the mentioned video above, exponential growth means that as you go from one day to the next you have to multiply by some constant. In the case of coronavirus, daily cases have been increasing by about 1.15 to 1.25 times the previous day’s cases. This results in an exponential curve with the number of new cases increasing on a daily basis. In fact, a virus provides a textbook example of exponential growth since what causes new cases are existing cases. However, there comes a time when exponential growth has to slow down. For example, as millions of people become sick there are fewer people that can be infected so the rate of new cases must decrease. Likewise, measures such as hand washing and limiting gatherings also have the effect of reducing the spread. So an exponential curve will eventually level out at an inflection point and turn into what’s called a logistics curve. At this point the number of new cases each day levels out and then starts decreasing. We have already seen this happen in China and now it is happening in South Korea too. New cases in China leveling out. Source: John Hopkins University. Growth Factor = No. New Cases Today / No. New Cases Yesterday A value over 1 indicates that we are still on the exponential part of the curve and there may be higher magnitudes of new cases ahead of us. In other words the growth is not slowing down. This is the case right now in the USA and Europe. Whereas a value of 1 means that growth is leveling out and a value under 1 means new cases are decreasing. Taking China as an example, the coronavirus spread began at an exponential rate which has gradually leveled off thanks to drastic shutdown measures. With new cases appearing to have peaked the country has been able to get back to work and reboot its economy. Meanwhile, the United States and Europe have only just started to see new cases increase, indicating that they are likely to be near the beginning of the exponential curve. What does all this mean for the stock market now? I think we need to see the growth rate of new cases in the US and Europe start to level off before we can put in a major stock market bottom. So we need to see the daily growth rate drop to one or below and then stay there, perhaps for a week or so. Once that happens I think we will see a bottom in stocks and a significant relief rally thanks to the huge amount of stimulus that is being provided by central banks. It is because of this stimulus that we will see the slingshot. Importantly, though, I don’t think we need to see growth rates level off for the whole world. It would be enough to see growth rates in the US and Europe start to slow for a bottom to be put in. That’s because these areas (plus China) account for the vast majority of global GDP. To keep on track of this I am using the coronavirus dashboard developed by John Hopkins University which seems to provide the most up to date and reliable figures that I’ve found. The dashboard provides the latest statistics on new cases which can then be used to calculate growth rates.

For example, new cases outside China was 100.5k on Monday March 15th, higher than the previous day’s 81.7k cases and higher than the 75.1k cases on Saturday, a growth factor of 2.8. Analyzing these numbers it doesn’t seem all that surprising that 10% drop in US stocks that day coincided with a huge daily growth rate of 2.8 times (this is for locations outside Mainland China). Final Thoughts Ultimately, virus growth rates and the stock market are linked and so long as the curve is exponential the markets are going to struggle. Stock markets are likely to rally every time the virus looks to have been defeated, even when it’s not. The data isn’t entirely accurate so there is likely to be some false starts. It’s also possible that the market will be able to lead a flattening in the virus whether it is caused by luck, government intervention or some other reason. But eventually the market will get it right, it always does. That being said, when stocks are up and the exponential curve has leveled off, review your Daily, then your Weekly charts with signals for Green Light Trade Signals because that will mean we are close to a bottom, or the bottom may be in! Credit: Mr. Marwood, thank you for your research. Read the full article
#BearMarket#bearmarketprotection#BitcoinTradeSignals#BitcoinTradingSignals#China#CrudeOil#CryptoTrading.#Cryptocurrency#DIA#DIATradeSignals#DowJonesTradeSignals#DowJonesTradingSignals#ETFTrading#FOREX#forextrading#Gold#GoldTradingSignals#MarketCrash#MarketUpdate#Nasdaq#NasdaqTradingSignals#QQQ#QQQTradeSignals#QQQTradingSignals#Retirement#RetirementProtection#Russell2000#Russell2000MarketUpdate#Russell2000TradingSigals#RUTTradeSignals
0 notes
Text
3 Up Gaps That Must Fill
Read the full article
#BearMarket#DIATradeSignals#DowJonesTradeSignals#DowJonesTradingSignals#DowJonesupdate#Economy#ETFTrading#InterAnalyst#MarketCrash#MarketUpdate#NasdaqTradingSignals#QQQTradeSignals#QQQTradingSignals#RetirementProtection#Russell2000MarketUpdate#Russell2000TradingSigals#RUT&SPYTRADINGUPDATE#RUTTradeSignals#RUTTradingSignals#RUTTRADINGUPDATE#S&P500TradingSignals#SPYTradeSignals#SPYTradingSignals#STANDARD&POORS500#StockMarketBubble#StockMarketCrash#StockTrading#StockTradingSignals#TheWealthMaximizer#TheWealthMaximizerPro
0 notes
Text
Has The U.S. Economy Plunged Into A Depression?
Read the full article
#BearMarket#bearmarketprotection#China#CommodityTradingSignals#CryptoTrading.#DIATradeSignals#DowJonesMarketUpdate#DowJonesTradeSignals#DowJonesTradingSignals#forextrading#Gold#GoldTradingSignals#InterAnalyst#MarketCrash#MarketUpdate#NasdaqTradingSignals#pensioncrisisinAmerica#QQQ#QQQTradeSignals#QQQTradingSignals#QQQTRADINGUPDATE#Retirment#Russell2000MarketUpdate#Russell2000TradingSigals#RUT#RUTTradeSignals#RUTTradingSignals#RUTTRADINGSTRATEGY#RUTTRADINGUPDATE#S&P500Index
0 notes
Text
6 MUST FILL TRADING GAPS
Read the full article
#BearMarket#DIATradeSignals#DowJonesTradeSignals#Economy#GoldTradingSignals#MarketCrash#NasdaqTradingSignals#QQQTradeSignals#QQQTradingSignals#RetirementProtection#Russell2000MarketUpdate#Russell2000TradingSigals#RUTTradeSignals#RUTTradingSignals#RUTTRADINGSTRATEGY#S&P500TradingSignals#SilverTradeSignals#SilverTradingCharts#SilverTradingSignals#SPYTradeSignals#SPYTradingSignals#STANDARD&POORS500#StockMarketBubble#StockMarketCorrection#StockMarketCrash#StockTrading#TheWealthMaximizer#TheWealthMaximizerPro#WealthMaximizerPRO#WealthMazimizer
0 notes
Text
Why Mark Mobius says the stock market hasn’t seen an ‘absolute bottom’ yet
Read the full article
#BearMarket#Bitcoin#China#CrudeOil#DIA#DIATradeSignals#DowJonesTradeSignals#FOREX#forextrading#Gold#GoldTradingSignals#MarketCrash#Nasdaq#NasdaqTradingSignals#QQQ#QQQTradeSignals#Russell2000#Russell2000MarketUpdate#Russell2000TradingSigals#RUT#RUTTradeSignals#RUTTradingSignals#S&P500Index#S&P500MarketUpdate#SilverTradeSignals#SilverTradingSignals#SPY#SPYTradeSignals#SPYTradingSignals#SPYTRADINGUPDATE
0 notes
Text
Stocks vs Gold and Silver, Who Wins?

#BearMarket #bearmarketprotection #Bubble #DIA #DIATradeSignals #DowJonesTradingSignals #HousingBubble #Nasdaq #NasdaqTradingSignals #QQQ #QQQTradeSignals #QQQTradingSignals #RealEstate #Russell2000 #Russell2000TradingSigals #RUTTradeSignals #RUTTradingSignals #S&P500 #S&P500Index #S&P500TradingSignals #SPY #SPYTradeSignals #SPYTradingSignals #StockMarketBubble #StockTradingSignals #WealthMaximizer #WealthMaximizerPRO #WealthPreserver Read the full article
0 notes
Text
New Housing Bubble

#BearMarket #bearmarketprotection #Bubble #DIA #DIATradeSignals #DowJonesTradingSignals #HousingBubble #Nasdaq #NasdaqTradingSignals #QQQ #QQQTradeSignals #QQQTradingSignals #RealEstate #Russell2000 #Russell2000TradingSigals #RUTTradeSignals #RUTTradingSignals #S&P500 #S&P500Index #S&P500TradingSignals #SPY #SPYTradeSignals #SPYTradingSignals #StockMarketBubble #StockTradingSignals #WealthMaximizer #WealthMaximizerPRO #WealthPreserver Read the full article
0 notes
Text
Money Supply Vs. Inflation

#BearMarket #bearmarketprotection #DIA #DIATradeSignals #DowJonesMarketUpdate #DowJonesTradingSignals #DowJonesupdate #Nasdaq #NasdaqTradingSignals #QQQ #QQQTradeSignals #QQQTradingSignals #QQQTRADINGUPDATE #Russell2000 #Russell2000MarketUpdate #Russell2000TradingSigals #RUTTradeSignals #RUTTradingSignals #RUTTRADINGSTRATEGY #RUTTRADINGUPDATE #sp500etf #s&p500 #S&P500 #S&P500Index #S&P500MarketUpdate #S&P500TradingSignals #SPY #SPYTradeSignals #SPYTradingSignals #STANDARD&POORS500 #StockMarketBubble #StockTradingSignals #WealthMaximizer #WealthMaximizerPRO #WealthMazimizer #WealthPreserver Read the full article
0 notes
Text
Market Cap to GDP Ratio

#BearMarket #bearmarketprotection #DIA #DIATradeSignals #DowJonesMarketUpdate #DowJonesTradingSignals #DowJonesupdate #Nasdaq #NasdaqTradingSignals #QQQ #QQQTradeSignals #QQQTradingSignals #QQQTRADINGUPDATE #Russell2000 #Russell2000MarketUpdate #Russell2000TradingSigals #RUTTradeSignals #RUTTradingSignals #RUTTRADINGSTRATEGY #RUTTRADINGUPDATE #sp500etf #s&p500 #S&P500 #S&P500Index #S&P500MarketUpdate #S&P500TradingSignals #SPY #SPYTradeSignals #SPYTradingSignals #STANDARD&POORS500 #StockMarketBubble #StockTradingSignals #WealthMaximizer #WealthMaximizerPRO #WealthMazimizer #WealthPreserver Read the full article
0 notes
Text
The S&P 500 Dividend Yield Is Screaming

#BearMarket #bearmarketprotection #DIA #DIATradeSignals #DowJonesMarketUpdate #DowJonesTradingSignals #DowJonesupdate #Nasdaq #NasdaqTradingSignals #QQQ #QQQTradeSignals #QQQTradingSignals #QQQTRADINGUPDATE #Russell2000 #Russell2000MarketUpdate #Russell2000TradingSigals #RUTTradeSignals #RUTTradingSignals #RUTTRADINGSTRATEGY #RUTTRADINGUPDATE #sp500etf #s&p500 #S&P500 #S&P500Index #S&P500MarketUpdate #S&P500TradingSignals #SPY #SPYTradeSignals #SPYTradingSignals #STANDARD&POORS500 #StockMarketBubble #StockTradingSignals #WealthMaximizer #WealthMaximizerPRO #WealthMazimizer #WealthPreserver Read the full article
0 notes
Text
S&P500 P/E Ratio

#BearMarket #bearmarketprotection #DIA #DIATradeSignals #DowJonesMarketUpdate #DowJonesTradingSignals #DowJonesupdate #Nasdaq #NasdaqTradingSignals #QQQ #QQQTradeSignals #QQQTradingSignals #QQQTRADINGUPDATE #Russell2000 #Russell2000MarketUpdate #Russell2000TradingSigals #RUTTradeSignals #RUTTradingSignals #RUTTRADINGSTRATEGY #RUTTRADINGUPDATE #sp500etf #s&p500 #S&P500 #S&P500Index #S&P500MarketUpdate #S&P500TradingSignals #SPY #SPYTradeSignals #SPYTradingSignals #STANDARD&POORS500 #StockMarketBubble #StockTradingSignals #WealthMaximizer #WealthMaximizerPRO #WealthMazimizer #WealthPreserver Read the full article
0 notes