#RUTTradingSignals
Explore tagged Tumblr posts
Visit Tumblr Blog
Explore Tumblr blogs with no restrictions, modern design and the best experience.
Last Seen Tumblr Blogs


Fun Fact
Premium Tumblr themes are available from anywhere between $9 to $49.
Text
Markets Are Way Ahead Of Reality
If the 35% surge in the S&P in the past two months seems too good to be true as even hard-core optimists like JPM's Marko Kolanovic now admits, announcing that he is "dialing down" his optimism while Goldman sees little upside for stocks from here...

... it's probably because it is, as the latest Wall Street professional to join the chorus of naysayers and skeptics including such luminaries as David Tepper and Stanley Druckenmiller, claims. In an interview with the Financial Times, Manolo Falco, Citigroup's co-head of investment banking said that financial markets were "way ahead of reality" with tougher times to come, and is warning corporate clients that they should raise as much money as they could before the pandemic’s true cost is factored in by investors. "We definitely feel that the markets are way ahead of reality. We really are telling every client to tap the market if they can because we think the pricing now couldn’t get any better,” Falco said, adding that "as the second quarter comes along and we start seeing the pain, and the collateral effects of that, we think this is going to be much tougher than it looks."

Manolo Falco, Citigroup's co-head of investment banking. His comments came at the end of a week when stock markets largely rallied even as relations between the US and China just hit rock bottom, as riots were about to break out across the US which now has more than 40 million unemployed, and as millions of businesses around the world remained shut and economies lurched towards their worst recessions in memory. "Markets are pricing a V , everyone’s coming back to work, and this is going to be fine,” Mr Falco said. “I don’t think it’s going to be that easy quite frankly" said the investment banking icon who just made Robinhood's shitlist. Investors’ optimism led investment grade companies to raise a record $1 trillion of debt in the first five months of the year, putting investment banks such as Citi on course for a surge in debt capital markets revenues in the second quarter of the year compared with 2019.

Citi is not the only bank to take advantage of the bond issuance feast, which has been explicitly backstopped by the Fed which as we learned last week has been busy buying up over a dozen ETFs.

Last week senior bankers predicted another strong quarter for trading. This was especially true at JPMorgan Chase, whose investment bank boss Daniel Pinto said trading revenues in the second quarter could be up as much as 50% compared with a year earlier. Falco was more circumspect on the prospect of a wave of activist investment in the aftermath of the coronavirus crisis. Low asset prices can tempt activist investors to buy into companies on the cheap and then look for ways to make them more profitable, often by cutting costs and jobs, but mostly issuing more debt (although with corporate leverage now at even record-er levels than just 2 months ago it is unclear just who has the capacity for even more debt). "You gotta be careful though because an activist can become very quickly a focus of governments if they really step in too hard at a time when people, what they want is to protect employment and to actually get things going in the economy," Falco said. "We’ve got to be careful because in some cases . . . maybe those are at the wrong time and could create a lot of anger." We doubt that: in fact, if activist investors step up and end up causing millions more to be fired, it will simply mean that the government's free handouts will have to be extended even further, Congress will have to pass even more stimulus bills, and the Fed will have to monetize even more debt bringing us that much closer to the period of runaway inflation so eagerly sought by the Federal Reserve. In other words, more layoffs mean win, win, wins for everyone, except those who still believe in working hard and saving, of course. Read the full article
#BearMarket#CryptoTrading.#DowJonesTradeSignals#DowJonesupdate#forextrading#GoldTradingSignals#NasdaqTradingSignals#QQQ#QQQTradeSignals#QQQTradingSignals#RUTTradingSignals#S&P500Index#S&P500TradingSignals#SPYTradingSignals#StockTradingSignals#TradingStrategy#WealthMaximizer#WealthMaximizerPRO#WealthPreserver
0 notes
Text
Another Leg Down?

We have seen a hefty relief rally but does Another Leg Down loom? For those who are Wealth Maximizer Pro members, you have caught the nice profitable rally, contratulations. I am seeing some "disturbing" signs that the market is very close to re-testing the lows that we previously have made, or, will it form another leg down loom?. At the very least, it is 98% certain we will come to test the lows around 2250 at any moment in time. It is possible that we have another final leg down, and I believe that we likely will. It is important for you to remain patient instead of panic buying and falling into bull trap. During this last leg down, simultaneously, Gold and Silver will likely sell-off for liquidity reasons. People are now and will continue to liquidate their hidden savings. Here's why we know that the last leg down is coming: The VIX remains incredibly elevated (60+) despite big pops in the markets and has not subsided. This tells you another sell-off is looming. Whats more, it's supported by many other technical and fundamental factors. For the market to continue up and ignore these factors would be unprecedented. Prepare for another drop to the eventual bottom. Read the full article
#BearMarket#bearmarketprotection#CryptoTrading.#dowjones#DowJonesMarketUpdate#DowJonesTradeSignals#DowJonesTradingSignals#DowJonesupdate#QQQ#QQQTradeSignals#QQQTradingSignals#QQQTRADINGUPDATE#RetirementProtection#Russell2000#Russell2000MarketUpdate#Russell2000TradingSigals#RUT#RUT&SPYTRADINGUPDATE#RUTTradeSignals#RUTTradingSignals#RUTTRADINGSTRATEGY#RUTTRADINGUPDATE#sp500etf#s&p500#S&P500#S&P500Index#S&P500MarketUpdate#S&P500TradingSignals#SPY#SPYTradeSignals
0 notes
Text
Destructive Coronavirus Truth
The Destructive Coronavirus Truth is much more dangerous than the virus itself. No one has stated it more clearly that Mr. Celente in this video. We appreciate and value his Wealth Preserver Membership. You absolutely must watch every minute of this video as he is as animated as ever. He explains the who, what, why, where, and when of this whole mess. More importantly, he does not mince words of how its effecting the economy. Fortunately our members have been protected from this crash and are preparing the coming slingshot up. Holding the right investment will be vital and once this crash and slingshot back up is over, the real depression and 90% crash is coming. The Wealth Preserver will guide our members step by step through the future like a GPS system for your Investments and retirement accounts. Use the following promo code: Wealth25 Read the full article
#DIA#DowJonesMarketUpdate#Nasdaq#QQQ#QQQTradingSignals#RUTTradingSignals#S&P500#S&P500Index#SPYTradingSignals#StockMarketCrash#StockTradingSignals#TradeSignals#TradingStrategy#WealthMaximizerPRO#WealthPreserver
0 notes
Text
Is There Blood In The Street Yet?


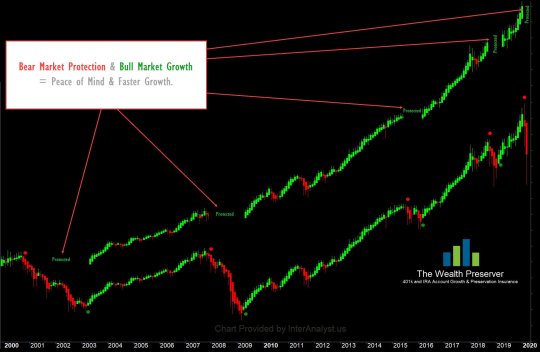
Baron Rothschild, an 18th-century British nobleman and member of the Rothschild banking family, is credited with saying that "the time to buy is when there's blood in the streets." The original quote is believed to be "Buy when there's blood in the streets, even if the blood is your own."Here is an image of today's Drudge Report...Based on the Drudge report, it certainly looks like someone is bleeding right now. Are we at the bottom though? All my neighbors are out walking for exercise or stress relief. What I do know is that I saw the same types of activities going on in late 2002 and 2008. Well because this is early 2020, let's hope to see it bottom soon and turn up. We expect a "Slingshot" to the upside with the same ferocity as it had to the downside. On February 18th, our daily trading charts issued a stock market exit signal. It was supported by our weekly sell signal that week, followed by our monthly Wealth Preserver that month.(Click on any image to maximize)Now that the Bear Market has come out of the woods to show itself, no one knew it would come with a unique flu called Caronavirus. This virus has certainly moved the bear into the psyche of our global economy. And by the looks of the Drudge Report, the bears cold has gotten worse. When will this Bear fever break? We will know within a few days of it bottoming and turning up. As Baron Von Rothschild knows, more blood is coming before the bear will be ready to hibernate again. Fortunately, we give entry signals just as we have for almost 30 years.These signals in the charts are real and have been followed by our member from further back than the chart illustrates. Each bar in the chart represents a month, all you need to do to visualize the power is to move the Green Signal up and over the prior Red Signal, and you can quickly realize how much farther ahead you would be. Here, let me do it for you: Read the full article
#DIA#DowJonesMarketUpdate#Nasdaq#QQQ#QQQTradingSignals#RUTTradingSignals#S&P500#S&P500Index#SPYTradingSignals#StockMarketCrash#StockTradingSignals#TradeSignals#TradingStrategy#WealthMaximizerPRO#WealthPreserver
0 notes
Text
Here's When The Stock Market Explodes Up
This is the Global Central Bank, Pension Fund, Retirement Account, and Stock Market Crash we warned was coming. It is here. As for a bottom? Keep in mind that we MUST go down first in order to clean it out and this then creates the bear trap as we saw back in 2009. It will turn when there is more "blood in the streets" and all three of our memberships pegged it and protected our Members. That is why our members have avoided 70% of this decline thus far and will likely avoid 95% of it before it turns up. The important point here is that they will reenter the market with as much money as they had in late February. And as the market turns and rallies off the bottom, the banks, brokerages, insurance companies and press will once again not believe it has turned because they will fear it will turn down again. To our Members, this current market action only reinforces long-term forecast. Now, with global interest rates at, or near, zero, bonds will soon become the place to leave. Where will that money go? Eventually, the only place for capital to shift to will be US Equities. Specifically, these will be in a slingshot move up. Read the full article
#DIA#DowJonesMarketUpdate#Nasdaq#QQQ#QQQTradingSignals#RUTTradingSignals#S&P500#S&P500Index#SPYTradingSignals#StockMarketCrash#StockTradingSignals#TradeSignals#TradingStrategy#WealthMaximizerPRO#WealthPreserver
0 notes
Text
Are We Close To The Bottom Of This Crash?

Livio, As a member and reading your member blog posts I was amazed how precise your exit signal was on February 18th. I just have one simple question. Are we close to the bottom of this crash yet? Paul, Toronto Good Question Paul. The simple answer is that question is only God knows the exact day, hour, and precise number is the bottom on the Dow or S&P 500. However, we have guideline to give us the general idea. which I will cover shortly. Before I cover "todays" chart, the next section is a review of one of our members posts and chart from 2 days ago: Trend-lines, also known as bounding lines, are lines drawn on a stock chart that connect two or more price points. Since stock prices tend to trend, trend-lines that connect the highs or lows in the stock's price history can help identify the current trend and predict what the stock price might do in the future. The markets are based on TIME and PRICE. So in time the bottom moves along the final green trend line. X axis is time, Y axis is price. The axis is the bottom of all the prior closings in time (trend line) in the price. That is why the green line is at the bottom of the rising price trend. In our current chart above you can clearly see when parallel market lines of prior bull runs have a retracement or Bear Market there is always possible turning point. One possible turning point is a right before a Fib/Phi level of a 28% decline at 2477.92. So until then I will not trust the validity of any counter trend bullish rally. NOTICE: If it breaks the trendline just take a look at where the market could head using history as your confirmation. Ouch. Thank goodness the Wealth Preserver protected you.That post was then and this is for today and when and where the bottom comes, lets look at the following chart. To make it clear, I offered precise trading ranges to help you assess when and where the bottom arrives. Remember that price changes with time and that is why ranges are used because as time moves forward the range in the area automatically changes. I have colored and commented each colored area in the chart for clarity and ease of understanding. As the Daily, Weekly, and Monthly trade signals become available in your members area, you will precisely know when the bottom arrives in both time and price. Ciao for now. Members can login here to view the balance of this information and the actual trade signals. Read the full article
#DIA#DowJonesMarketUpdate#Nasdaq#QQQ#QQQTradingSignals#RUTTradingSignals#S&P500#S&P500Index#SPYTradingSignals#StockMarketCrash#StockTradingSignals#TradeSignals#TradingStrategy#WealthMaximizerPRO#WealthPreserver
0 notes
Text
A 100% Legal Insider Trading System

A 100% Legal Insider Trading System is legal is because directors are allowed to purchase and sell shares in their companies provided they do so in a timely manner and disclose their transactions with the SEC. It would make sense that company directors are best placed to evaluate the value of their businesses so the insider trading anomaly has been a fruitful line of inquiry for many researchers over the years. In 1976, a paper from Finnerty concluded that increased insider purchases led to excess returns of 4.6% in the first six months while insider sales led to excess returns of -2.4%. In more recent research from Jeng, the authors found that sales did not produce any meaningful results but insider purchases led to annual excess returns of as much as 11.2% over the S&P 500. However, subsequent research from the Handbook of Equity Anomalies used the same methodology and produced annual returns that were nearly 7% lower between 1978-2005. Nevertheless, the anomaly still shows grounds for development particularly in smaller cap stocks that are out of the realm of big firms. In one study from the same book mentioned above, small cap stocks that had seen intensive insider purchases produced excess returns of around 5% in the first month, with most of those coming in the first 10 days. This is illustrated in the following chart taken from the book:

Most of the return from insider trading comes in the first 10 days. Src: The Handbook of Equity Anomalies. Wiley. The Insider Trading Trading System & Strategy There are a number of online resources you can use to track insider trading such as Insider Monkey and SEC filings. You can then go long small cap stocks with strong insider purchases. You need to be quick as most of the return comes in the first few days. Have fun. Read the full article
#BitcoinTradingSignals#CommodityTradingSignals#CryptoTrading.#forextrading#GoldTradingSignals#QQQTradingSignals#RUTTradingSignals#SilverTradeSignals#SPYTradingSignals#StockTradingSignals#TradeSignals#TradingStrategy
0 notes
Text
InsidersPower Newsletter - March 2020

The InsidersPower Newsletter is ready to be viewed along with your Monthly, Weekly, and Daily charts with trade signals. The stock markets around the world have been impacted dramatically and the InterAnalyst system has produced many trade signals across all industries and countries. Log in now to read the entire newsletter and the last section to learn precisely how to get your accounts right back to where they were before this "flash crash".Free 7 Day Trials Here Read the full article
#DIA#DowJonesMarketUpdate#Nasdaq#QQQ#QQQTradingSignals#RUTTradingSignals#S&P500#S&P500Index#SPYTradingSignals#StockMarketCrash#StockTradingSignals#TradeSignals#TradingStrategy#WealthMaximizerPRO#WealthPreserver
0 notes
Text
Velocity Of Financial Collapse
Read the full article
#BearMarket#CryptoTrading.#DowJonesTradeSignals#DowJonesupdate#forextrading#Gold#GoldTradingSignals#NasdaqTradingSignals#QQQ#QQQTradeSignals#QQQTradingSignals#RUTTradingSignals#S&P500Index#S&P500TradingSignals#Silver#SilverTradeCharts#SilverTradeSignals#SPYTradingSignals#StockTradingSignals#TradingStrategy#WealthMaximizer#WealthMaximizerPRO#WealthPreserver
0 notes
Text
Market Support Is Deteriorating Fast
Read the full article
#BearMarket#CryptoTrading.#DowJonesTradeSignals#DowJonesupdate#forextrading#GoldTradingSignals#NasdaqTradingSignals#QQQ#QQQTradeSignals#QQQTradingSignals#RUTTradingSignals#S&P500Index#S&P500TradingSignals#SPYTradingSignals#StockTradingSignals#TradingStrategy#WealthMaximizer#WealthMaximizerPRO#WealthPreserver
0 notes
Text
June 2020 InsidersPower Newsletter & Trade Signals
Read the full article
#DIA#DowJonesMarketUpdate#Nasdaq#QQQ#QQQTradingSignals#RUTTradingSignals#S&P500#S&P500Index#SPYTradingSignals#StockMarketCrash#StockTradingSignals#TradeSignals#TradingStrategy#WealthMaximizerPRO#WealthPreserver
0 notes
Text
3 Up Gaps That Must Fill
Read the full article
#BearMarket#DIATradeSignals#DowJonesTradeSignals#DowJonesTradingSignals#DowJonesupdate#Economy#ETFTrading#InterAnalyst#MarketCrash#MarketUpdate#NasdaqTradingSignals#QQQTradeSignals#QQQTradingSignals#RetirementProtection#Russell2000MarketUpdate#Russell2000TradingSigals#RUT&SPYTRADINGUPDATE#RUTTradeSignals#RUTTradingSignals#RUTTRADINGUPDATE#S&P500TradingSignals#SPYTradeSignals#SPYTradingSignals#STANDARD&POORS500#StockMarketBubble#StockMarketCrash#StockTrading#StockTradingSignals#TheWealthMaximizer#TheWealthMaximizerPro
0 notes
Text
P/E Ratio: The Over/Under Value Market Indicator
Read the full article
#BearMarket#bearmarketprotection#DowJonesMarketUpdate#DowJonesTradeSignals#InterAnalyst#NasdaqTradingSignals#QQQTradingSignals#Russell2000TradingSigals#RUTTradingSignals#S&P500Index#S&P500TradingSignals#SilverTradeSignals#SPYTradingSignals#StockMarketBubble#StockMarketCorrection#StockMarketCrash#StockMarketCrashIndex#StockMarketTiming#StockTradingSignals#WealthMaximizer#WealthMaximizerPRO#WealthMazimizer#WealthPreserver
0 notes
Text
The P/E Ratio Is Screaming At You
Read the full article
#BearMarket#bearmarketprotection#DowJonesMarketUpdate#DowJonesTradeSignals#InterAnalyst#NasdaqTradingSignals#QQQTradingSignals#Russell2000TradingSigals#RUTTradingSignals#S&P500Index#S&P500TradingSignals#SilverTradeSignals#SPYTradingSignals#StockMarketBubble#StockMarketCorrection#StockMarketCrash#StockMarketCrashIndex#StockMarketTiming#StockTradingSignals#WealthMaximizer#WealthMaximizerPRO#WealthMazimizer#WealthPreserver
0 notes