#Learn data visualization
Explore tagged Tumblr posts
Visit Tumblr Blog
Explore Tumblr blogs with no restrictions, modern design and the best experience.
Last Seen Tumblr Blogs


Fun Fact
Tumblr has 4 main sources of revenue.
Text
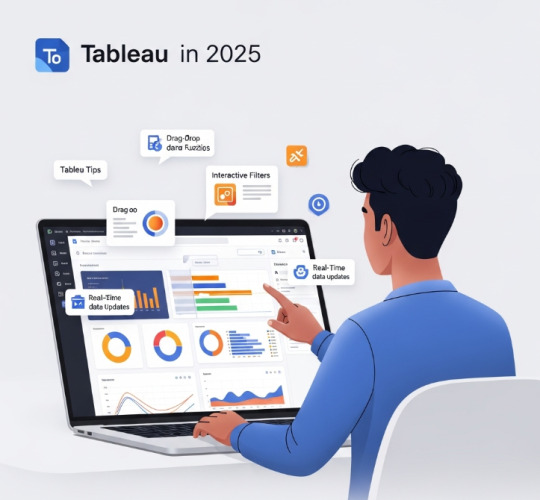
📊 Want to Learn Tableau in 2025? Here’s the No-Fluff Beginner’s Guide
Let’s be real — data is everywhere now. But knowing how to show it? That’s a whole different skill. 💡
Whether you’re new to data or just trying to upgrade your resume, Tableau is one of the most in-demand tools right now for building dashboards, charts, and real-time insights that actually make sense.
This guide takes you from clueless to confident, even if you’ve never used a data tool before: 🔗 2025’s Ultimate Tableau Guide: How to Become a Data Visualization Expert from Scratch
Perfect for students, analysts, marketers, freelancers — or anyone who wants to turn data into stories.
#Tableau tutorial#Learn data visualization#Data analytics tools#Tableau beginners guide#Visual storytelling with data#EdTech 2025#Career skills 2025#Tech for learners#Data dashboards#Analytics made easy
0 notes
Text
#free gaza#free palestine#gaza#palestine#from the river to the sea palestine will be free#pray for palestine#visual learning#visual learner#graphs#data#social media#journalism#narrative#story#keep speaking out#speak up#israel#ceasefire#america#usa
138 notes
·
View notes
Text
Coursera - Data Analysis and Interpretation Specialization
I have chosen Mars Craters for my research dataset! Research question: How Do Crater Size and Depth Influence Ejecta Morphology in Mars Crater Data?
Topic 2: How Do Crater Size and Depth Influence Ejecta Morphology and the Number of Ejecta Layers in Martian Impact Craters?
Abstract of the study:
Ejecta morphology offers a window into the impact processes and surface properties of planetary bodies. This study leverages a high-resolution Mars crater dataset comprising over 44,000 entries among 380k entries with classified ejecta morphologies, focusing on how crater diameter and depth influence ejecta type. Crater size and rim-to-floor depth are examined whether they serve as reliable predictors of ejecta morphology complexity. Using statistical methods, we assess the relationship between crater dimensions and the occurrence of specific ejecta morphologies and number of layers.
Research Papers Referred:
Nadine G. Barlow., "Martian impact crater ejecta morphologies as indicators of the distribution of subsurface volatiles"
R. H. Hoover1 , S. J. Robbins , N. E. Putzig, J. D. Riggs, and B. M. Hynek. "Insight Into Formation Processes of Layered Ejecta Craters onMars From Thermophysical Observations"
2 notes
·
View notes
Text
So, my math(s) class has this tradition that "anda" the panda announces the first person to do the the homework could anyone please make a presentation / animation of anda giving a blank picture a medal or anything please, please send anything to [email protected] also, here are pictures of anda you don't need to use the pictures so you can draw anda if you want:
#math#mathematics#mathblr#maths#animation#animated math#gif request#animation request#creative coding#math art#generative art#geometry#data visualization#calculus#algebra#stem#education#learn math#math help#tumblr animation
3 notes
·
View notes
Text
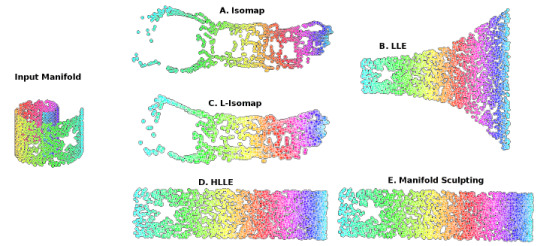
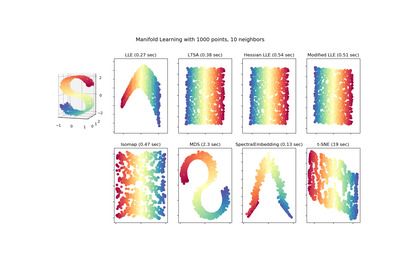
Locally Linear Embedding (LLE) approaches
#gradschool#light academia#data visualization#science#math#mathblr#studybrl#machine learning#ai#python#topology
46 notes
·
View notes
Note
blood donating experiences/wisdom for your followers:
-if the bag isn't filled a certain amount like 15 minutes in then they stop the draw because the clotting stuff in the bag won't work right (was dehydrated and they used my weaker vein)
-menstrual cramps and post-blood donation is a really bad time. I saw spots and puked and fainted and had to sign a waiver because I didn't want them to call an ambulance
-a dedicated blood donor center is kept pretty cold. Trying to recover from donation when it's warm is also a really bad time (Texas summer afternoon sunshine) BUT most places have those cool instant ice packs that you snap to activate
-ideally they'll have TVs playing a cooking show otherwise use your free hand to explore the internet
-there are actually lots of little in-chair exercises you can do while donating to help prevent those post-donation episodes! Lots of flexing and stretching of your leg muscles, and most clinics have a handout explaining the exercises
-nutter butters are the elite choice of post-donation snack AND red powerade if they have it
-for all the kinda scary things I just said I'm still a regular donor (O pos!) and really proud to have donated a lot of blood in my life and would highly recommend it to anyone able to do so. I've only had post-donation incidents a handful of times, and the most important things you can do to prevent that are to hydrate aggressively and eat a good meal before you donate.
Thank you for sharing such great insight!! Blood donors are literally the lifeblood of healthcare!
I have never needed a transfusion, but I'm so glad so many step up to make sure there's supplies for everyone's first (or umpteenth) transfusion. ❤️ Looking forward to when I'm well enough to donate myself! Luckily I'm not barred forever, I just need to reach a point where I don't have antibody activity (maybe will happen, maybe not).
And YEAH nutter butters are the elite choice of snack in most situations!!!
#Creepy chatter#For now I am okay being sampled bc I'm a little weird body#Honestly looking forward to the next Vanderbilt call asking if they can study whatever else is happening lmao...#They invited me to a sjogrens study but since I didn't have severe dry eyes I didn't want to clog their data#They're doing some sort of research on how sjogrens antibodies dry mucus membranes on the eye#Very funny to learn I have clinically measurable poo brain during the brain fog study#My visual recall was too strong to not be an outlier but my auditory was worse than some 60 yr old subjects#The researcher's words when walking to the cafe w me: lol well you BOMBED the auditory
12 notes
·
View notes
Text

An update to the famous HOG map
#map#geography#agriculture#hog#pig farming#data visualization#mapsontheweb#nemfrog#my art#my maps#niche postin#I have arcgis pro on my work computer and i've been really enjoying making maps when its slow the past nine months#lobster's adventures#i think its an interesting comparison. makes the shift from small farms to industrial farms very obvious#that one random county in Utah there's a big smithfield company farm#its by county btw im pretty sure the original map is also by county. realistically its the smallest unit you can get data on#also learned that USDA lets farms ask for their data not to be public#so when I used just one year there were big gaps. so i had to backfill certain counties from the most recent year data was available
8 notes
·
View notes
Text
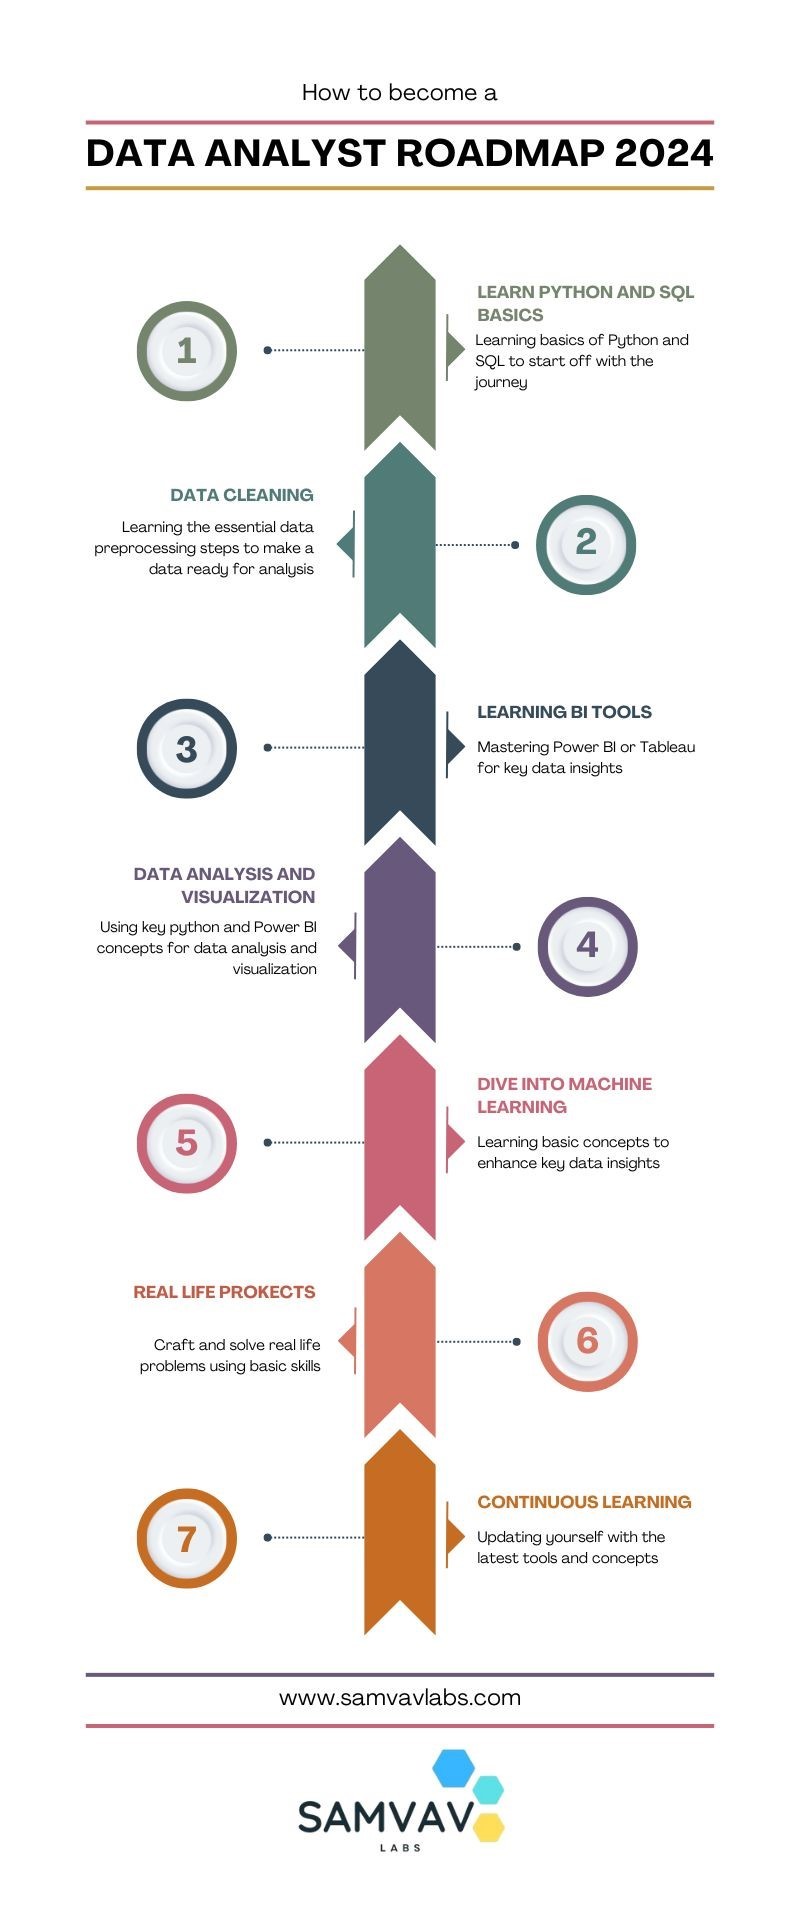
Data Analyst Roadmap for 2024!
Cracking the Data Analyst Roadmap for 2024! Kick off your journey by mastering and delving into Python for data manipulation magic, and dazzle stakeholders with insights using PowerBi or Tableau. Don't forget, that SQL proficiency and hands-on projects refine your skillset, but never overlook the importance of effective communication and problem-solving. Are you checking off these milestones on your path to success? 📌 For more details, visit our website: https://www.samvavlabs.com . . . #DataAnalyst2024 #CareerGrowth #roadmap #DataAnalyst #samvavlabs #roadmap2024 #dataanalystroadmap #datavisualization
#business analytics#data analytics#data analyst#machinelearning#data visualization#datascience#deep learning#data analyst training#dataanalystcourseinKolkata#data analyst certification#data analyst course#data science course#business analyst
12 notes
·
View notes
Text
The Skills I Acquired on My Path to Becoming a Data Scientist
Data science has emerged as one of the most sought-after fields in recent years, and my journey into this exciting discipline has been nothing short of transformative. As someone with a deep curiosity for extracting insights from data, I was naturally drawn to the world of data science. In this blog post, I will share the skills I acquired on my path to becoming a data scientist, highlighting the importance of a diverse skill set in this field.
The Foundation — Mathematics and Statistics
At the core of data science lies a strong foundation in mathematics and statistics. Concepts such as probability, linear algebra, and statistical inference form the building blocks of data analysis and modeling. Understanding these principles is crucial for making informed decisions and drawing meaningful conclusions from data. Throughout my learning journey, I immersed myself in these mathematical concepts, applying them to real-world problems and honing my analytical skills.
Programming Proficiency
Proficiency in programming languages like Python or R is indispensable for a data scientist. These languages provide the tools and frameworks necessary for data manipulation, analysis, and modeling. I embarked on a journey to learn these languages, starting with the basics and gradually advancing to more complex concepts. Writing efficient and elegant code became second nature to me, enabling me to tackle large datasets and build sophisticated models.
Data Handling and Preprocessing
Working with real-world data is often messy and requires careful handling and preprocessing. This involves techniques such as data cleaning, transformation, and feature engineering. I gained valuable experience in navigating the intricacies of data preprocessing, learning how to deal with missing values, outliers, and inconsistent data formats. These skills allowed me to extract valuable insights from raw data and lay the groundwork for subsequent analysis.
Data Visualization and Communication
Data visualization plays a pivotal role in conveying insights to stakeholders and decision-makers. I realized the power of effective visualizations in telling compelling stories and making complex information accessible. I explored various tools and libraries, such as Matplotlib and Tableau, to create visually appealing and informative visualizations. Sharing these visualizations with others enhanced my ability to communicate data-driven insights effectively.

Machine Learning and Predictive Modeling
Machine learning is a cornerstone of data science, enabling us to build predictive models and make data-driven predictions. I delved into the realm of supervised and unsupervised learning, exploring algorithms such as linear regression, decision trees, and clustering techniques. Through hands-on projects, I gained practical experience in building models, fine-tuning their parameters, and evaluating their performance.
Database Management and SQL
Data science often involves working with large datasets stored in databases. Understanding database management and SQL (Structured Query Language) is essential for extracting valuable information from these repositories. I embarked on a journey to learn SQL, mastering the art of querying databases, joining tables, and aggregating data. These skills allowed me to harness the power of databases and efficiently retrieve the data required for analysis.

Domain Knowledge and Specialization
While technical skills are crucial, domain knowledge adds a unique dimension to data science projects. By specializing in specific industries or domains, data scientists can better understand the context and nuances of the problems they are solving. I explored various domains and acquired specialized knowledge, whether it be healthcare, finance, or marketing. This expertise complemented my technical skills, enabling me to provide insights that were not only data-driven but also tailored to the specific industry.
Soft Skills — Communication and Problem-Solving
In addition to technical skills, soft skills play a vital role in the success of a data scientist. Effective communication allows us to articulate complex ideas and findings to non-technical stakeholders, bridging the gap between data science and business. Problem-solving skills help us navigate challenges and find innovative solutions in a rapidly evolving field. Throughout my journey, I honed these skills, collaborating with teams, presenting findings, and adapting my approach to different audiences.
Continuous Learning and Adaptation
Data science is a field that is constantly evolving, with new tools, technologies, and trends emerging regularly. To stay at the forefront of this ever-changing landscape, continuous learning is essential. I dedicated myself to staying updated by following industry blogs, attending conferences, and participating in courses. This commitment to lifelong learning allowed me to adapt to new challenges, acquire new skills, and remain competitive in the field.
In conclusion, the journey to becoming a data scientist is an exciting and dynamic one, requiring a diverse set of skills. From mathematics and programming to data handling and communication, each skill plays a crucial role in unlocking the potential of data. Aspiring data scientists should embrace this multidimensional nature of the field and embark on their own learning journey. If you want to learn more about Data science, I highly recommend that you contact ACTE Technologies because they offer Data Science courses and job placement opportunities. Experienced teachers can help you learn better. You can find these services both online and offline. Take things step by step and consider enrolling in a course if you’re interested. By acquiring these skills and continuously adapting to new developments, they can make a meaningful impact in the world of data science.
#data science#data visualization#education#information#technology#machine learning#database#sql#predictive analytics#r programming#python#big data#statistics
15 notes
·
View notes
Text
Online Data Science Courses
IIM Skills offers a variety of online data science courses designed to develop essential skills for the field. The course cover various topics statistics, machine learning, data visualization, and Python programming. The courses is designed in such a manner that a learner gets a theoretical knowledge and also a practical applications, often including hands-on projects. IIM Skills also emphasizes career support and mentorship, making it a suitable choice for both beginners and those looking to enhance their data science expertise.
2 notes
·
View notes
Text
From Zero to Hero: Mastering Data Analytics for Transformation
The concept of "data" has enormous significance in the modern digital world. The enormous amount of information produced every day has revolutionized the way we view the world and move through it. The data analytics industry is one of the major players in this revolution. Let's set out on an adventure to discover the fundamentals of data analytics, consider their importance, and understand how they affect different facets of our lives.
Understanding Data Analytics Analyzing massive data sets to find hidden patterns, correlations, trends, and insights is at the heart of data analytics. It's like sorting through a gold mine of knowledge to find the gold nuggets that will help you make decisions and solve problems. Data analytics isn't just about statistics and figures; it's about turning raw data into compelling narratives that encourage informed decisions.
Why Data Analysis Is Important
The capacity to make sense of all the data in the globe has changed the game. Data analytics enables companies, groups, and people to comprehend their operations, clients, and environments more thoroughly. Here are a few main arguments in favor of data analytics:
Making Informed Decisions: Data-driven insights allow for more precise and knowledgeable decision-making. Companies might modify their tactics in light of current developments and customer preferences.
Enhanced Efficiency: Data analytics uncovers bottlenecks and inefficiencies in processes and operations, allowing for focused changes.
Predictive Skills: By analyzing past data, predictive models can predict future patterns and aid organizations in becoming ready for the future.
Customer insights: Data analytics reveals the preferences and habits of customers, enabling more individualized interactions and higher levels of customer satisfaction.
Risk Management: Identifying potential risks and fraud patterns is made easier with data analytics, reducing vulnerabilities and losses.
Scientific Discoveries: In fields like healthcare and research, data analytics aids in uncovering groundbreaking insights and advancements.
The Data Analytics Process

Data analytics involves a systematic approach that follows several key steps:
Defining Objectives: Clearly state the objectives and issues you hope to resolve through data analysis.
Data Collection: Collect pertinent data from a variety of sources, making sure it is reliable and representative. Data Cleaning: Involves altering it to ensure accurate analysis.
Exploratory Analysis: Investigate the data in depth to find patterns, trends, and early insights.
Modeling: Building statistical models or algorithms to forecast outcomes or comprehend correlations in the data is known as modeling.
Interpretation: Draw conclusions from your analysis's findings and connect them to your original goals.
Visualization: To make your findings easier to understand, present them using visual tools like charts, graphs, and dashboards.
Action: Implement the learnings from data analysis to inspire positive changes and actions.
Data analytics has become an effective means for turning data into useful insights. By bridging the gap between information overload and useful knowledge, it facilitates decision-making, ignites innovation, and opens doors. A fascinating and fruitful trip may be had by anyone interested in learning more about data analytics, whether they are a business owner, researcher, or just curious. So, take part in uncovering the secrets of the data and grasp the power of data analytics to transform. If you need help implementing data analytics in your organization or if you want to learn more, you should consult professionals or sign up for specialized courses. For instance, the ACTE Institute offers comprehensive data analytics training courses that can provide you the knowledge and skills you need.
7 notes
·
View notes
Text
Top 5 Benefits of Low-Code/No-Code BI Solutions
Low-code/no-code Business Intelligence (BI) solutions offer a paradigm shift in analytics, providing organizations with five key benefits. Firstly, rapid development and deployment empower businesses to swiftly adapt to changing needs. Secondly, these solutions enhance collaboration by enabling non-technical users to contribute to BI processes. Thirdly, cost-effectiveness arises from reduced reliance on IT resources and streamlined development cycles. Fourthly, accessibility improves as these platforms democratize data insights, making BI available to a broader audience. Lastly, agility is heightened, allowing organizations to respond promptly to market dynamics. Low-code/no-code BI solutions thus deliver efficiency, collaboration, cost savings, accessibility, and agility in the analytics landscape.
#newfangled#polusai#etl#nlp#data democratization#business data#big data#ai to generate dashboard#business dashboard#bi report#generativeai#business intelligence tool#artificialintelligence#machine learning#no code#data analytics#data visualization#zero coding
3 notes
·
View notes
Text
Understanding IHD with Data Science
Ischemic Heart Disease (IHD), more commonly recognized as coronary artery disease, is a profound health concern that stems from a decreased blood supply to the heart. Such a decrease is typically due to fatty deposits or plaques narrowing the coronary arteries. These arteries, as vital conduits delivering oxygen-rich blood to the heart, play a paramount role in ensuring the heart's efficient functioning. An obstruction or reduced flow within these arteries can usher in adverse outcomes, with heart attacks being the most dire. Given the gravity of IHD, the global medical community emphasizes the essence of early detection and prompt intervention to manage its repercussions effectively.
A New Age in Healthcare: Embracing Data Science
As we stand on the cusp of the fourth industrial revolution, technology's intertwining with every domain is evident. The healthcare sector is no exception. The integration of data science in healthcare is not merely an augmentation; it's a paradigm shift. Data science, with its vast array of tools and methodologies, is fostering new avenues to understand, diagnose, and even predict various health conditions long before they manifest pronounced symptoms.
Machine Learning: The Vanguard of Modern Medical Research
Among the myriad of tools under the vast umbrella of data science, Machine Learning (ML) shines exceptionally bright. An essential offshoot of artificial intelligence, ML capitalizes on algorithms and statistical models, granting computers the capability to process vast amounts of data and discern patterns without being explicitly programmed.
In the healthcare realm, the applications of ML are manifold. From predicting potential disease outbreaks based on global health data trends to optimizing patient flow in bustling hospitals, ML is progressively becoming a linchpin in medical operations. One of its most lauded applications, however, is its prowess in early disease prediction, and IHD detection stands as a testament to this.
Drawn to the immense potential ML holds, I ventured into a research project aimed at harnessing the RandomForestClassifier model's capabilities. Within the medical research sphere, this model is celebrated for its robustness and adaptability, making it a prime choice for my endeavor.
Deep Dive into the Findings
The results from the ML model were heartening. With an accuracy rate of 90%, the model’s prowess in discerning the presence of IHD based on an array of parameters was evident. Such a high accuracy rate is pivotal, considering the stakes at hand – the very health of a human heart. 9 times out of 10 the model is correct at its predictions.
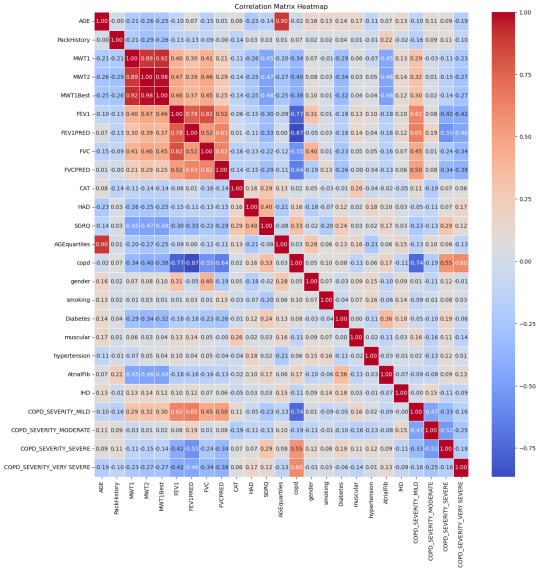
Breaking down the data, some correlations with IHD stood out prominently:
Moderate COPD (Chronic Obstructive Pulmonary Disease) – 15%: COPD's inclusion is noteworthy. While primarily a lung condition, its linkage with heart health has been a topic of numerous studies. A compromised respiratory system can inadvertently strain the heart, underscoring the interconnectedness of our bodily systems.
Diabetes – 18%: The correlation between diabetes and heart health isn't novel. Elevated blood sugar levels over extended periods can damage blood vessels, including the coronary arteries.
Age (segmented in quarterlies) – 15%: Age, as an immutable factor, plays a significant role. With age, several bodily systems gradually wear down, rendering individuals more susceptible to a plethora of conditions, IHD included.
Smoking habits – 14%: The deleterious effects of smoking on lung health are well-documented. However, its impact extends to the cardiovascular system, with nicotine and other chemicals adversely affecting heart functions.
MWT1 and MWT2 (indicators of physical endurance) – 13% and 14% respectively: Physical endurance and heart health share an intimate bond. These metrics, gauging one's physical stamina, can be precursors to potential heart-related anomalies.
Redefining Patient Care in the Machine Learning Era
Armed with these insights, healthcare can transcend its conventional boundaries. A deeper understanding of IHD's contributors empowers medical professionals to devise comprehensive care strategies that are both preventive and curative.
Moreover, the revelations from this study underscore the potential for proactive medical interventions. Instead of being reactive, waiting for symptoms to manifest, healthcare providers can now adopt a preventive stance. Patients exhibiting the highlighted risk factors can be placed under more meticulous observation, ensuring that potential IHD developments are nipped in the bud.
With the infusion of machine learning, healthcare is on the cusp of a personalized revolution. Gone are the days of one-size-fits-all medical approaches. Recognizing the uniqueness of each patient's health profile, machine learning models like the one employed in this study can pave the way for hyper-personalized care regimens.
As machine learning continues to entrench itself in healthcare, a future where disease predictions are accurate, interventions are timely, and patient care is unparalleled isn't merely a vision; it's an impending reality.
#heart disease#ihd#ischemic heart disease#programming#programmer#python#python programming#machine learning#data analysis#data science#data visualization#aicommunity#ai#artificial intelligence#medical research#medical technology
3 notes
·
View notes
Text
Data Analytics Courses in Ghana
#including data mining#statistical modeling#machine learning#data visualization.#real world case studies#internships to provide hands-on experience.#data science .#lucrative career in the era of data analytics
2 notes
·
View notes
Text
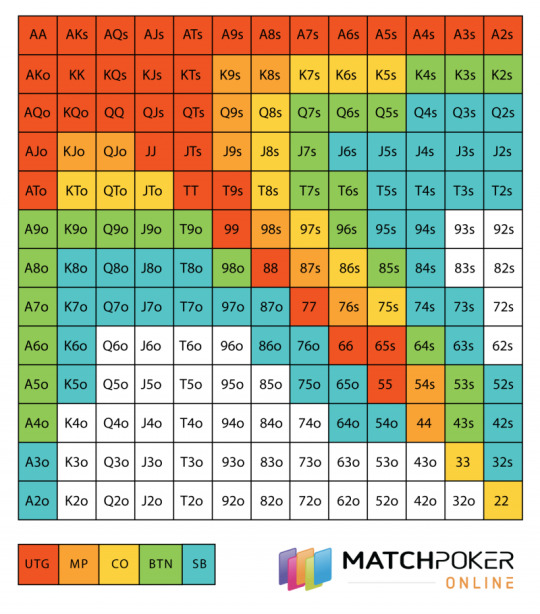


Data visualizations of poker and blackjack probabilities
#data visualization#information#probability#math#gambling#casino#blackjack#pokeronline#learning#statistics#dataviz
4 notes
·
View notes
Text

Learn to leverage Python, R, SQL, machine learning, statistics, data visualization (Tableau/Power BI), and big data platforms—through real-world projects that build your portfolio. Data science combines statistics, computing, and domain expertise to derive meaningful insights from complex datasets. With organizations across finance, healthcare, e-commerce, and manufacturing embracing AI, AutoML, NLP, and scalable analytics, demand for hands‑on data scientists continues to grow . Enroll now to master cutting-edge tools, explore real datasets, and steer impactful, data-driven innovation in one of today’s most dynamic tech domains.
#data science#python for data science#machine learning#data visualization#big data#ai data science#predictive analytics#statistics for data science#r for data science#data science programs
0 notes