#Quick Percentage Math
Explore tagged Tumblr posts
Visit Tumblr Blog
Explore Tumblr blogs with no restrictions, modern design and the best experience.
Last Seen Tumblr Blogs


Fun Fact
Mobile Tumblr US users spend an average of 4.04 minutes per session on the app.
Text
Percentage Calculator: Your Essential Tool for Solving Percentage-Based Problems
Calculating percentages is a vital skill used in various aspects of daily life, from solving math problems to making financial decisions. Whether you are trying to figure out discount percentages, understand interest rates, or determine percentage increases and decreases, a percentage calculator can save time and eliminate the guesswork.
In this comprehensive guide, we explain how percentage calculations work, provide examples, and showcase different types of percentage-based calculations. Use this guide to sharpen your math skills and make informed decisions in everyday situations.
What Is a Percentage? Understanding the Basics
A percentage represents a part of a whole, expressed as a fraction of 100. The word “percentage” is derived from the Latin term per centum, which means “by the hundred.” Percentages are often used in financial analysis, retail sales, taxation, population statistics, and much more.
For example:
50% means 50 out of 100.
25% means one-quarter of a whole.
100% represents the entire quantity.
Calculating percentages can sometimes seem tricky, but with the right formula and a reliable percentage calculator, it becomes a straightforward process.
How to Calculate Percentages: Key Formulas
There are three primary types of percentage problems that you may encounter:
1. Finding the Percentage of a Given Number
This is the most common type of percentage calculation. To find the percentage of any given number, use the following formula:
Percentage (%) = (Part / Whole) × 100
Example: If you want to find out what percentage 20 is of 200:
(20 / 200) × 100 = 10% So, 20 is 10% of 200.
2. Calculating the Percentage Increase or Decrease
This type of calculation is useful when you want to measure changes in values over time, such as price increases or salary adjustments.
Percentage Change = [(New Value – Old Value) / Old Value] × 100
Example (Percentage Increase): If your salary increases from $50,000 to $55,000:
[(55,000 – 50,000) / 50,000] × 100 = 10% This means your salary increased by 10%.
Example (Percentage Decrease): If a stock’s value drops from $150 to $120:
[(150 – 120) / 150] × 100 = 20% This indicates a 20% decrease in the stock’s value.
3. Finding the Original Number from a Percentage
In some cases, you may know the percentage and the resulting amount but need to calculate the original number.
Original Number = Part / (Percentage / 100)
Example: If 30% of a number is 90, what is the original number?
90 / (30 / 100) = 90 / 0.3 = 300 The original number is 300.
Practical Applications of Percentages
1. Shopping Discounts
Percentages are widely used in retail to calculate discounts and final prices. Imagine you see a pair of shoes that costs $100 with a 20% discount. To find out how much you’ll pay after the discount:
20% of $100 = (20 / 100) × 100 = $20
Final price = $100 – $20 = $80 So, you’ll pay $80 after the discount.
2. Financial Calculations: Interest Rates and Investments
In finance, percentages are critical for calculating interest rates, loan repayments, and investment returns. For example, if you invest $1,000 in a savings account with a 5% annual interest rate, your interest for the year will be:
5% of $1,000 = (5 / 100) × 1,000 = $50 After one year, your total balance will be $1,050.
3. Health and Fitness: Body Fat Percentage
Percentages are also used in health and fitness, particularly when measuring body fat percentage, calorie intake, and other vital metrics. Tracking percentage changes in body weight can help individuals monitor their progress toward fitness goals.
Why Use a Percentage Calculator?
A percentage calculator is a convenient tool that helps you perform percentage-based calculations quickly and accurately. Whether you are solving complex math problems or making everyday financial decisions, a percentage calculator can:
Save Time: Perform calculations in seconds without manual effort.
Reduce Errors: Eliminate the risk of making common percentage-related mistakes.
Enhance Productivity: Focus on analyzing the results instead of spending time crunching numbers.
Common Types of Percentage Calculators
Depending on your needs, you can use various types of percentage calculators, including:
1. Percentage Increase Calculator
Ideal for measuring growth over time, such as price hikes, salary increases, and population growth.
2. Percentage Decrease Calculator
Useful for tracking declines, such as stock price drops or reductions in monthly expenses.
3. Discount Calculator
Perfect for shoppers who want to determine final prices after applying discounts.
4. Tip Calculator
Helpful for calculating tips in restaurants. For example, if your bill is $50 and you want to leave a 15% tip:
15% of $50 = (15 / 100) × 50 = $7.50 So, you’ll leave a $7.50 tip.
5. Reverse Percentage Calculator
This tool helps you find the original number before a percentage was added or subtracted.
Tips for Mastering Percentage Calculations
To improve your understanding of percentages and become more proficient in solving percentage-based problems, follow these tips:
Practice Regularly: The more you practice, the more confident you’ll become in calculating percentages.
Use Real-Life Examples: Apply percentage calculations to real-life situations, such as shopping, budgeting, or investing.
Double-Check Your Work: Always review your calculations to ensure accuracy.
Leverage Online Tools: Use online percentage calculators for quick and reliable results.
Conclusion: Simplify Your Calculations with a Percentage Calculator
Understanding percentages is essential for making informed decisions in various aspects of life, from shopping and finance to fitness and beyond. By using a percentage calculator, you can solve percentage-based problems quickly, accurately, and effortlessly. Whether you’re calculating discounts, measuring percentage changes, or determining original values, this powerful tool can enhance your productivity and accuracy.
Mastering percentage calculations will not only improve your math skills but also give you greater confidence in handling numbers in real-world situations. Start using a percentage calculator today and take the guesswork out of percentage-based problems!
#Percentage Calculator#How to Calculate Percentages#Percentage Formula#Online Percentage Calculator#Percentage Increase and Decrease#Calculate Percentage of a Number#Percentage Change Formula#Reverse Percentage Calculation#What is a Percentage?#Math Percentage Calculation#Easy Percentage Tricks#Discount Percentage Calculator#Percentage in Daily Life#Financial Percentage Calculations#Quick Percentage Math#Percentage Problems and Solutions#Find Percentage Without a Calculator#Percentage Conversion Guide#How to Use a Percentage Calculator#Best Free Percentage Calculator
0 notes
Text

Source: Cracking the GRE Premium Edition with 6 Practice Tests, 2020 All the best to everyone for your upcoming exams
#GRE#GRE Math#Percentage#Decimal#Fraction#Math Equivalents#Study Tips#Memorization#GRE Prep#Friendly Fractions#Exam Strategy#GRE Quantitative#Percent-Decimal Conversion#Decimal-Fraction Conversion#Test Prep#GRE Success#Math Hacks#Quick Math#GRE Percentages#Simplified Math#Answer Elimination#Problem Solving#Test Day Tips#GRE Shortcuts#GRE Study Guide#Math Memory#Percent Conversions#Decimal Conversions#Fraction Conversions#Quantitative Reasoning
2 notes
·
View notes
Text
She didn’t get that sketch book back
Quick fic for my Biolizard shadow au taking place pre Ark incident, just some nice fluff between Maria and Shadow
Feel free to criticise the fuck outta this, haven’t written a fic since I was like 13, did feel nice to write this though, hopefully I can turn write a longer fic for the au like I said I wanted to do
Maria was beginning to get restless, it had been a long week full of tests, resting, recovering and just a general sense of stagnation. The days were beginning to phase into a repetitive cycle and while she could manage with it, she couldn’t say it wasn’t beginning to get boring.
Her studies were just finishing up, she had once again been bested by her least favourite subject, math. Maria was quite smart for her age, a symptom of being a Robotnik no doubt, however math had such a way with turning her brain to mush. She was sick enough as it was, she didn’t need the subject doing away with her mind too.
Her notebook and sticky notes were packed away in a cute little cubby adorably stuck with a tag with her name on it, next to hers was an empty cubby addressed with the name Shadow, it was unfortunate that with the monstrous hedgehogs seemingly unending growth spurts came the ability to not fit almost anywhere on the Ark, apart for his enclosure of course.
Maria put a hand to the unused cubby, she very much missed studying in the classroom with Shadow, but her grandfather did allow for studies to be taught with Shadow in the enclosure when they were both on best behaviour, the old man may be a stickler but was an absolute softie at heart.
Gerald was erasing the algebra on the blackboard with a content smile, Maria could see he was in quite a good mood today which was especially great as the week of tests wasn’t just unfortunate to her. As Shadow was due for many tests to check on the state of his growth, Gerald and his team spent many weeks trying to get it under control right after Shadow had begun to increase in size rapidly.
The scientists had all done their best but to an ailing Shadow, who had to be okay with needles and diagrams shoved in and around him, he was at best irate and at worst, down right hostile. One of the testing scientists was still recovering in the first aid section of the Ark after a particularly vexed Shadow struck out. He was “grounded” after such an incident, which doesn’t mean much when you’re 35 feet and can kill a person with minimal effort, but it meant Maria couldn’t see him at the moment.
That wasn’t gonna stop her from trying.
“Grandfather! Studies were absolutely wonderful today, I feel maths gets easier and easier each time you teach it to me” Maria lied. Her plan was to butter him up, get him in an even better mood, maybe then he would feel lenient enough to let her stay in the enclosure with Shadow.
“It makes me glad to hear that Maria my dear, maths has always been an essential subject matter in the world of education, why I’ve loved maths ever since I was a young tot, you know I solved my first problem when I was just 3 years old-“ Gerald kept on. Oh no, she got him rambling, maybe she could shoot her shot and just ask outright. The last time he rambled it put her right to sleep on her desk, it hurt his feelings but the second she started hearing percentages her brain shut it down.
“May I see Shadow today!?” She hadn’t meant to blurt it out so outright but she felt the ramble was about to edge towards fractions and decimals and she quite had enough of those today
Gerald’s animated ramblings stopped in an instant and he faced his granddaughter who was doing her best to charm him with her childish adorable appeal
He hummed and hawed for a moment before shaking his head “Now Maria I know you miss Shadow very much but he is in trouble at the moment”
A wave of defensiveness washed over Maria as she recounted Shadow was currently punished due to actions he did in a moment of stress and anger, she felt in the same position she would have struck out or at the very least gave that scientist a good old raspberry, she was still proud she taught Shadow that, Gerald didn’t need to know that though.
“Oh but Grandfather, it’s been more than a week, I’m sure Shadow has learned his lesson” Maria begged.
“He growled at one of our scientists who came for a check up this morning, one he particularly likes mind you” he retorted
“I mean it could be a bit of that teenage rebellion you’re always claiming me to have when I’m not happy to see you in the morning” She countered.
“I-“ Gerald stopped himself and put a finger to his lip, honestly he couldn’t dismiss that. As Shadow continued to grow he picked up more behaviours Gerald could attribute to the traditional development of adolescence. It still had him flabbergasted as he recalled Shadow sticking his tongue right at Gerald one time during studies.
“None the matter, I don’t want you getting hurt in there because of the irritation he’s at right now” Gerald commanded. Maria deflated, this definitely wasn’t going out the way she has planned.
“He would never! Shadow absolutely adores us, he wouldn’t hurt us” Maria argued, she trusted this 100%. Although around most people some could say Shadow could be careless, Maria and Gerald were of a select few that Shadow handled with the upmost care and caution. Maria could just about get away with doing anything around Shadow, if not for her sickness she would most definitely use the gigantic hedgehog as a playground.
At quiet times before lights were out, when allowed she would curl up in Shadows large claws, it amazed her how still and gentle he could be, she felt like a glass doll in his hands as she deducted he was so still in fear of jostling her. It saddened her that Shadow was at such a state he felt even the slightest movements would hurt her.
Gerald put a palm to his head, “I know he wouldn’t hurt you on purpose Maria, but Shadow can forget himself sometimes, need I remind you of Steven, who is in the infirmary because of Shadows actions?” He scolded. Maria didn’t have a retort for that, she could defend shadow as much as she liked but it didn’t change that he had indeed hurt someone.
She looked down to her dress skirt and gripped the fabric of it, she knew better than to act like a brat not getting their way but she was getting irate, one more plea, and if no results she would would back down, lest she get into an argument with her grandfather and end up in trouble herself.
“I’ve just felt absolutely restless. I understand he’s in trouble grandfather but he always behaves around me, I could even go in there and get him to apologise! He’s usually nicer after I give him a good talking to” Maria gripped her skirt harder, she was honest about getting him to apologise, she didn’t want him thinking what he had done to that scientist was okay.
Gerald studied her for a moment before letting out a defeated sign, the softie in him had won, he hated seeing Maria as desperate as she was, and she was not wrong. Maria’s presence seemed to greatly improve Shadows mood the most
“Fine, you can see him” Maria almost jumped up in excitement but steeled herself, it didn’t stop her from looking absolutely giddy “but you are not to rile him up in any way, and if I feel you are in danger you are to come out, understand” Gerald instructed.
Maria gave a silly salute, she couldn’t help it knowing her plan came around “loud and clear!”
——————————————————————
He was clearly pouting when she got to the viewing windows of Shadows enclosure, he was lying on his side and had his back to the large reinforced windows, so nobody could see his face. It was cute to Maria, he always did this getting in trouble.
He was also very still, she actually couldn’t tell if he was asleep or not in that position, a second later when he turned his head slightly to notice her presence confirmed he was indeed awake. Shadow had quite the ability to sense the people around him without anyone else knowing they were there. He glared at her before immediately curling in on himself, she had no idea how someone that big could make themselves look smaller but he was managing quite well.
She put her hands to the window, the glare he just gave her hadn’t put her off, he clearly wasn’t as happy to see her as she thought he would be but that was her gigantic, hedgehog, lizard buddy in need and she hadn’t almost got on her knees and begged to see him for nothing.
3 little taps to the glass, Maria did this just to give him a warning whenever she was coming in, in response Shadow seemed to curl further in on himself, he almost looked like a gigantic spiky ball.
Maria made a small trek down a compact set of Stairs to some steel doors that led into the enclosure, there was a code box right next to the doors that needed an input only Maria, Gerald and some trusted scientists knew. Quickly putting in 4 digits, her birthday as predictably done by her grandfather, Maria bounced in excitement as the doors painstakingly opened.
The chamber was quiet and smelled of lavender, Maria had recommended a calming smell might tide over Shadow to act nicer during testing, while it hadn’t, he still very much enjoyed the smell.
Maria encountered the big ball of black and red quills and scales, he was very much still pouting and didn’t seem to want to acknowledge her. She gave a couple pats to what she could assume was his tail but it was quite hard to tell as curled up as he was.
Shadow gave no response to indicate he felt the pats so she grabbed a few quills and gave a small tug, she didn’t want to tug hard as she’d definitely get cut if he bristled his quills in response, yet he still gave no reaction.
Oh he was really having quite the tantrum today. She put her hands to her hips and gave the giant wall of quills a tired look
“Shadow it’s me! Are you not happy to see me?” Maria yelled up at him.
If he was, he gave no reciprocation. It humbled her quite intensely as it was a first for Shadow to completely ignore her.
She looked down at her shoes and decided if he was gonna be the Debbie of downers she would use other means of entertainment. She pulled out her small sketch pad that conveniently fit in her skirt pockets. It was a great source of distraction when she had nothing to do or nobody to talk to.
She walked over to some worn down chairs that were placed carefully far to one end of the enclosure, they were initially placed there for observation of Shadow but it was an overestimated idea as most scientists didn’t have the nerve to be in the same room as Shadow for more than 5 minutes. Maria abused this section of the enclosure to benefit her creative devices and made Shadow the subject of most of her sketches.
It was about 5 minutes into drawing when she had stopped drawing Shadow as doodling a curled up spiky ball hadn’t been as fun as she thought. She looked up from her sketch pad as Shadow began to unfurl, as he stretched out she heard some of his bones crack back into place, bones cracking was already an unnerving sound to her, hearing it at Shadows size was something entirely else so she couldn’t help the look that came on her face.
Shadow stopped his stretching to study her, he smirked at the unsettled face Maria made as it was quite an amusing expression for her to pull, the smirked made her a little irate considering how rudely he was to ignore her just before.
“I see you got tired of pouting” Maria huffed, Shadow simply stuck her tongue at her, she gasped in shock and stook up immediately, absolutely aghast he would use such a move on her of all people, she kind of wish she hadn’t taught him that now.
“That’s absolutely- why I never- you are such a rude-“ she couldn’t make up her mind what to say in response. Shadow sat on his hind legs and looked at her in amusement, to anyone who could have been outside the enclosure, the sight of a young blond girl yelling and scolding the near 40 foot giant beast was bewildering.
“It’s no wonder grandfather didn’t want me to see you, with you acting like such a brat I have half a mind to walk out of here, are you even sorry for what you did?!” Maria furiously turned her back to him and folded her arms, if she looked back she would have seen Shadow flinch at the question. “The scientists are doing the best to help you and you had someone sent into first aid!” She grumbled.
Maria heard some loud shuffling then the room shook for a moment, she steadied herself and looked back to see Shadow had repositioned himself with his back to her. She didn’t know why the sight infuriated her more but it just seemed like he wanted to be insanely difficult today.
She began to march over to him, about to give him a peace of her mind. However when she traversed enough to get a even look at what she assumed would be a unremorseful smug smirk, she was met with a regretful furrowed brow, his red crimson irises met her blue azure ones and he instantly looked away and brought his arms up to hold himself. He wouldn’t look back at her.
Maria began to calm herself, one look at him told her what she knew, of course he felt bad for what he did. She wanted to give herself a right slap for forgetting herself, he obviously found it hard to talk about what happened, she shouldn’t have expected him to be right and ready to talk as soon as she walked through those doors.
She slowly came closer and put a hand to his ankle, that was as much as she could reach at his current sat up stance. He dared a glance down at her tiny form and again looked away, she could feel the giant begin to tremble, she then heard as an unmistakable voice rasped out “…didn’t mean to”.
His voice rumbled throughout her body as her heart wrenched at that statement. She believed it without question, he was gentle and caring, she was tired after the week long tests. Maria could only imagine what it was like for him after being poked and prodded for hours on end.
“I know” she comforted. She really did wish he was at least a little smaller, it was really hard to comfort someone who has a hand as big as your entire body.
She could attempt to climb up his leg but she really didn’t want to risk getting Gerald upset with her if she was to exacerbate her already strained lungs. She motioned at shadow with her hand and got his attention “Shadow your hand please” she gently commanded
He knew what she was asking and took a hand off his person to reach her, only seeing his claws near her had him stop for a moment which Maria noticed. “You would never hurt me” she assured. He gently scooped her up and cupped his other hand to the one holding her.
Shadow brought up a safely secured Maria up to his face in which she at once assaulted him with a full face hug, it surprised him for a moment but he instantly melted into it. She did this when she knew he was even a bit upset. He did find the gesture embarrassing but appreciated it all the same.
Maria nuzzled into his muzzle harder, she’d be finding fur in her dress for ages but she didn’t mind, the priority was Shadow. She was glad he was remorseful, it would have been alarming if she had to explain why it’s wrong to send someone into the infirmary but Shadow seemed to grasp the consequences of the event that transpired.
“You are going to apologise once Steven is out of the infirmary aren’t you?” She left his muzzle alone finally and looked up at him, he seemed embarrassed at such a request but knew he couldn’t argue with something that was the least he could do. He nodded firmly and hoped it would be enough to satisfy Maria.
It definitely was as she once again came full force with a hug to his muzzle, he did wish he could return such a gesture properly but he’d definitely crush the poor girl with such a return, instead he just leaned his face into her arms, she was such a tiny thing to him but the action warmed his heart so immensely he’d almost forgotten why he was mad in the first place.
Maria plopped back into his palm, content with her job as “the Shadow whisperer”, as she had oddly dubbed herself in her mind. She wished she could converse with him about all the events that transpired while he had been “grounded” but it mostly included tests which was the furthest thing she was sure both of them wanted to talk about. In that moment she remembered the little notepad she was doodling in earlier.
Shadow watched as she fought to relieve her pocket of the sketch pad and as she flicked through a few pages of quite nice and detailed drawings of him and a few familiar faces he’d seen on the Ark, his interested peaked as he watched her turn to her recent pages and she chortled, Maria shakily stood up on Shadows surprisingly soft palm and held the sketch pad to Shadow, who’s interested promptly died when he saw a drawing of a spiky ball which had been nicely detailed with an annotate to tell whoever was reading the ball was a “grumpy pouty shadow”.
Maria watched Shadows face fall flat and couldn’t help that roar of laughter that immediately escaped her, this only continued to irritate the humongous hedgehog. He brought over his other hand that didn’t have a laughing Maria in it and swiftly brought it over his palm, Maria yelled out a panicked “NO WAIT-“ as he did so. He didn’t hurt her, he just gave her a quick squish to shut her up. That seemed to do the job as he opened his palms to a silence Maria who had her hair adorably scruffy from the attack “I hate it when you do that, I totally deserved it though” she concluded
He snickered at that and she gave him a quick punch to his pinkie finger
——————————————————————
Maria had lost track of the time she had been in the enclosure after 2 hours. She wasn’t worried she’d been in too long as her Grandfather had cameras in the chamber and would have called her out if he wanted her out.
She had returned to her drawings while she was cradled in Shadows palms. She was absolutely engrossed in her current drawing and hadn’t noticed Shadow wasn’t giving input or feedback on her drawings anymore.
The palm she was in suddenly jerked and she had to grab one of his fingers to keep from losing balance, her sketch pad had fallen to the ground when the motion happened. She looked up when she was steadied and saw Shadow, he seemed to have not noticed what he had done. Honestly he seemed quite out of it, she quickly realised the poor thing was fighting sleep and must have accidentally jerked back to being half awake.
“Shadow” Maria called, his eyes opened fully to address her but immediately went back to being half lidded. “Are you tired? I can leave so you can get some rest” she offered.
He stubbornly shook his head and cupped his other hand under her, normally he would have let her go off when she wanted and went back to doing as he did alone in the enclosure but she was sure it was his sleepy brain not wanting her to leave and he was acting upon that.
“Alright alright, don’t have a fuss I’m not going anywhere, even if I could” he had brought his hand close enough that she could reach a particular spot under his muzzle, she gave it a few scritches and had to steel herself when he began purring, it was an intense and loud sound that she feel sending waves through her entire body but she bared it.
He leaned into it, and began to literally lean his entire body’s forward when the feeling of the scratches began to calm his already tired mind, Maria had to stop and immediately grabbed onto anything she could, which was his ring finger as Shadow fell forward, the enclosure shook from the weight of him falling and Maria waited for the vibrations to die down, she hoped her grandfather was not watching the cameras at that moment as she could of accidentally been hurt, she could hear and feel the vibrations of Shadows quiet snores as it confirmed he has simply fallen asleep.
She hopped off his palm to trek to his face, give him a quick hug. Her mission was to now find her sketch pad, that last drawing she was engrossed with had come along really well and she wanted to show her grandfather how her art skills were coming out. Her face turned grief stricken when she realised her sketch pad had fallen where Shadow lay asleep right now, if he rolled over which she knew he was guaranteed to do, it was completely over for that drawing as well as her entire sketch pad.
Maria inhaled and then exhaled. The stories of the superheroes her grandfather read to her had to go through sacrifice, and right now as the shadow whisperer, she could definitely say she was going through sacrifice right now.
#sonic#sonic the hedgehog#Biolizard shadow au#my art#my writing#shadow the Hedgehog#maria robotnik#fic 1k+
184 notes
·
View notes
Text
Owned Restaurant Profit Increase
Two versions to download:
-Double profit: SFS / GD
-Triple profit: SFS / GD
Choose only one version!
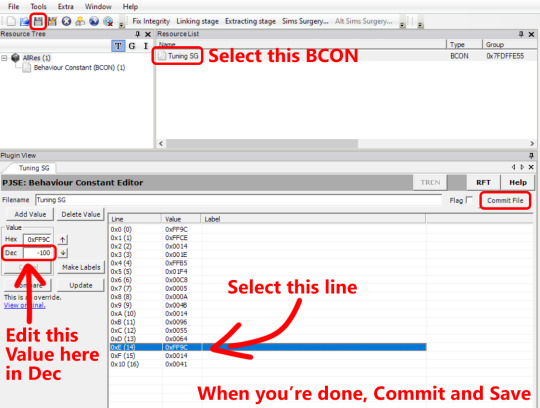
We all know how hard it is to maintain a restaurant business in The Sims 2, right? You barely make any money and, if you have some employees to get paid hourly, there's a good chance you'll even end up losing money. Well, once again I've been digging through the files for a while until I've found something to fix this issue. I have to say, this is not the ideal solution at all, but it still makes the business actually profitable, so I thought it might be worth sharing anyways. This tiny mod edits just one single BCON value, and it's super easy to tune to your liking! A lot of technical details, a tutorial on how to tune it, and a big testing research under the cut (bear with me please, I promise it's worth reading).
So the way an unmodded game moves money in a restaurant business goes like this: the moment your waiter puts the dish on the customer table, you get a small percentage of the price of the food deducted. Then, once the customer finishes eating, they pay you the full price of that food (based on how expensive or cheap you set your business). Simple enough, right? Ideally, the best solution would be increasing the price of the food, but no matter how hard I tried, I just couldn't find those values anywhere. So what's left on the equation? Yup, that small percentage you get deducted first. I was lucky enough to find that one, so changing it to a negative value means you actually get extra paid first. And that money comes from nowhere, the customer doesn't pay extra, they only pay the price of the actual food. That works for me!
As a quick example, in a new business with 0 stars, if you keep the default price on average, you always gain 28 simoleons for serving a bowl of Mac N Cheese. However, you also get deducted 4 simoleons first, so it's actually 24 simoleons per customer. That's just sad. The Double version of my mod makes it so you get 22 simoleons first, and then the customer pays those 28 simoleons. That's a total of 50 simoleons per customer. More than double the profit, not bad! The Triple version gives you a total of 71, pretty self explanatory. The numbers don’t match exactly with double or triple profits, but I didn’t want to spend that much time finding the exact value to make it exactly double or triple, you know, especially considering there might be other factors that affect your business income. I’m not that good at maths to be honest... orz
So how do you tune this? All you need is SimPe. Open the package, click on the BCON file and edit line number 14, on the Dec box. The default Maxis value was 20. I changed it to -100 to get roughly double the profit, and -200 to get triple profit. If you want to increase the profit even more, make sure you keep it negative when changing the value! Then just click Commit and Save. Done!
One extra note before I continue. The extra money you get with the mod does count for the balance you see on the UI menu for the business on the top right. So if you like to keep track of your income, the mod will take effect on those bars. However, it won’t count for things like the First Simoleon prize thingy. So for now I’m not really sure if this extra money would count for other things such as Lifetime Wants related to gaining money. I haven’t tested it that much.
Okay, now you know almost everything you need to know about this mod. If you want to read some ramblings on how I tested this, keep reading. Otherwise, you’re good to go!
So, let’s talk testing, because that’s something I actually enjoy doing. I built a simple restaurant lot, with about 5 tables available. The conditions were:
-3 Sims from my household to work as host, waiter and chef. No external employees, so I don’t need to keep track of extra salaries to pay.
-Schedule is roughly 15:00 - 22:00.
-New business level 0. Prices were kept at the default average.
-I didn’t use the Basic Sell interaction. If the customer didn’t want to eat at my restaurant, then so be it.
-The chef had 10 points of cooking skill, so I could add any food to the menu. However, I only chose one food to cook to keep the profit numbers as consistent as possible.
For the first case, I chose cooking only Mac N Cheese, a very cheap food that makes almost no money at all. It doesn’t require any cooking skill points. Mac N Cheese gives you 28 simoleons when the Sim pays. -In an unmodded game, you also lose 4 simoleons, so it’s 24 simoleons per customer. After running the business for the set schedule, I got 240 simoleons of profit. Pretty disappointing! If I had employees to pay, I would only have a few simoleons to spare, if any at all. -With my Double version of the mod, you get an extra 22 simoleons, making a total of 50 simoleons per customer. After running the business with the mod in, I got 400 simoleons. Not much, but hey, it’s something.
For the second case, I chose Filet Mignon. This food is pretty fancy, and it requires max cooking skill. Filet Mignon gives you 83 simoleons when the Sim pays. I also noticed the customers take way less time to eat it compared to the Mac N Cheese, so that’s an extra bonus to make the business run faster. -In an unmodded game, you also lose 13, so it’s 70 simoleons per customer. After running the business, I got 630 simoleons of profit. Not bad, but considering you need to max out the cooking skill, it’s almost insulting spending so many hours just to get that… -With my Double version of the mod, you get an extra 65 simoleons, making a total of 148 (!) simoleons per customer. After running the business with the mod in, I got 1036 simoleons. Okay, nooow we’re talking! That's the fancy restaurant status I like to see.
You might be wondering why these numbers are so inconsistent. Well, sometimes my lovely waiter decided to drop the tray on the customers, poor guy. That added to the randomness of how customers decide to enter the restaurant or not, and if the game sits more than one customer on the table or just one of them, if someone gets stuck for a while losing time… all of that can end up making the results a bit inconsistent. That being said, I had better luck when I was running the business without the mod in, yet I still got quite a lot more money with the mod in. I didn’t keep track of the numbers for the Triple version, but as you can probably guess, that one would be even more profitable.
One last case I wanted to test and compare: a completely different type of business, a games and entertainment one using the Bandatron ticket machine. In that scenario, I got 21 simoleons per customer, each hour. So after that schedule of 15:00 - 22:00, I got a total of 789 simoleons! All my sim did during those hours was bartending. That shows how easy it is to run a business with a ticket machine, and the biggest advantage is that you don’t have to pay employees if you don’t need them, and you don’t need any skills at all. Just plop down that machine, put some objects, relax and let the money flow by itself.
So yeah, in conclusion, Eaxis really messed up programming the restaurant businesses, there’s no doubt about it. Hopefully my mod helps balance things out. And if you think it's still too low on the incomes department, you can always tune it to your liking! As far as I know, this should not conflict with anything, but if you run into any issues, let me know and I’ll try my best to fix it asap.
Special thanks to EddySims for their fantastic HQ Icon Pack I used to make the preview pic! <3
#ts2 mod#sims 2 mod#can you tell i had a lot of fun making that preview pic#stonks moment#now i want to run a restaurant business hehe
553 notes
·
View notes
Text
some help — c. springer
content warnings: sfw! fluff, suggestive (allusions to sex), math, tired/horny drug dealer!connie
author’s note: save me hazel-eyed drug dealer…hazel-eyed drug dealer save me…😔

“are you gonna come to bed? like, at all?” you droned, letting the silky fabric of your robe droop off your shoulders and down to the crooks of your arms in half-exhaustion. “you’ve been counting that money for, like, two fuckin’ hours.”
your boyfriend, sat on your guys’ couch with a notepad in one hand and a wad of cash lazed haphazardly in the other, looked up from the seemingly trigonometric equations scrawled against the paper. the concentration that once burdened his brow softened at the sight of you, clad in lingerie that had been rendered almost useless by the amount of time he’d kept you waiting. “i know, i know. just a lotta numbers tonight.”
connie was usually an ace with numbers, something you came to realize (and greatly appreciate) when he’d actually completed an unfinished page of your trigonometry homework after you’d fallen asleep amid the eleventh question. “would a fresh set of eyes help?” you asked, heading for a spot on the couch, but connie’s legs immediately parted to make space for you on his lap.
the pretty hazel tone of his eyes fogged with tiredness, and all it took was a, “shittt, i mean, you can try.” before you were plopping onto his lap and retracting his mechanical pencil from behind his ear.
“okay, okay. let me see…” you murmured, “forty percent of ten thousand four hundred and twenty-two…” avoiding a math-induced headache, you skimmed over the calculation he did to find the percentage and skipped right down to the part covered in hastily scrawled question marks: ten thousand four hundred and twenty-two minus four thousand one hundred and sixty-eight.
it didn’t seem to be anything more than simple subtraction, and for a moment you thought he was pulling your leg, but a quick glance over to his visibly stumped face told you the complete opposite. “see, the paper says four thousand one-twenty, but i counted one-forty.”
upon further examination, which only took about five seconds, the root of connie’s issue seemed to be staring right in your face. “babe, you forgot to carry your one.”
his frown deepened, and then relaxed in understanding. “…oh,”
you felt his arm snuggle you closer into his body, and with that, makeshift contentment running through his chest in the form of a low grunt. “you know what you need?”
at the feeling of your acrylic nails gliding down the nape of his neck, his eyes off the notepad and onto you for a refreshing five seconds. “what?”
“some help.”
“help?” your face, contorted with puzzlement, morphed into one of playful realization when connie’s fingertips breached the hem of your robe.
“yeah,” connie softly groaned, punctuating it with a kiss to the corner of your lips. “gettin’ up outta this.”
#nikki writes ✶#connie springer x black reader#connie springer#attack on titan#attack on titan x black reader#attack on titan x you#aot x reader#aot x black reader#aot#aot connie#snk connie#snk fanfiction#attack on titan fanfiction#attack on titan fluff
412 notes
·
View notes
Text
the demeter
Ok actually? I'm *obsessed* with The Demeter Like being in Dracula's castle is it's own horror; you've entered the Evil Domaine
But on a ship?? Hello???
A) you're not alone. You've got a bunch of your sailor friends, and the captain, and the navigator, and you're British. Ignoring the horror of having to be British, you're protected by the most dangerous navy in the world. Fuck, you've probably been to India
B) this is a short journey. It's a quick stop shop type thing. And you're not transporting anything big or important, this isn't like. Spice. Or silk. It's just a bunch of weird boxes. Some rich guy is building a botanical garden. This is the least important thing you've done in YEARS.
C) you're alone, of course. Like. It's a ship full of friends but also. There's no radio, that's not invented yet. Your best bet for getting outside assistance is like.... Setting your ship on fire and hoping someone sees the smoke and comes to investigate and manages to rescue you before you either burn, suffocate, or drown. You can't swim. You're as alone as any modern astronaut. It doesn't matter what direction you face: there's just the water and the wind. You don't know which direction home is, but hopefully the navigator does
D) someone dies. Not uncommon. Between the scurvy, alcohol poisoning, malnutrition, infection rates, brawls, and other nonsense, some percentage of sailors are gonna die on every ship. Sorta embarrassing for someone to die so quickly, but it's fine. The dead guy looks weird, but it's fine
E) someone else dies
F) someone else dies
G) someone else dies
H) it's your turn to work at night. You don't want to be the next one.
I) someone else dies
J) there's a storm. You're scared. Sailors are a superstitious lot, but people are praying a lot more than usual. Someone's hands are shaking. Someone died last night, and someone will be dead tomorrow
K) you start doing math. Basic math. How many sailors on the ship? How many days until the ship docks? Is there gonna be anyone left? Is the ship just going to float, full of dead bodies, until it capsizes on something and sinks?
L) maybe it would be better to capsize now. On purpose. Bring whatever is haunting them down to the bottom with them rather than bring it to England.
M) maybe the daily funerals are just kinda getting to you. With more dead, your food portions are bigger, and there's more alcohol aloted to you. It's not so bad.
N) maybe it's some weird plague going around?
O) the latest body has bite marks. This is not a plague. You are being hunted and there's nowhere to go
P) the mast reaches towards the sun. There's not that many of you left. You can feel your heart beat in your ears. You've grown inured to the salt in the air, but now you can't get rid of the taste. You bite your lips. The taste stays the same.
Q) you're thirsty. The captain has been taking more of the drink, and his writings have gotten more anxious - nervous scribblings in his diary and wary eyes peering through the dark of the ship. The eyes of the sailors peer back. You don't count them. It wouldn't do much good. You can't remember how many are left, anyways.
R) rust, you think, looking at a smear
S) it's not rust.
T) goodnight
Separately - there's also the question of vampirification. Did Dracula take "snacks" from other sailors? Did they slowly start turning into vampires before they were killed?
16 notes
·
View notes
Text
Today I'm more than usually annoyed with a pop science article, so I'm going to talk about reading these sorts of articles, why you should always be skeptical of claims in them, and some of the ways you can tell the article's author didn't understand what they were reading and told you the wrong thing.
I clicked on an article in Eating Well about low bone density and dementia, because my mother has both. There's not a lot we can do for her now, but I am a curious person. I know Eating Well isn't great at science interpretation and communication, so I'm anticipating that I'm going to need to read the original study already, going in. (How do I know Eating Well isn't a great source usually? Well, I have read it before, and it has some really clear biases if you read a few articles that aren't science communication, and so you get to know a source over time like that. Regardless of how, I'm already suspicious they're not going to do a great job.)
The article is talking about research that shows low bone density may be predictive of dementia risk. It is written by a journalist and reviewed by a dietician. Now, I don't know what review the dietician did, but she did a bad job, and also, so did the journalist, because THE FIRST red flag that goes up is pretty quick: the math is very, very clearly wrong.

This says there are 3651 participants, and that over 11 years, 688 of them developed dementia. This is 18.8% and the article calls it 19%. That's fair! Not a red flag so far, just rounding. Then it says that of the 1211 people with lowest bone density at the start, 90 people (7.4%) developed dementia, and of the 1211 with highest bone density, only 57 (4.7%) did.
This IS a red flag. It's a GIANT red flag. This red flag can be seen from SPACE by anyone who knows how percentages work.
Here's how: You have 3651 people. 1211 of them are in the low bone density group, 1211 of them are in the high bone density group, leaving 1249 people. You have 688 total dementia cases, but your high and low groups account for only 147 of them, leaving 541 cases for that middle group. That's a LOT of cases. That middle tertile, just eyeballing it, has to have about 40% of its people with dementia -- that makes low bone density look like it predicts LOWER dementia risk relative to the middle group.
I can write out the equations for you two ways:
3651 - 1211 - 1211 = 1249 688 - 90 - 57 = 541 541/1249 = 0.433 0.433(100) = 43.3%
Because I am someone who does a fair amount of stats for a living, though, what I noticed was pretty much this equation:
0.074(1211) + x(1249) + 0.047(1211) = 0.19(3651) and I knew immediately that x had to be MUCH bigger than it should, which indeed the math bears out: x(1249) = 0.19(3651) - 0.074(1211) - 0.047(1211) x(1249) = 694 - 90 - 57 x = 547/1249 = 0.438 0.438(100) = 43.8%
That 694 is because the authors rounded 18.8 to 19 earlier, not because I can't math. So, due to rounding, you get slightly different answers -- but BOTH of them point to something SERIOUSLY WRONG with the reporting. What is actually going on in that middle tertile? Where do these numbers come from? Well, lucky us, they mention the name of an author, a journal, and a date. Always be wary of pop sci articles that don't give you a way to track down the original, but giving you that way to track things down doesn't mean they aren't still doing a crummy job with their reporting, as we see here.
The original paper is Association of Bone Mineral Density and Dementia: The Rotterdam Study, published March 2023 in Neurology. This is a pretty technical article with a fair amount of math and things in parens etc. etc. and tables and lots of measurements. The table captions are often not the greatest, which makes it a bit harder to read and interpret. For example, in Table 1, items are listed as number(number) and this can be any of:
count (percent) -- this one's usually labeled in the table itself
mean (standard deviation)
median (interquartile range) -- these last two are NOT labeled in the table, so we don't know which set of numbers is which.
Great. Thanks guys. Assuming what's called a "normal distribution" mean (SD) and median (IQR) numbers will be similar, but they're not the same and I'm irritated they're conflated but OK. Soldiering on!
The original study looked at several different measures of bone density, and found only ONE of them to show predictive ability for dementia: the density of the femoral neck. This means that for their article, Eating Well should have looked at the results for femoral neck bone density, which we find in Table 2:

You have the actual numbers for 5 years, 10 years, and study end, as well as the hazard risk (HR) for each bone density tertile, with the highest tertile set as the standard. Numbers in the HR column have 1 as a reference point -- lower than 1 is lower risk than the highest tertile, and higher than 1 is higher risk.
The first thing I noticed is that neither 57 nor 90 occur in the femoral neck section at ALL. Those numbers from the Eating Well article are just not there. I also notice that the other numbers don't align even one little bit -- the number of total cases of dementia is different, for example. I do notice that the column with the 10 year followup has numbers in it close to 57 and 90 (49, 67, 86, totaled to 202) and that the overall numbers for the total study are much higher -- 201, 236, 229. Interesting.
At this point, I just straight-up search the paper for "90", and I find it in Table 2....in the total bone density section, which the paper's authors have said is NOT the section that showed possible predictive results. I search for "57", and also find that in total bone density, and also....wow the EW author straight up failed to read. This is actually worse than I thought.

Read across, these are the 5 year followup numbers (first 2 columns - count and HR), 10 year (middle 2 columns), and total followup numbers (last 2 columns).
We see our friends 57 and 90 in the 10 year columns. 90 is, as described in the EW article, in the lowest bone density tertile, but 57 is NOT in the highest bone density tertile. It's in the middle tertile. The actual number for the highest tertile is 68. Additionally, the total cases for 10 years is nowhere near that 688 number -- it's 215. We only get total case numbers close to 688 when we look at the study end numbers: it's 686, in this particular group. If we look at the study end case numbers for highest, middle, and lowest tertiles, we see WHY this particular measure can't be used to predict anything: they are 227 (highest), 227 (middle), and 232 (lowest) -- not significantly different from each other.
We can also see here that this group of people -- people who had total bone density measurements -- is not 3651, but 3633, which is listed across the bottom row. The overall STUDY had 3651, but not all of them had total bone density recorded.
Now we know that the author of the EW article did all of the following:
read the wrong part of Table 2
mixed up middle and high tertile results
reported 10 year results mixed with total followup results (this resulted in the weird math that alerted me something was very very wrong in the first place).
and the person who was supposed to review the article didn't have even the basic math skills to catch the problem -- which she absolutely should have, as a registered dietician. For giggles, I looked up program requirements for a BS in Dietetics. Programs require things like statistics and precalc -- not math heavy, but the math that alerted me to this problem is VERY basic statistical knowledge, like the kind they teach in 6th grade level statistics, which I know because it was literally in my 6th grader's curriculum this past school year. So a registered dietician DEFINITELY had enough math to catch this problem, and should have, and Eating Well should be ashamed of itself.
SO. What can we learn from this?
Well, science communication is a skill set. Some people have worked very hard to develop that skill set and are excellent at it -- but lots of people do not have it, and even those who do can make mistakes. Many, many pop sci articles are not written by trained science communicators, or people with any education in how to read scientific articles, or people with good reading comprehension, even. It's very common for pop sci articles to have these sorts of errors in them. Therefore:
Always read pop sci articles with a skeptical eye. Ask yourself:
Do these numbers line up? Usually the math in pop sci articles is not very complex -- you can often do some basic arithmetic to make sure it even makes sense, as was the case here.
Does one part of the article seem to contradict another part of the article?
Do I feel confused about what exactly I'm being told? What's not clear about it?
Am I being told about HOW something works or WHY it works or both? Are those two things being conflated somehow?
Is there a link or way to find the original research? If not, my advice is to throw the whole article away. If yes, you can go check it out -- often just looking at the abstract or results section will be enough, and abstracts usually aren't paywalled even if the rest of the article is. You would be surprised how many times the abstract says "we found X" and the pop sci article says "the researchers found Y".
Could I explain this article to someone and have it make sense? If not, why not?
Is the article confusing correlation (these things happen together) with causation (one of these things causes the other)?
Pop sci articles, like other journalistic articles, are extremely subject to bias issues from the publication they're in. A lot of people tend to read pop sci articles as neutral, factual reporting, but they aren't! I mentioned EW's biases earlier -- the one I think is most relevant to how their article is written is a pervasive belief that if you just eat the right things in the right amounts you will be thin and healthy and stave off all kinds of problems. They close their article by mentioning that, although the study's authors are clear that this connection is unlikely to be causative, and that risk factors for low bone density and dementia have substantial overlap, readers should act like it might be causitive with diet and exercise choices that promote bone health. They were so excited to get to their point about fixing your diet that they didn't pay attention to the actual science they were reporting on. (Sidenote: actual scientific journal articles are supposed to be neutral, factual reporting. They also aren't actually that, but there are some measures in place around this to try to prevent the worst effects of bias.)
It's worth brushing up some basic math skills. You don't need to know a lot! Very basic information will help you better understand a lot of articles -- both ones that are accurate and well-written, and ones that are shoddy and should not have been published. I really like Larry Gonick's The Cartoon Guide to Statistics but if your grasp of percentages is shaky, it will be too advanced. A good option might be something like The I Hate Mathematics! Book, which is pretty old but really accessible, but there's probably some newer great ones out there that I just don't know about.
#science#pop sci#reading comprehension#how dare you say we piss on the poor#math#statistics#eating well#bad science communication#neurology#dementia#bone density
57 notes
·
View notes
Text
Someone has probably already done this, but I'm gonna do it anyway. We're going to go over the average scores of players in the Life Series. BUT ALSO, we're going to go over the average score of players if you don't count their lowest placement in the series, and the average score when you don't count their highest placement to see how much that changes the order.
Quick note: I'm converting the scores in percentages so that way we can compare Last Life's scores to the other series accurately. The lower the percentage, the higher the placement. 100% is last place. (So that's Jimmy's score every time lmao) Also the percentages are rounded, as very few divided evenly. If they have decimals after, it's because there was another score close enough to theirs that it mattered.
Average Scores:
Pearl; 20% (averages 3rd place)
Martyn; 22% (3rd)
Scott; 28% (4th)
Grian; 41% (6th)
Impulse; 44% (6th)
Etho; 46% (6th)
Ren; 49.3% (7th)
Scar; 50% (7th)
Bdubs; 52% (7th)
BigB; 54% (8th)
Cleo; 57% (8th)
Joel; 63% (9th)
Tango; 72% (10th)
Lizzie; 76% (11th)
Skizz; 89% (12th)
Mumbo; 94% (13th)
Jimmy; 100% (14th)
It's pretty interesting to see the gap between 3rd and 4th place. Pearl, Martyn, and Scott all have really good scores.
Anyway, if you just wanted to see the average placements we're done now, but if you want to see how much this list is affected by players having 1 really good or really bad game, then keep reading under the cut.
Hello people who are still here, how are you?
So, let's see what happens when we don't count everyone's lowest score. To explain, Joel has placed 11th, 5th(but technically counted as 4th because last life is weird), 8th, and 12th. So here we would take the average WITHOUT the 12th place score, as it's the lowest. This helps us see whose placement is skewed the most by one particularly bad game.
Scott; 14% (2nd)
Martyn; 15% (2nd)
Pearl; 16% (2nd)
Grian; 30% (4th)
Impulse and Ren; 31% (4th) (Yes, they are perfectly tied)
Etho; 40% (6th)
Bdubs; 42% (6th)
Scar; 43.6% (6th)
Cleo; 44% (6th)
BigB; 46% (6th)
Joel; 55% (8th)
Tango; 64% (9th)
Lizzie; 76% (11th)
Skizz; 87% (12th)
Mumbo; 94% (13th)
Jimmy; 100% (14th)
Some cool facts about the data set! The average amount changed is 8%, 35% of scores were above this, and 65% were below this.
The person whose score changed the least was Jimmy, as Mumbo and Lizzie's scores don't change because they only played in 1 series. The person whose score changed the second least was Skizz at 2%
The person whose score changed the most is Ren at 18%, followed by Scott (14%), Impulse(13%), and Grian(11%).
Okay now time for excluding the highest score. Using the Joel example again, this time we would not include his 5th place placement. This helps us see whose score is skewed the most by one particularly good game.
Pearl; 26.5% (4th)
Martyn; 27.3% (4th)
Scott; 35% (5th)
Etho; 50% (7th)
Grian; 52% (7th)
Impulse; 54% (8th)
Scar; 60% (8th)
Bdubs; 62% (9th)
BigB; 62.6% (9th)
Cleo; 66% (9th)
Ren; 68% (10th)
Joel; 74% (10th)
Lizzie; 76% (11th)
Tango; 76.3% (11th)
Skizz; 91% (13th)
Mumbo; 94% (13th)
Jimmy; 100% (14th)
Interesting things about this data set! It has the biggest drop off between 3rd and 4th. In the original it's a 13% difference, in the positive leaning ranking it's 14%, and in this ranking it's 15%.
The average percentage changed is 8%. 45% of scores were below this, and 55% of scores were above this. The person whose score changed the least was Jimmy, followed by Skizz(2%).
The person whose score changed the most was Ren at 19%, followed by Joel (11%), Grian (10.6%) and Scar (10.5%).
Overall, Jimmy's score changed the least, as it didn't change at all. Skizz's score changed the second least, with a range of only 3.5%.
Ren's score changed the most, with a range of 37%. Ren is followed by Impulse (22.6%).
So yeah. Now you know a ton of random statistics, and I can rest knowing that all the math I did is out in the world. If any of my math is off, feel free to point it out. I did a lot of it with unrounded numbers and than rounded them in this post, so it might seem off because of that, but I also did some of it with the numbers already rounded, so it might need to be corrected, either way, letting me know is good.
I might update the regular averages after a new season, but I am not updating the other ranked lists, that would be hell. Bye!
#mcytumblr#mcyt#trafficblr#traffic smp#life series#3rd life#3lsmp#last life#llsmp#double life#dlsmp#limited life#24lsmp#bdoubleo100#bigbst4tz2#zombie cleo#ethoslab#grian#impulsesv#solidaritygaming#jimmy solidarity#smallishbeans#joel smallishbeans#ldshadowlady#inthelittlewood#martyn inthelittlewood#mumbo jumbo#pearlescentmoon#rendog#goodtimeswithscar
208 notes
·
View notes
Text
MASTERPOST - Round Two Polls
Welcome (back!) to round two of the MTMTE/LL story arc tournament bracket, where everyone gets to vote on/bicker about which of the story arcs in the comic is The Best For Real, Actually.


Following round one, we've matched up the winners of all those polls and pitted them against each other! As with round one, this masterpost will be the only one tagged #maccadam to avoid clogging up the main tag, so if you want to promote a particular poll you have a strong opinion on, reblog it! If you reblog a poll with a significant amount of propaganda for your fave story on it, we'll reblog it with #propaganda as the tag.
One poll in this round is between three stories rather than two because that was how the maths shook out when I divided the stories up.
This is a masterpost containing links to all Round Two polls (17 seperate arcs, for 8 polls). You can also find all these under the tag #round 2 polls on the blog. All the polls have a quick summary attached to refresh your memory if the name of the arc doesn’t immediately ring a bell! The FAQ for this can also be found here.
Some fun facts now round one is done:
All winners in round one bar "How To Say Goodbye And Mean It: Part 2" are from MTMTE. That's the only LL story that's going to round two!
The biggest percentage gap was between An Axe To Break The Ice vs Delphi.
The smallest (and by a significant margin, most voted in poll this time) was World, Shut Your Mouth vs Some Of My Best Friends Are Autobots.
Links to all polls as follows:
Our Steps Will Always Rhyme vs Liars, A to D World, Shut Your Mouth vs Delphi Elegant Chaos vs How To Say Goodbye And Mean It: Part 2 Before & After vs Overlord Scavengers vs The Dying of the Light The Not Knowing vs Little Victories vs Silent Light Interiors vs Slaughterhouse Shadowplay vs Remain in Light
76 notes
·
View notes
Text
I did some math
A quick post because I have dinner reservations and a trip to pack for.
We've talked a lot recently about Jungkook's popularity vs. Jimin's. I keep insisting JM is more popular, but nobody seems to believe me. Since I like data so much, I did a deep dive into the Spotify charts for September 25, 2024. Specifically, I tallied up the total number of streams WHO, SEVEN, and SNTY are getting from Vietnam and Thailand. Can we all agree that those streaming numbers are always a little fishy?
First, as of 9/25, WHO was charting in 47 countries. SEVEN was charting in 20, and SNTY was charting in 12.
On the Global Spotify Chart, WHO was #3, SEVEN was #34, and SNTY was #75.
First, I calculated the percentage of streams coming from Thailand and Vietnam for each song.
15% of WHO's streams were coming from Thailand and Vietnam.
29% of SEVEN's streams were coming from the two countries.
32% of SNTY's streams were coming from there.
Jungkook is getting double the percentage of streams from Thailand and Vietnam than Jimin is, even though his song is newer.
Next, I subtracted the number of streams from TH/VN from each of the three songs to see how it would impact the charts.
WHO dropped from #3 to #7 on the Global Spotify chart.
SEVEN dropped from #34 to #61 without TH/VN/
SNTY went from #75 to #87.
If the goal was for Jungkook to have huge inroads in the US, it's not working. Both SEVEN and SNTY were each charting in just one country in South America. They weren't charting in any western European countries, either. His songs are charting in the Middle East, Eastern Europe, and Asia.
Of course, there's nothing wrong with being popular in those places. And it's impressive he still has two songs charting considering how old they are. I think SEVEN will still be charting 20 years from now, whether I like it or not.
These numbers don't really mean anything other than to demonstrate that JK's support is not coming from North and South America or Western Europe, which is problematic when you consider how much money the company has spent to make him popular in these markets.
17 notes
·
View notes
Text
According to the DLG gold eggs are 10-20% larger than all other eggs and tend to be more yellow-toned, while other eggs are themselves about the same whatever you're looking at
According to the wiki newly hatched dragons "were the size of very large dogs or small ponies"
Great Dane- 28-35 inches (71-89 cm) at shoulder [w/ large mastiffs seemingly averaging a few inches smaller in comparison (~22-30 inches (56-76 cm))]
Small ponies classed as 50 inches (127 cm) or lower at the shoulder
Assuming the size range is maintained through hatchlinghood as well as adulthood then 25-45 (64-114) works for averages...
So by this estimate greens would be about 22% their adult height at hatching and golds would be about 23% of their adult height at hatching. An average hatchling green would be about 13% of their mama's height.
For some comparison, komodo dragons seem to hatch at somewhere between 12 and 18 inches (30-46 cm) long, with adult females reaching average lengths of about 7.5 feet (2.3 m), giving us an average of babies being 16% of their mama's length. They also seem to clutch an average of about 20 eggs at a time (I'm seeing some estimates as high as 30 but, going with the 20...)
So, in theory the math can work. Mostly due to the sheer number advantage of greens and blues. Potentially browns as well... quick math we can expect on average 18% mama's height, so pushing it a little... Still, in action, feels a bit wibbly, but in theory the math can math.
Of course one can also go with a smaller size range. After all, looking at ponies, a small shetland can be the size of a large great dane. So in theory you could lower the high end. Technically you could do the same with the low end, but I personally wouldn't drop it below that 22 inch (56 cm) mark.
Or, if you wanted to play more with the whole mess with gold eggs being larger than the rest of the clutch by a notable amount, you could always have all the hatchlings be about the same size with the exception of the gold, but to go with the gold being 20% larger than the others then we'd be talking a range of something like 29-37 inches for the non-golds and 35-45 inches for the golds, which could potentially muck up our percentages based on height comparisons.
To play with those ones, our golds in that case would be 17-22% mom's height at hatching, while the rest of the clutch would be 14-18% mom's height at hatching. Which is, again, theoretically mathing. Shit can, in theory, be done.
All depends on how you wanna play the game. If you wanna play the game. I wouldn't blame you for going home. I'm typing this and I wanna go home.
2 notes
·
View notes
Note
You have any headcannons for the stan twins? They can be random ones.
Stan can do really quick mental math when it comes to money. Calculating the total amount of items + tax in a matter of seconds within his own head. But only with money because if you just give him a bunch of random decimals and percentages to solve/convert, he's gonna need some paper and a calculator.
Ford is very tolerant to weather. This SOG wears turtleneck sweaters in the summer with a trenchcoat and probably wears shorts no problem in the winter. That or he just wears whatever he grabs first in his closet.
16 notes
·
View notes
Note
Hey! Youre much better at numbers than i am but the ryliver vid is currently at 50k and going up with almost 400k views... while others have much more views in comparison to the likes. Does that make sense?
Okay, so here's the thing, the ryliver video is sitting at 50.6k likes with 391k views at the time I'm typing this, that means that 13% of the views came with a like, which is a decent number. Most videos from the 911 Instagram are between 7 and 9% view for likes (at least from a very quick math from the top 18 videos) but it can go as low as 5%. Ideally, when dealing with a social media that recommends stuff based on likes, you want the percentage of likes per view to be as high as possible, because theoretically, that means you're reaching more people. One account can watch the same video 100 times but they can only like it once. There's also the way that the algorithm that counts views tries to weed out an account that just left the video open and left the room. Things like the deleted scenes there are various reasons as to why someone would watch it and not like it, watch it multiple times and not leave a like, or even watch it enough times to drown out that percentage, because it's a scene at the end of the day. The thing with the ryliver video is that it seems to be reaching more people who are willing to drop a like, not reaching a group of people who will only watch it and not like it or the same group of people watching it multiple times. They clearly posted that video to create buzz and it worked, to reach 50k likes at the 911 account, you need at least half a million views based on other videos, a video with 300k something views usually gets anything from 18 to 30k likes. They have videos with a million views that didn't reach that 10% likes numbers, which puts the ryliver video as performing better than expected because at the end of the day, likes are worth more than views in some aspects.
#they are reaching more accounts individually is the things basically#i really need a tag for asks#anon 😌#911#spy network
8 notes
·
View notes
Note
31 14 18 22 for todd ..
31. do they like receiving gifts? giving gifts? what is their ideal gift?
i always find todd to be one of the most Normal Guy ocs i have in that he has simple joys in life without any particular hang-ups/quirks. gifts are a yes, although sometimes the value of a gift is lost on him (handmade item is about the same worth as a coworker getting him a mcdonalds sprite otw to their shift--he is equally as happy and easy to please). on the other side: he is good at giving gifts that people like but never considered. not because he is deeply sentimental (although he can be), but as if he can naturally intuit what a person wants/”needs”.
an ideal gift for todd would probably be quality time. he likes novel experiences but would never turn down a physical good. you'd get more mileage with taking him to, like, a waterpark over most things.
14. are they any good with numbers?
to a normal extent--i.e. good with quick real-world math, but isn't going to sit and work thru a big equation. he can definitely calculate a tip percentage from job experience. i would say he could do a price is right type of scenario where he can roughly estimate the worth and total value of things monetarily
18. their opinion on lying, stealing, and killing?
todd is pretty normal. lying is ok when it's funny. some people need white lies.. stealing is ok when it's funny and it's usually funny so who cares. killing isn't funny unless it's in some hyperbolic example etc.
22. do they sleep well at night?
easily the best sleeper out of him, wes, and alex. not that there is much competition. in the other sense, yea, he's got a clear conscience lol
2 notes
·
View notes
Text
Skyrim travel time calculations
In response to a question about how I figured out the travel times/distances for Skyrim, I've detailed my process here because it's much too long to explain in post comments.
It's basic algebra, a lot of division and solving for X, and I hope I've explained it coherently. It's more of a process than you might expect, but it's not difficult. There's a picture of the equations at the end, too.
I'm also no mathematician, so there are some discrepancies and personal choices included in this equation.
One last note, these calculations tell you about how long it would take if you traveled from A to B with no stops, no holdups, and perfect weather.
The Math
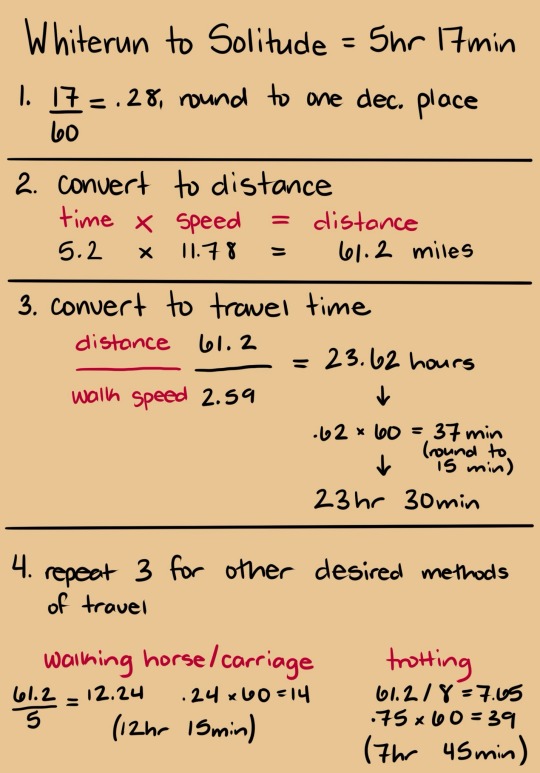
The first thing I did was dig up the Dragonborn's in-game travel speeds and convert them to MPH. They are:
Walking: 3.8 ft/sec, or 2.59 mph Running (default speed): 17.3 ft/sec, or 11.78 mph Sprinting: 23.4 ft/sec, or 15.95 mph
Step 2 was to travel from a chosen Point A to a chosen Point B. For this example, we'll be traveling from Whiterun to Solitude. I used the default running speed while traveling (because who has time to walk everywhere), but because I assume most people aren't jogging or sprinting for long journeys, we'll convert things to walking speeds later.
In this example, it took 5 hours and 17 minutes of in-game time to travel from Whiterun to Solitude. I measured this by marking what time I left Whiterun and what time I arrived in Solitude.
Note: Some journeys had multiple feasible paths. If the times were very different, I included both. If they were very close, I included the one that made the most sense (most towns en route, doesn't cut through Labyrinthian, etc.)
Step 2, here comes all the math.
Quick aside, this handy calculator can do most of this process if you don't want to do it manually.
Because this time isn't an even amount of hours, we have to convert the spare minutes into a percentage of 60 minutes. Divide the spare minutes (17) by 60, and we get .28. I rounded to a single decimal point, so we get .2.
This brings our converted time to 5.2 hours.
This step is unnecessary if you don't have spare minutes, say, if the time was 5 hours instead of 5 hours and 17 minutes.
Next, take this number and multiply it by 11.78mph (the running speed) to convert time to distance. We are using 11.78 because we decided to run everywhere. If you chose to walk instead of run, you'd use the walking speed of 2.59mph instead of the running speed, but they are not interchangeable.
5.2 x 11.78 = 61.2 miles (rounding to one decimal place again).
Step 3, convert this distance to time.
Because we want to know the walking time, we divide the distance by 2.59mph (the default walking speed).
61.2 / 2.59 = 23.62 hours.
Because we have a decimal and not a round number, we need to convert that .62 back into spare minutes. We do this by multiplying .62 by 60.
.62 x 60 = 37 minutes.
Making our total travel time (at walking speed) 23 hours and 37 minutes. Personally, I rounded all my numbers to the nearest 15 minute mark, making the new time 23 hours and 30 minutes.
Step 4, convert distance into other desired methods of travel.
For immersion purposes, I also calculated the travel times for horse and carriages and walking and trotting speeds - those are methods canonically available in Skyrim and that make sense for this kind of fantasy setting. To do this, repeat Step 3, replacing the walk speed with the speed of your desired method of travel.
A quick Google search told me that walking horses/carriages travel about 5mph, and trotting horses/carriages travel 8-12mph (I used 8).
Walking: 61.2 / 5 = 12.24 .24 x 60 = 14 minutes total time is 12 hours and 15 minutes (rounded)
Trotting: 61.2 / 8 = 7.65 .65 x 60 = 39 minutes total time is 7 hours and 45 minutes (rounded)
I hope this guide helps!
8 notes
·
View notes
Text
"The Fairest of Them All" A EuroQuision Article

Hello everyone! I hope you're ready for the first official EuroQuision article release! This one is a mathematical doozy, but trust me when I say this is worth the read. If you wanna download a PDF of the article, you can do so here!
And if you don't feel like downloading the whole thing, I'll be copying the entire article into this post after the section break so you can read it here! Thanks so much to the Patrons and other supporters that make this work possible!
The Fairest of Them All
By Beatrice Quinn
Quickly: what is the most overrated song of Eurovision 2024?
…got an answer? Ok, now: Prove it.
Today we’re talking about one of the most ambiguous, aimless, misunderstood metrics we use to say whether a song is overrated or not, and that is: Ratings. Literally! Now, we’re familiar with “ranking” Eurovision songs – dragging and re-dragging “Halo” up and down your 2022 scoreboard depending on whether or not you think Pia Maria is a real person or not – and other such activities! Ranking is crucial and emblematic to the existence of Eurovision and its fans, it hardly needs to be said. Developing babies watch the dancing fruits of Cocomelon, we watch a series of rectangles and numbers combine to shift and jump around aimlessly until they eventually settle in place. And once they’ve settled in place, forever to remain unmoving from those results, fans all across the world will continue to exist in a frenzy about how they should have landed instead.
But what’s the difference between ranking and rating? And by extension, why are the phrases “overrated” and “underrated” thrown around so frequently? Well, ranking songs is an action that always exists in and around the context of all competing songs that year. That’s why when the first Eurovision song of the season rolls around – usually courtesy of our lovely Albanians – it’s ridiculous and repeatedly unfunny to see YouTubers upload their “Eurovision 2021: Top 1 Ranking” videos. Rating a song is something you can do whether you’re talking about one song, or 42 songs. You don’t have to judge the songs ranked against each other. You can judge it based on its own merits or whatever frame of reference you have. I’m not here to write an article trying to tell people how they can or can’t rate songs – I would only ever tell that to the WiwiJury. And I would tell them politely, yet firmly, to stop.
No, I’m writing all this to do one thing: To give you a quick math lesson! And by quick, I really mean it, I promise. I swear I’m not a nerd! Well, that’s a lie. I’m a huge nerd. But I’m not a math nerd. It would be more accurate to say I’m a numbers nerd – specifically, Eurovision numbers. That’s the kind of numbers we like! We’ve seen our share of Twitter polls, asking us to choose between anything from Biggest National Final Robberies to “do you think Joker Out read the fanfic?” We just love stats and percentages! So I’m here to put those to the test in the most straight-forward, least-opinionated way possible. And let me be so clear about this: This article is not going to try and definitely prove anyone’s personal tastes right or wrong. This is about the mathematical results of how we rate Eurovision songs and whether or not this provides any accuracy.
Before we get into all the numbers: Let’s say you’re an Albania stan – a type of stan I’m familiar with, fond of, and am deeply frightened by – and you go to EurovisionWorld.com to excitedly check the results of the star ratings left by online visitors from every end of the earth, all coming to rate a song you’re excited to rate and enjoy yourself. You get there and you see: 2 stars – 2,815 ratings. Your heart sinks. “Only two stars? Is this actually a bad song? Do people hate the song? Am I dumb for liking it?” These are all things we’ve all felt about certain songs we hold dear to our heart, but it really doesn’t make sense, right? Why should a number generated by the preferences of 2,815 people sway your feelings towards a song you like? Then, as the season goes on, more songs pop up and get rated as well. As your Albanian gem middles out around 2.3 stars after 5,000 or so people decided to rate it, you see a grinning Dutch lad beating out the majority of the competition in terms of stars. “Wait, that just has so many views and over ten thousand more ratings than Albania has, what gives?” Then: the accusations start. “Joost is overrated!!” “Baby Lasagna’s hype won’t last forever.” “Vidbir said they’ll announce the results after six business days, not counting shipping and handling, but when they do, they’re gonna be so overrated.” And on the flip side: “Everyone is sleeping on Dons.” “Hera shock Q in May.” Various statements that however passionate are sadly not actually provable – at least, not in the moment.
It goes without saying that a Eurovision song’s rating out of 5 stars on EurovisionWorld does not, in any way, affect the results and winners of Eurovision. Instead, these ratings exist as a rare form of communal discussion. While the subjectivity of musical taste varies, we all get to share our opinions. And this process is what leaves us with two sides of the same undefinable coin: Over or Under Rated.
We all have experiences with people or conversations where a fun song may be chastised for being overrated, or overly praised for being underrated. The attitude for or against a song doesn’t always exist like this – you can love an overrated song and hate an underrated one, I don’t care. But the point here is: these terms are something we relate to being an idea or descriptor, rather than something that can be mathematically determined. In fact, by treating the Eurovision “rating” system in its current state as purely a matter of statistics, we can then use that information to reference other claims against it. It’s quite scientific, if I do say so myself. Now, are both my college degrees in film, music, and writing? Yes. Did I ever get anything higher than a B in any math class I’ve ever taken? No. But allow me to explain!
If someone were to say “Sweden is overrated,” what if there were a way to actually find out if that’s accurate or not? And once you find that out with some quick math, you can use that as evidence as to why or why not Sweden is overrated. My hope is that once we find out whether a song is mathematically overrated or underrated, we can then discuss possible reasons why or why not. Of course, this kind of question is going to be answered by collecting a LOT of numbers and doing a LOT of organization. Luckily I know someone who personally is sick enough in the head to sit down and pour through all the numbers, make the spreadsheets, make the graph, explain the equation, and write the article about it.
…it’s me. I think the “write the article” part was a giveaway, but here we are! So enough fluff, let’s get rating!
CHAPTER 1: The EuroQuision Equation!
Say that five times fast. And if you choose not to say that five times fast: I respect your decision, but I am disappointed in you.
So, we’re working with numbers. That means I am now tasked with figuring out the best way to observe the information I’m given, find out how it all balances out, and how do we compare all of that together? For context, there are two key components to finding out how over or underrated a Eurovision song is. As you’ll see while scrolling down the songs of any Eurovision year, you’ll see the stars beside them which are a result of ratings given by any IP address that rates the song. So not only do you get to see a song’s star rating, you can also see how many people contributed to that average rating. For anyone who doesn’t know, averages are a mathematical result of adding up the values of a set of inputs, then dividing that total by the amount of inputs. It’s hard to explain averages in a proper sentence, so here’s an example. If you are given the numbers 4, 8, and 3, you would first add up the numbers. 4+8+3 equals 15. Then, you take the sum (15) and divide it by how many numbers you added together. You added 3 numbers, so you divide (15 / 3) and find the average of 4, 8, and 3 is 5.
This is how those star ratings show up the way they do. If a song is rated by 10,000 people, you would add up the total stars given by each person, then divide that by 10,000. However, there’s another statistic we can find out by collecting all of this information. Like I said before in the Albania example, there are songs that only get 10,000 ratings by April, and others have hit over 40,000. You would think it’s as simple as saying “The songs with the most ratings are overrated, case closed.” But I’m here to say: not quite! If you were to rank the songs by most to least amount of ratings, that’s one result to find, sure. But I’m choosing to ask: what’s the average amount of ratings themselves? It’s something we can actually find out, since we have all the information!
Needing only the numbers provided by EurovisionWorld.com, we can find out what the average number of ratings is, and what the average number of stars is. We can’t really say who is over or underrated until we have an idea of how many people have contributed to these ratings. After finding these averages, the next step would be to compare and contrast how close or far each country deviates from those averages. Let’s say, if I were to add up all the star scores and find their average, I get an average of 3 stars. Therefore, any song that scores fewer stars than that is under average, and those scoring higher are above average. The same goes for ratings. After adding up EVERY number of ratings from each country and dividing by 37, we’ll know the average number of times a Eurovision 2024 song is rated. This will matter greatly in comparison to other years because the global attention to Eurovision grows every year. A year like 2014 is going to have a significantly lower average number of ratings simply because not as many people rated the songs in comparison to 2024. Sounds easy enough, right?
Ok, even if it’s not “easy” to understand now, it will be very soon! To help guide us into the numbers of it all, I made some visual aids! Let’s stop talking about the numbers and actually start crunching them!
CHAPTER 2: Playing With Numbers
Before we find out if any country is over or underrated, we gotta find our global averages first! Let’s look at the stars first. As you know, a song can achieve anywhere from 1 to 5 stars on EurovisionWorld.com – a very standard format! While we the voters/raters can only select a whole number of stars (one star, four stars, etc.), the website takes all those scores and calculates the average for us and displays that as a more accurate number often with a decimal point. Another important note is that I know this information doesn’t exist in stasis: songs can continue to be rated long after the contest is over. So for accuracy’s sake, I gathered ALL numerical information for this essay on one day: April 25th! This is to account for a few factors. Like I said, the amount of ratings grows over time and has a recency bias, so I didn’t want to get the ratings in late March. I also didn’t want to wait after the contest, just in case any results of the contest cause a shift in mass ratings from the rest of the world. I chose April 25th to write down every song’s current amount of ratings and current star score so that it reflected nothing but expectation and audience reaction, and without any influence from rehearsals or live shows.
Now, a song’s release day does play a part in how many ratings and stars it gets…most times. We’ll discuss that in the analysis chapter AFTER we go over all the numbers. So, this is all you need to know right now: I collected these numbers on April 25th, 2024. Additionally, there’s something else I did for making the math easier and more score-like, which is that I convert a song’s total amount of ratings into a whole number with one decimal point so that I’m operating with two factors closer to each other in size. For example, if a song has 18,311 ratings, I’m converting that to 18.3 so that I’m working with a star score of, for example, 3.6 and a rating total of 18.3, which are easier to put into the equation and find a Deviation Score that is represented by a small, whole number. The last important detail is that there WILL be more visual aids, and if any of this is still confusing by the end, let me know and I’ll figure out how to make this easier for everyone!


Lastly, you might wonder why I’m looking at both stars and ratings in this big equation. If this is about who is or isn’t fairly rated, why do the star scores matter? Well, I’m factoring both ratings and stars in a song’s Deviation Score because these numbers don’t exist separately from each other. A song only gets a star score after thousands of people leave their opinions, and people share those opinions in this medium by clicking somewhere between one and five stars. Therefore, it isn’t fair to say a song is “overrated” simply because more people have rated that song compared to others. Spam rating exists (as EurovisionWorld has learned the hard way), and there are songs every year that are perceivably more “popular” based on things like YouTube video views or Spotify streams. Those things don’t factor into this because simply watching the video or streaming the song isn’t the same thing as “rating” it. Spotify only has stream counts, and YouTube has a like or dislike button. EurovisionWorld has a conventional 5-star rating system that is determined by people from all around the world and is mathematically calculated. So by giving a song a Deviation Score that’s based on how close/far from average a song is in stars and ratings, we’re acknowledging all the factors that go into this question.
Now onto the numbers! Do you wanna take a guess as to how many ratings were left on EurovisionWorld.com from the start of the season through Apr. 25th? There was a staggering total of 689,968 ratings across 37 songs! Over half a million ratings is a lot of opinions, right? And still that’s barely a fraction of the total people who watch the show itself. Regardless, that’s the information we have to work with! So, if there’s a total of 689,986 ratings given out to 37 different songs, that means our avg. # of ratings is: 689,968 / 37 = 18,647.7838. Obviously, 18,647.7838 is an awfully long, complicated number to use. Therefore, I’m simplifying it to just 18.6 (approx. 18,600 ratings). So, 18.6 is our avg. # of ratings. As for avg. # of stars, there is a grand total of 130.1 stars totalled up between all the songs. This is a really good number, when you consider the math. For example, if every song of 2024 only got on average one (1) star, then we’d have a total of just 37 stars. So with this info, it means our avg. # of stars is: 130.1 / 37 = 3.51621622…… and many more numbers after that. Therefore, I’ll state our avg. # of stars is 3.5. Once again, this is a good number! On a scale of only one to five stars, the average of that would just be 2.5 stars, right in the middle. That means the public thinks that overall, Eurovision 2024 is a bit above an average level of quality. And I would agree! Anyway, just to sum up all the numbers we just found out, I’ll list them here:
Total amount of ratings from all songs: 689,968
Avg. amount of ratings per song: 18.6 (simplified from 18,647)
Total amount of stars from all songs: 130.1
Avg. amount of stars per song: 3.5 (simplified from 3.5162…)
For me, the easy part is over and the hard part begins. Now is when we begin to document every song’s amount of ratings, their star scores, and running the math to see how far above or below the averages they are. For the super hot and cool nerds that like excel sheets, I’ll link the viewable sheet of all the info at the end of the article! For the sake of this article, I’m going to choose a couple key examples, and those are: Sweden, the Netherlands, Iceland, and…sadly, “Israel.”
CHAPTER 3: Do We Have a Valid Result?
Let’s actually see this equation in action and find out what we can learn from all of this. The reason we’re going to be looking at these select countries is that each of them exists at a very specific point on the spectrum of overrated or underrated. We’ll begin with the country that receives arguably the most “overrated” accusations thrown at them in a given Eurovision season, and that is: Sweden! Did you find the twins’ song unforgettable? Regardless, let’s run their numbers through our equation and figure out just how “rated” they are.
As you remember from our graphic, the equation we use is shown as (a - x) + (b - y) = z. Let’s take a look at Sweden’s stats, which are documented altogether in the same list as all 37 songs. “a” is Sweden’s star score. Sweden, as of April 25th, has a score of 3.4 stars. “x” is the total average of stars across all songs, which is 3.5. (3.4 - 3.5) = -0.1. This -0.1 means that Sweden is just ever so slightly below the average score, which is something I would agree with (but that part’s just my opinion). The second half of our equation is about ratings. Sweden was rated on EurovisionWorld a total of 18,259 times. We simplify that big number just to 18.2, and we subtract the average number of ratings from that number. (18.2 - 18.6) = -0.4. Now, we can also observe that in its total number of ratings, Sweden is actually still below average, even though not by a whole lot. Now that we have -0.1 and -0.4 reflecting Sweden’s relationship to the global average of stars and ratings respectively, we combine those! (-0.1) + (-0.4) = -0.5. There you go! Sweden got a score of, overall, slightly underrated. Shocking, right? That’s right, in numbers and stats alone, Sweden is very close to the global averages. However, the claim that they’re “underrated” isn’t as true as it sounds once we look at another country through this equation.
Next, let’s take a look at a country that was 1st in the odds…only to fall from those heights down to a last place finish in their semi-final. Iceland’s song “Scared of Heights” is an interesting case. I won’t try and pretend that these ratings exist separately from a song’s public perception – or at times, their public drama. So don’t worry, we’ll address that and much more after we do more fun math activities. Not many people were running around saying “Husavik 2025!” when this got selected, but how was it rated? Iceland has the literal lowest star score out of all 37 songs this year, sitting at 2 whole stars. Since we know the global average is 3.5, that means Iceland is -1.5 stars from the average. However, this is where we can see the ways ratings and stars can differ. When it comes to stars, a song scores anywhere from 1 to 5; it’s not a very wide range. But for ratings, Iceland only has 10,951 ratings (shown as 10.9). Even compared to Sweden, that’s eight thousand fewer ratings, meaning: people either chose not to go out of their way to leave a rating, or it's just not as popular. From the average of 18.6, Iceland’s 10.9 ratings is a whole -7.7 away from the average. Let’s combine those two differences: (-1.5) + (-7.7) = -9.2. In comparison to Sweden, Iceland is actually “underrated” when we look at the numbers. That final score of -9.2 is a culmination of the song not only getting a lower score, but it comes from fewer people deciding to rate it. Would “Scared of Heights” be closer to the average amount of stars if more people had chosen to give it a rating? Or would more ratings just reflect the same sad score of 2 stars? This is something to consider when we have more context about who/which countries have more ratings than our first two examples.
They may have been disqualified for total BS reasons, but they’ll never be disqualified from my heart! The Netherlands’ “Europapa” is a song that has a lot to give it a leg up over a country like Iceland when it comes to public perception: Joost Klein is a more “established” artist in comparison to most Eurovision competition. “Europapa” contains satirical-yet-universal lyrics that touch on personal and international topics at the same time, and the whole thing is a lot of good fun, even with a touching ending. However, this can all add up to what no sounds like a very reasonable claim of “overrated”-ness. Do the numbers reflect that? Unsurprisingly: yes, yes they do. The Netherlands has a star score of 4.1, which is the average score from a total of 35,557 ratings. Again, we see how the number of ratings can vary much wider than just star scores on their own – I can only imagine how it feels to see someone else’s song get 20,000 more ratings than yours. Let’s run the equation!. (4.1 - 3.5) + (35.5 - 18.6) => (0.6) + (16.9) = 17.5. As you can see, now that we move to the opposite end of the spectrum, the difference in influence is more observable. That score of 17.5 now properly reflects how a star score of 4.1 comes from a severe increase in number of ratings, and Joost’s popularity can very well be a factor in that, all regardless if the song is “good” or “bad.”. Like I promised, we’ll talk about the implications and conclusions these numbers can represent in a moment. We have one more “country” to look at.
“Israel,” as I’m sure you need no reminding, is the reason all of Eurovision 2024 was a complex, un-fun, total mess of a season. All the reasons supporting this can fill up their own article, so we’re going to be focusing on how 2024’s hottest potato fares in terms of stars and ratings. “Israel” and their song “Octo–” sorry, “Hurricane” has the same star score as the Netherlands, which is 4.1 stars out of 5. However, “Hurricane” has almost ten thousand more ratings than “Europapa,” at 45,255 ratings. (4.1 - 3.5) + (45.2 - 18.6) => (0.6) + (26.6) = 27.2. Just for another moment, let’s disregard the implications of this number and just compare it to the 3 other examples we’ve done. At one end of the spectrum, Iceland is underrated with a Deviation Score of -9.2, and Sweden has a Dev. Score of -0.5. As a reminder, if a country is completely and perfectly “average,” they would receive a score of 0; as in, it’s not overrated nor is it underrated. However, the score for songs being underrated are a lot less severe than the others. The Netherlands’ Dev. Score of 17.5 and “Israel’s” 27.2 are up in the double digits, but why?
Well, the first explanation is very easily observable: “Israel,” the Netherlands, and several other countries are simply rated more than other countries are. Therefore, this is evidence to support the claim that more people overrate songs than people who underrate other songs. For context, the country with the lowest number of ratings is Albania, with only 9,094 ratings and a star score of 3.1 stars. The country with the highest number of ratings is actually Croatia, with 47,315 ratings as of April 25th and has the highest “overrated” Dev. Score with 29.5. And now that we have our equation and can actually tell who is statistically over or underrated, let’s actually ask what that “means.”
CHAPTER 4: Take (It) Away
At ten pages (and two visual aids) in, we finally have some concrete numbers to look at and discuss, leading with the question: What are we meant to take away? If being over/underrated is now mathematically observable, what does it all mean? To answer that question, we need to look at the entirety of our data table and apply real-world context to the numbers we’re looking at. As I mentioned near the beginning of this article, this is not about simple labels. Let’s start with the observation I made right before this chapter, “More people are more likely to overrate songs than people are to underrate them.” This is visible in multiple ways. First, as we discovered when we found the global average of each song’s star score, we got a score of 3.5/5 – above average! But it’s not just about the stars; there’s another noticeable trend between the highest star-scoring songs and how many people have rated them. Ten songs from 2024 have a star score of 4 stars or higher – Croatia, Greece, and Serbia were all tied at 4.3 stars. Between all ten songs, they have a total of 292,504 ratings. Now at the other end of the star spectrum, how do the lowest scorers look?
Well, no song this year got less than 2 stars, now matter how much I dislike “Scared of Heights.” However, there are eight songs that scored below 3 stars, in comparison to the ten higher scoring songs. Fun fact: Finland’s “No Rules!” is the lowest-ranking song that qualified for the final (as of April 25th), whereas the highest ranked NQ was Belgium. Anyway, between those eight songs underneath 3 stars, there’s only 129,063 ratings, which is approx. 170 thousand fewer ratings. The numbers don’t lie: if anyone ever claims “Eurofans just like to hate things,” statistically that’s wrong! It’s not impossible, either. On that note, though, one would be allowed to ask “But doesn’t that mean there are songs that are overrated?” And if you’re talking about the literal, specific definition of songs having a greater number of ratings than others, then yes you’re right. But I have a feeling that most people say the word “overrated” more emotionally than logically. Remember how I introduced Sweden as one of the most frequently overrated countries? My guess is that you didn’t disagree with that claim. And I’m not just guessing: I’ve seen every upset Kaarija stan, Mans-hater, and person with ears that dislikes “If I Were Sorry.” Sweden’s no stranger to the overrated accusation, but we just saw how this year that’s statistically untrue. The most perfectly middle-rated song this year is Luxembourg’s “Fighter” with a Deviation Score of -0.4. Sweden, Slovenia, Austria, and Czechia round out the Top 5 Most-Midrated Songs of 2024. And like the title of this article says, these five songs are by all definition “the fairest” of them all. Czechia is actually closest to the average number of ratings (that 18.6 we’ve been using in the equation) with 18,614 ratings. But hey, I like to indulge my own curiosity, so I wondered if these numbers are connected at all to who did or didn’t qualify. In Eurovision 2024, 11 songs did not qualify to the Grand Final. So, let’s look at the 11 most statistically-underrated songs!
They are from lowest to highest (of the low): Albania, Iceland, Azerbaijan, Moldova, Australia, San Marino, Armenia, Portugal, Malta, Latvia, and Cyprus. Now, Denmark and Poland aren’t that much higher than these 11, but they managed to not be in the bottom 11. And of these lowest 11 Dev. Scores, 7 ended up being NQ’s. In fact, it’s more understandable why the few Q’s of the bottom 11 are here. Armenia was the last-revealed song of 2024, and Portugal had the very last National Final of the season. They didn’t have as much time between their selection and April 25th when I collected the numbers like other songs had. And yet, Albania was one of the earliest selections and sits at the very bottom of the list – time may not heal all wounds.
Cyprus and Latvia are the other two songs from the Bottom 11 of the Underrated’s that qualified, and I genuinely think this is where the legitimate factor of chance plays a part. Cyprus came 6th in its semi, so we can state that the live performance and competition of the semi elevated Cyprus to a better position in the televoters’ preference, despite the odds! Latvia could be a similar case, as it finished 7th in the second semi-final. Then come Saturday, the two songs ended up right next to each other on the scoreboard with Cyprus at 15th and Latvia at 16th. As we keep moving up the list of Deviation Scores, we can spot the four songs that did qualify in the eyes of the raters, but not in the show itself. Denmark is just above Cyprus, and two more spots up is Poland. Four more spots up is Czechia among the most midrated songs of the year, so they were a true “Could go either way” case. Then in the biggest jump to our final non-qualifier, Belgium is 11 spots higher than Czechia and sits at being the 9th Most Overrated of 2024. Here and now, we have finally arrived at the fabled: Shock NQ. Now, a non-qualifier being a “shock” is up to your own opinion. If you’re me, you’re sitting here writing this article knowing damn well you knew Belgium’s Q-streak was over before Mustii hit the stage. This is the honest truth, and only Silia Kapsis has the right to try and say otherwise. But it also can be said that it’s not about asking “Who was the Shock NQ?” and more about asking “Who had the most attention before they NQ’d?” And the answer would be Belgium! Anyway, at this point I’m starting to think to myself “Huh, can using this over/underrated equation be a method to possibly predict a country’s qualification?”
…and then I remembered: Qualifiers are chosen entirely by televote. Therefore, if the Deviation Scores can predict the qualifiers with about 64% accuracy, can it predict the televoting Top Ten?...Let’s find out!
When looking at the Top Ten Most Overrated Songs of 2024, we have:
1st. Croatia
2nd. Israel
3rd. Netherlands
4th. Switzerland
5th. Italy
6th. France
7th. Ukraine
8th. Greece
9th. Belgium
10th. Ireland
(11th: Lithuania)
And for comparison, let’s look at the Top Ten of the 2024 Televote:
1st. Croatia
2nd. Israel
3rd. Ukraine
4th. France
5th. Switzerland
6th. Ireland
7th. Italy
8th. Greece
9th. Armenia
10th. Lithuania
To begin, you’ll notice I included the 11th Most Overrated song in parenthesis, which is Lithuania. I did this to reflect that even though the Netherlands is 3rd Most Overrated, they sadly weren’t able to receive the televotes they deserved the night of the Final. Using the data from this table alone, my conclusion on the Netherlands is that they were easily going to place Top Ten in the Televote, which would then leave who in 11th? Lithuania. All that’s left is to replace Belgium – a poorly-staged pop ballad with a party-harshing climax – with Armenia, which is a song bursting with fun, flawless vocals, and something so Armenian it caused Azerbaijan to get sent to the Doom Dimension. Additionally, mostly out of curiosity, I checked how many more reviews “Jako” has on EurovisionWorld as of May 22nd, and they’re up from ~12,000 ratings to ~18,000 while maintaining their 3.7 star score both times – that’s a show of quality and enjoyment from audiences over time. So other than those cases…I think I just mathematically figured out how to predict the televote? And, I don’t even mean the Top Ten – I mean the whole competition.
So I ask you this: What do we do when we are suddenly given information about the ways the results of Eurovision can be reflected in data before the fact? The answer is not “try and make a profit.” No, that’s not how EuroQuision works. Instead: we use it as mathematical evidence that propaganda fucking works.
CHAPTER 5: Couldn’t See It Comin’
Except: now we know we did see it coming.
Before we dive into the serious stuff, you might be thinking that what I’ve presented is an attempt or desire to “break Eurovision” or take advantage of this information for personal gain. I won’t deny that bets play a huge role in Eurovision – it’s how we get the odds in the first place. But if you know me, you know I’m not in this for the money, even though that may differ from the EBU’s intentions. The truth is that I don’t have any practical means to try and “profit” from any way this information could be used. Part of journalism and sharing of information is the inability I have to control how it’s used despite my best intention.
My intention with this article is to provide evidence that “Israel’s” attempts at utilizing Eurovision to get a good result and repaint their global image was nearly perfect, and the numbers said it was going to happen the whole time. Even without the numbers from EurovisionWorld, we knew how desperate “Israel’s” pleas for votes from the world were. From Duolingo’ing her way across the internet to coordinated efforts to vote en masse in various countries, Eden Golan was gunning for a televote win that she nearly reached, and that’s assuming every single one of those votes were completely legitimate. This is not said to try and accuse anyone of fraudulent voting when I don’t have evidence to support that. I mention it because vote buying is a practice that has been done in the past and actual delegations received punishment for doing so. Given the context of every other effort “Israel” put into their campaign for votes – and I mean everything: begging other artists/teams for positive press and harassing them to the point of retaliation – doesn’t make fraudulent voting seem out of the question.
Unfortunately, I am no expert on voter fraud – ironic, me being an American and all, but I digress. This is something that, if proven true, will be revealed in the time post-Eurovision 2024. And if it’s true, I will happily discuss it! But for now, I can only talk about what we do know, which is the newfound connection between EurovisionWorld’s sample of public ratings indicating a song’s predicted success or failure in the contest. This connection is reflective of the greatest tool a Eurovision song has: public perception. Or as some countries treat it: propaganda. Even though “Israel” is a country being sued by the ICJ for genocide, actively commit acts of violence to Palestinians as well as fellow-EBU member countries Lebanon, Jordan, and Egpyt, and were told multiple times by the EBU reference group to rewrite their political song lyrics, they still performed and qualified and finished Top Ten. Truly, did we even need my equation to prove “Hurricane” was overrated? Not really. Instead, “Hurricane” being so statistically overrated was a symptom of the larger effect of a successful PR campaign. When you consider that “Israel’s” mere existence inside of Eurovision is in itself a PR campaign, none of this is surprising. “Israeli” media took every possible moment to try and tell the world that their Eurovision participation was a good thing and truly represented being “united by music.” They did this in commercials and even in what “Israel” calls a sketch comedy show.
All of these factors had me worried that despite my best hopes and efforts, somehow “Israel” would pull off a good result when they should have been removed months ago. However, the numbers were there the whole time. As we can see, the numbers don’t only apply to solely to “Israel.” Just as they came 2nd in my list and 2nd in the televote, Croatia was 1st in both, and the accuracy of the Top Ten as well as the bottom eleven/NQ’s can’t be ignored either. Truly think about that for a moment: on April 25th – several days before we saw any rehearsal footage or official performance – we knew with 80-90% accuracy the Grand Final televote results and who wasn’t going to qualify with 64% accuracy. And before you suggest that this was a Eurovision 2024-exclusive phenomenon, I thought of that too! So as a surprise fun addition, I ran my equation with the 2023 songs as well!
Since I can’t travel back in time to April 25th 2023, there’s no way I could collect all the ratings and stars with the same accuracy as I did for 2024, Thankfully, using the Wayback Machine Internet Archive. I managed to “go back in time” to a window of time spanning from mid-April to early-May and collect all the numbers. Even with a wider window of information, the 2023 Deviation Scores proved to be almost identical in accuracy – even more accurate in some cases. Starting with the Bottom 11 Most Underrated according to my equation, 9 of those countries turned out to be NQ’s. At the other end with the Top 10 Most Overrated, 7 out of those 10 did in fact finish in the Televote Top 10. And who was the most “overrated” of 2023? Not Finland, not Sweden, but “Israel” and “Unicorn.” This shows that for two years in a row, despite the drastic shift in public opinion and discussion concerning Israel’s participation, their songs that directly correlate to geopolitical aggression and self-victimization proved effective in the realm of Eurovision. So once again, I ask you, the reader: What do we do? CONCLUSION
Since I’m aware that a 20-page article is a bit long, I will go ahead and just list out the most important bits of information I covered and discussed:
Using the information from EurovisionWorld.com, we created an equation that figures out how close or far a song is from the global average of both stars and number of ratings.
Comparing these Deviation Scores reflects a somewhat-accurate correlation between how much the public “rates” a song and whether that song qualifies or potentially comes Top Ten in the Televote
Once these connections can be observed, we can discuss what factors or influences play a part in these connections (Is a song more popular? Is it less popular? Is it representing a country committing war crimes and hopes no one notices? Etc etc.)
Finally, here in the conclusion of all of this, we can answer that third point. As I mentioned, cases like Joost and “Europapa” being overrated are fairly easy to explain; well-known artist, extremely radio-friendly banger song, the list goes on. It also reflects why Iceland and “Scared of Heights” is near the bottom; a more “generic” paint-by-numbers pop song with simple English lyrics, a very unambitious composition, etc etc. However, there’s a difference between a song being over/underrated based on merit, and those with scores based on skewed public opinion one way or another.
I won’t pretend for a moment that spam-liking or spam-disliking doesn’t exist. For example, I’m aware of how Bashar Murad was the clear favorite to win over Hera Bjork, but sadly finished 2nd in what felt like a very devastating blow to the potential of Palestinian representation at Eurovision when it’s needed most. Anyone who rated Iceland poorly because of this is able to do so just as fairly as those who rate it low based on song quality alone. I cannot control the reasons as to why people choose to rate a song high vs. low.
Conversely, you might reasonably be saying “If ‘Israel’ is continuing to treat this as one big PR stunt, wouldn’t that mean all those positive ratings and their televote score are a result of artificially inflating the numbers and/or buying votes?” And as much as that’s one possible explanation, I’ll remind you that there are people who genuinely just enjoy “Hurricane” and dislike having to engage in contextualizing “Israel’s” Eurovision participation. For example, Worldvishawn is a Eurovision TikTok creator with over 300,000 followers, and on multiple occasions has published videos voicing his enjoyment and support of “Hurricane” this year. In a video discussing “Hurricane’s” rehearsals, he notes that the song is a “9/10” and is a case where “the live vocals are better than the studio version.” The issue here is not the fact that a fan of Eurovision has a positive opinion of a song that a lot of people dislike, that’s never a problem with me. The issue is that people with large platforms are able to give their opinions to hundreds of thousands of people with the click of a button and provides a space where people can attempt to remove any context of “Hurricane” and “Israel” whatsoever and just say the song is good. This is what indicates to me that all the positive numbers surrounding this song aren’t all completely fabricated and this should not conclude in a baseless accusation of buying or faking votes.
Eurovision 2024 was a year where at every level of control, nearly everyone chose to do nothing rather than doing something. At the tippy top of the ranks, it was up to the EBU to remove “Israel” because of their own previously-established actions and morals concerning geopolitical violence during Eurovision, specifically in the case of Russia. After they refused to do that, it was the responsibility of participating broadcasters to withdraw and refuse to participate. After all 37 broadcasters refused to actually do anything, it was up to the artists to put their career aside and take a stand in the public eye. And then, none of the artists did that! Some showed and voiced their advocacy, but none of them showed solidarity. If you aren’t familiar with the difference between advocacy and solidarity, advocacy is when you “advocate” your morals and beliefs in your words and attitude. Solidarity is when you put those words to action and actually do something actionable to disrupt the status quo to be in solidarity with those who are suffering and against a system of power that is ignoring them. And since none of the artists’ advocacy led to solidarity, there we were with a Grand Final with “Israel” coming 2nd in the televote and no one doing anything about it.
Now, I could go down the entire chain of responsibility of “Who needs to do something about this?” and eventually land where I and many others have been for months, which is the fun destination of Boycottville, but a lot of people hear the B-word and think its an invitation to start arguing and calling me a hypocrite. What I will state is this: boycotting is not something asked of us to try and simply prove our morals for show or optics, and it is not something we ask people do to in order to shame them should they choose not to. Boycotting is what we do when every level of command above us refuses to do anything about a system that is completely broken and exploitable. The numbers were there from the beginning and even I can admit I was foolish when I stated in my own video essay that “‘Israel’ isn’t going to get an enormous televote score.” That is something I said based on optimism and my own reasoning, before I actually came up with this equation and ran all the numbers. I was proven very wrong and I think I’m not the only one.
In the end, I need to remind us all that this was never about the results, it was never about “making sure ‘Israel’ doesn’t win.” If this were truly about making sure “Israel” didn’t win, then we would all have had to agree on one (1) artist to mass-vote for AND hope the juries liked as well, but that would be literally impossible. Whereas Eurofans could argue “Let’s mass-vote Croatia!” or “Mass-vote Ukraine again,” that is nowhere as easily and streamlined as it is for Zionists, “fake” votes, and “Israeli” fans to just spend all their money on voting for “Hurricane.” So once again: THIS IS NOT ABOUT RESULTS. The numbers sadly reflected “Israel” succeeding in their campaign nearly the entire way, and because they know that Eurovision is a system where everyone from the broadcasters to the fans don’t actually want to do anything that poses a threat to this silly contest, they’ll get the numbers they want. Trying to beat “Israel” at the game of Eurovision is a mathematical impossibility as things currently stand, and if EVERYONE continues to not want to change their behavior (the EBU, the broadcasters, the artists, the news websites, even the fans themselves), then “Israel” will keep playing this game successfully for years to come.
“The Fairest of Them All”
Researched and Written by Beatrice Quinn
Research Data Links:
Eurovision 2024: Deviation Scores
Eurovision 2023: Deviation Scores
THANK YOU TO MY PATREON SUPPORTERS!
$1 Members
Elliot1000
Jonny
Myrthe VT
Pax
Yas
Free Members
Forest
Gabe
If you want to support me directly, consider joining my Patreon!
Join for free or in one of three tiers! <3
6 notes
·
View notes