#RetailAnalytics
Explore tagged Tumblr posts
Visit Tumblr Blog
Explore Tumblr blogs with no restrictions, modern design and the best experience.
Last Seen Tumblr Blogs


Fun Fact
Tumblr has been providing a Korean-language service since 2013.
Text
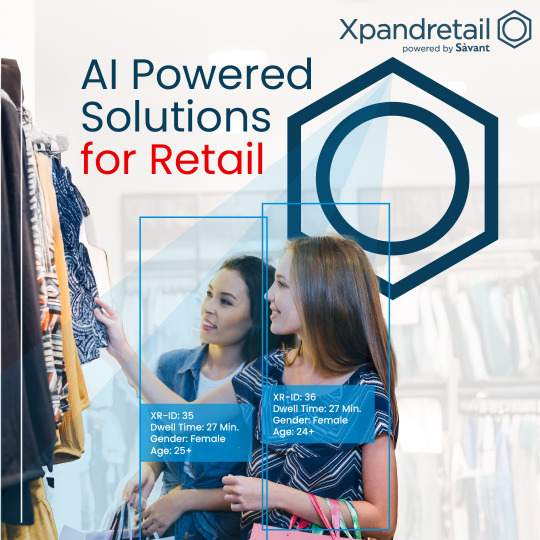
AI Powered Solutions for Retail - Xpandretail
At Xpandretail, we bring decades of experience delivering innovative analytics solutions that empower retailers to understand customer behavior like never before. Our state-of-the-art system is designed to capture every nuance of your store’s activity, helping you optimize operations and drive growth.
#RetailAnalytics#SmartRetail#CustomerData#Xpandretail#AI#PeopleCounting#RetailTechnology#BoostYourBusiness#CustomerInsights#RetailIndustryTrends#PeopleCountingSolutions#Gulf#UAE#Kuwait#Bahrain#Oman#Qatar#KSA
5 notes
·
View notes
Text
Multi-Location Insights from Singapore’s GPSS Events

“Without data, you��re just another person with an opinion.” – W. Edwards Deming
The 10-Day Festival of Speed, Culture, and Entertainment
Grand Prix Season Singapore (GPSS) is an annual city-wide celebration that transforms Singapore into a vibrant hub of motorsport-themed activities. Arranged in conjunction with the Formula 1 Singapore Airlines Singapore Grand Prix, GPSS combines high-speed racing with entertainment, cultural options, and gastronomical experiences.
Additional highlights encompass concerts featuring international artists, food festivals, exhibitions, and interactive experiences, making it a must-see event for both residents and tourists. Its 15th edition was held from 13 to 22 September 2024.
Apeiron has been associated with Singapore Tourism Board Market Research since 2023.
During the GPSS, Singapore’s iconic districts come alive with race-themed activities. From Orchard Road to Clarke Quay, Kampong Gelam, and Sentosa, each precinct has an experience to offer.
The GPSS Events Singapore Analytics was secured by the company Apeiron.
Footfall Analytics measures precinct parties with detailed tracking and analytics. Major activities include assessing the number of people for each of the four precincts, analyzing visitor demographics, and possibly assessing the impact on nearby businesses. Additional metrics will include feedback on customer satisfaction and tracking revenue from the events as well as indirect benefits to nearby businesses. Program partners will be surveyed to ascertain their expectations for an overall business impact of the events. Finally, observations will be drawn from data collected, and recommendations will be prepared for either presentation or reporting to summarize the conclusions.
Get in Touch with Apeiron’s Market Research Experts Now!
Footfall Estimation – Research Methodology
On-Site Interviews: Event-day foot traffic estimates and survey interviews conducted by field agents stationed both inside and outside event premises.
Interaction with Participant Surveys: Field agents encourage participants to complete the surveys.
Manual Count Communication: Consistent communication of the manual counts was done to the desk team for consideration.
Photographic Collection of Evidence: Photos with time stamps were shared for verification.
Desk Team Verification: The desk team went through photos to estimate footfall.
Hourly Count Extrapolation: Collected on an hourly basis (weekday/weekend, inside/outside).
Footfall Benchmarking: Airports were referenced for benchmarking (2023-2024) at nearby Wisma Atria.
Data Triangulation: This helped to reduce errors by cross-verifying data to arrive at an estimate of an average daily footfall.
Estimation of Tourist Ratio: This was calculated on surveys filled by tourists or short-term pass holders.
Data Collection Period: 10 days for both footfall and survey data.
Consumer Survey – Research Methodology
Survey Participation: Field agents interacted with event-goers to fill the survey.
QR Code Survey: Conducted surveys by distributing QR codes for participants to scan and fill.
Survey Locations: Conducted surveys at the event area and surrounding display locations.
Study Tools for Research
Footfall Estimation – Digital photography, video analysis, and physical counts constitute an estimation procedure for an accurate measurement of foot traffic.
Data Extrapolation – Visitor numbers are assessed, and accuracy is enhanced by working alongside participants and neighboring businesses.
Optimized Location Boundaries – Multiple entry points strategically designed to maximize participation, adjusted for the concerns of safety and site design.
Study Objective – Seeks to estimate footfall, participant revenue, and customer satisfaction with a view to better event planning.
Target Locations – Four iconic locations were studied: Orchard Road, Sentosa, Kampong Glam, and Clarke Quay.
Sample Size – 3,200 respondents surveyed in total, with 800 participants from each location, thus providing a wide variety of data.
Methods of Data Collection:
Online and physical surveys
Face-to-face interviews
QR code and email survey distribution
Telephone interviews
Ensuring Data Quality:
Field surveyors under the supervision of team leaders
Verification via GPS track and time-stamped photos
Pulse surveys and data reliability tests
Daily review of collected data for consistency and accuracy.
Definition of Footfall Insights
The Footfall Nexus allows STB to place resources on the ground while fine-tuning event execution processes based on peak visitation times.
Customer Satisfaction: Provides data to improve visitor experience and address areas for improvement.
Revenue Tracking: Enables STB to maximize economic benefits and assess the financial impact of events.
Program Partner Feedback: Guides future partnerships and collaborations for better program outcomes.
Data-Driven Decisions: Assists STB in tailoring marketing strategies and attracting targeted audiences.
Event Optimization: Ensures future events are more efficient, enjoyable, and successful for all stakeholders.
Comprehensive Analyses by Aperion: Guarantee actionable insights that make a difference in both planning and execution of events.
For comprehensive multi-location event analytics, Apeiron Market Research and Consulting invites your consideration.
Source: https://apeiron.sg/multi-location-insights-from-singapores-gpss-events/
#GPSSInsights#SingaporeEvents#MultiLocationMarketing#ApeironSG#CustomerBehaviour#RetailAnalytics#LocationBasedInsights#SingaporeF1Season#EventMarketing#MarketResearchSingapore
0 notes
Text
Uncovering the Real ROI: How Data Science Services Are Driving Competitive Advantage in 2025
Introduction
What if you could predict your customer’s next move, optimize every dollar spent, and uncover hidden growth levers—all from data you already own? In 2025, the real edge for businesses doesn’t come from owning the most data, but from how effectively you use it. That’s where data science services come in.
Too often, companies pour resources into data collection and storage without truly unlocking its value. The result? Data-rich, insight-poor environments that frustrate leadership and slow innovation. This post is for decision-makers and analytics leads who already know the fundamentals of data science but need help navigating the growing complexity and sophistication of data science services.
Whether you’re scaling a data team, outsourcing to a provider, or rethinking your analytics strategy, this blog will help you make smart, future-ready choices. Let’s break down the trends, traps, and tangible strategies for getting maximum impact from data science services.
Section 1: The Expanding Scope of Data Science Services in 2025
Gone are the days when data science was just about modeling customer churn or segmenting audiences. Today, data science services encompass everything from real-time anomaly detection to predictive maintenance, AI-driven personalization, and prescriptive analytics for operational decisions.
Predictive & Prescriptive Modeling: Beyond simply forecasting, top-tier data science service providers now help businesses simulate outcomes and optimize strategies with scenario analysis.
AI-Driven Automation: From smart inventory management to autonomous marketing, data science is fueling a new level of automation.
Real-Time Analytics: With the rise of edge computing and faster data streams, businesses expect insights in seconds, not days.
Embedded Analytics: Service providers are helping companies build intelligence directly into products, not just dashboards.
These services now touch nearly every business function—HR, operations, marketing, finance—with increasingly sophisticated tools and technologies.
Section 2: Choosing the Right Data Science Services Partner
Selecting the right partner is arguably more critical than the tools themselves. A good fit ensures strategic alignment, faster time to value, and fewer rework cycles.
Domain Expertise: Don’t just look for technical brilliance. Look for providers who understand your industry’s unique metrics, workflows, and regulations.
Tech Stack Compatibility: Ensure your provider is fluent in your existing environment—whether it’s Snowflake, Databricks, Azure, or open-source tools.
Customization vs. Standardization: The best data science services strike a balance between reusable IP and tailored solutions.
Transparency & Collaboration: Look for vendors who co-build with your internal teams, not just ship over-the-wall solutions.
Real-World Example: A retail chain working with a generic vendor struggled with irrelevant models. Switching to a vertical-focused data science services provider with retail-specific datasets improved demand forecasting accuracy by 22%.
Section 3: Common Pitfalls That Derail Data Science Projects
Despite strong intent, many data science initiatives still fail to deliver ROI. Here are common traps and how to avoid them:
Lack of a Clear Business Goal: Many teams jump into modeling without aligning on the problem statement or success metrics.
Dirty or Incomplete Data: If your foundational data layers are unstable, no algorithm can fix the problem.
Overemphasis on Accuracy: A highly accurate model that no one uses is worthless. Focus on adoption, interpretability, and stakeholder buy-in.
Skills Gap: Without a strong bridge between data scientists and business users, insights never make it into workflows.
Solution: The best data science services include data engineers, business translators, and UI/UX designers to ensure end-to-end delivery.
Section 4: Unlocking Hidden Opportunities with Advanced Analytics
In 2025, forward-thinking firms are using data science services not just for problem-solving, but for uncovering growth levers:
Customer Lifetime Value Optimization: Predictive models that help decide how much to spend and where to focus retention.
Dynamic Pricing: Real-time adjustment based on demand, inventory, and competitor moves.
Fraud Detection & Risk Management: ML models can now flag anomalies within seconds, preventing millions in losses.
ESG & Sustainability Metrics: Data science is enabling companies to report and optimize environmental and social impact.
Real-World Use Case: A logistics firm used data science services to optimize delivery routes using real-time weather, traffic, and vehicle condition data, reducing fuel costs by 19%.
Section 5: How to Future-Proof Your Data Science Strategy
Data science isn’t a one-time investment—it’s a moving target. To remain competitive, your strategy must evolve.
Invest in Data Infrastructure: Cloud-native platforms, version control for data, and real-time pipelines are now baseline requirements.
Prioritize Model Monitoring: Drift happens. Build feedback loops to track model accuracy and retrain when needed.
Embrace Responsible AI: Ensure fairness, explainability, and data privacy compliance in all your models.
Build a Culture of Experimentation: Foster a test-learn-scale mindset across teams to embrace insights-driven decision-making.
Checklist for Evaluating Data Science Service Providers:
Do they offer multi-disciplinary teams (data scientists, engineers, analysts)?
Can they show proven case studies in your industry?
Do they prioritize ethics, security, and compliance?
Will they help upskill your internal teams?
Conclusion
In 2025, businesses can’t afford to treat data science as an experimental playground. It’s a strategic function that drives measurable value. But to realize that value, you need more than just data scientists—you need the right data science services partner, infrastructure, and mindset.
When chosen wisely, these services do more than optimize KPIs—they uncover opportunities you didn’t know existed. Whether you’re trying to grow smarter, serve customers better, or stay ahead of risk, the right partner can be your unfair advantage.
If you’re ready to take your analytics game from reactive to proactive, it may be time to evaluate your current data science service stack.
#DataScience2025#FutureOfAnalytics#AdvancedAnalytics#AITransformation#MachineLearningModels#PredictiveAnalytics#PrescriptiveAnalytics#RealTimeData#EdgeComputing#DataDrivenDecisions#RetailAnalytics#SupplyChainOptimization#SmartLogistics#CustomerInsights#DynamicPricing#FraudDetection#SaaSAnalytics#MarketingAnalytics#ESGAnalytics#HRAnalytics#DataEngineering#MLOps#SnowflakeDataCloud#AzureDataServices#Databricks#BigQuery#PythonDataScience#CloudDataPlatform#DataPipelines#ModelMonitoring
0 notes
Text
The 30% Accuracy Boost: How Predictive Analytics Revolutionizes Demand Forecasting
If you're a retailer struggling with overstocked shelves or frequent stockouts, you're not alone. One of the biggest challenges in retail is getting demand forecasting right. Traditional forecasting methods often fall short, relying heavily on historical sales data and gut instinct.

But with today’s advancements in retail data analytics, predictive analytics has changed the game—boosting forecast accuracy by up to 30%. This means better inventory decisions, fewer lost sales, and higher profits.
Let’s break down how AI-driven demand forecasting is reshaping the retail industry and why it’s no longer a nice-to-have—but a must-have.
What Is Predictive Analytics in Retail?
Predictive analytics is the use of machine learning algorithms and statistical models to forecast future outcomes based on past and real-time data.
In the context of data analytics in retail, predictive models use:
Past sales data.
Customer behavior.
Seasonality trends.
Weather patterns.
Local events.
Marketing campaigns.
Supplier lead times.
This combination allows retailers to accurately forecast future product demand—down to specific SKUs, regions, and timeframes.
The Problem with Traditional Demand Forecasting
Traditional demand forecasting often relies on spreadsheets or basic trendlines. While these methods offer a general sense of what to expect, they don’t account for sudden demand shifts caused by:
Viral trends on social media.
Supply chain disruptions.
Unpredictable weather
Economic shifts or inflation.
This leads to:
Overstocking, which ties up cash and increases storage costs.
Stockouts, which lead to missed sales and poor customer experience.
Both scenarios hurt profitability and brand reputation.
How Predictive Analytics Solves It
Predictive analytics processes thousands of variables in real-time, recognizing patterns humans can’t see. It dynamically updates forecasts as new data comes in, improving accuracy over time.
Here’s what that looks like in action:
Dynamic Demand Forecasting
Instead of static monthly or quarterly forecasts, AI tools provide daily or weekly demand predictions. These are updated in real-time as conditions change—such as weather, promotions, or competitor activity.
Example: A leading grocery chain implemented predictive analytics to forecast demand for perishable goods. They reduced waste by 28% and increased on-shelf availability by 19%.
Hyper-Local Forecasting
Not all stores behave the same. Predictive models account for location-specific trends, store traffic, and demographics.
Example: A fashion retailer used predictive analytics to adjust inventory levels for its stores across metro and tier-2 cities. This led to a 22% reduction in unnecessary inter-store transfers and improved sell-through rates.
Integrated Marketing Forecasts
Predictive tools can assess how marketing campaigns will affect demand. If you're planning a major discount or influencer collaboration, predictive analytics helps you prepare the right inventory levels in advance.
The 30% Accuracy Boost: What It Really Means
Studies and real-world implementations show that predictive analytics can increase forecast accuracy by 25–30% compared to traditional methods. This translates to:
Fewer stockouts and lost sales.
Lower inventory carrying costs.
Reduced markdowns or clearance sales.
Better cash flow and profitability.
Enhanced customer satisfaction.
In competitive markets, even a 10% accuracy boost can make a huge difference. A 30% gain? That’s transformational.
How Retailers Can Get Started
Implementing predictive analytics doesn’t require a massive overhaul. You can begin with a focused use case—like forecasting for seasonal products or high-margin SKUs—and scale gradually.
Key Steps
Clean and integrate your data – Bring together POS data, inventory logs, marketing calendars, and external data (weather, events).
Choose the right analytics platform – Use tools that fit your business size, data complexity, and tech skills.
Train your team – Make sure category managers and inventory planners understand how to interpret and act on forecast insights.
Monitor & improve – Keep refining the models with feedback loops and human judgment.
The Bigger Picture: Data-Driven Retail
Forecasting is just one piece of the puzzle. Retail data analytics can also support pricing strategies, customer personalization, supply chain optimization, and more.
When integrated into your retail strategy, predictive analytics doesn't just help you react to demand—it helps you stay ahead of it.
Final Thoughts
In the retail world, every shelf space, every SKU, and everyday matters. Relying on outdated methods for forecasting leads to costly inefficiencies and missed opportunities.
By embracing data analytics in the retail industry, especially predictive demand forecasting, retailers can gain the accuracy and agility needed to thrive in today’s dynamic market.
Want to reduce guesswork, boost profit margins, and deliver what your customers want—right when they want it? It starts with a smarter forecast.
0 notes
Text
How can data enrichment services benefit my retail business?
In today’s competitive retail landscape, data is one of the most valuable assets a business can leverage. This is where data enrichment services come into play. By enhancing existing data with additional insights, businesses can make more informed decisions, optimize marketing efforts, and ultimately boost sales. EnFuse Solutions is one of the most trusted and reliable data enrichment service providers in the industry.
#DataEnrichmentServices#RetailDataSolutions#CustomerDataEnhancement#RetailAnalytics#SmartRetailDecisions#EnrichedCustomerProfiles#PersonalizedRetailMarketing#RetailDataOptimization#BusinessDataGrowth#TargetedCustomerInsights#EnFuseSolutions#EnFuseSolutionsIndia
0 notes
Text
🛒 America’s Grocery Bill: #CitybyCityPriceBreakdown (2025)


Are you overpaying for everyday groceries compared to other #USCities?
With #FoodPrices continuing to fluctuate due to inflation, transportation costs, supply chain disruptions, and regional demand, it’s more important than ever to understand where your #GroceryDollars are going—and where they could go further.
That’s why #IWebDataScraping has compiled one of the most
comprehensive city-by-city #GroceryPriceAnalyses for 2025. Our team has gathered, cleaned, and structured live pricing data from thousands of online and offline sources to provide a detailed picture of food affordability across the #UnitedStates.
💡 Did you know that mushrooms average $3/kg in some regions, while tomatoes cost $2/kg in others? Depending on where you live, the cost difference for a basic grocery basket can vary by 30% or more. With our #DetailedDataSet, you can identify which cities offer the best value, track seasonal fluctuations, and even monitor trends that #InfluencePurchasing decisions.
📈 With our 2025 Grocery Price Index, you gain powerful insight into consumer spending patterns, regional affordability, and #UrbanFoodEconomics. And right now, we’re offering an exclusive 30% OFF so you can take advantage of this critical information at a reduced rate. Know More >>>>
0 notes
Text

Why UK Retailers Monitor Meesho Ratings for Trend Analysis
UK retailers track Meesho ratings to uncover rising fashion & product trends. Learn how Datazivot enables global trend forecasting with Indian review data.
At Datazivot, we help UK brands tap into Meesho’s treasure trove of reviews and product ratings through automated scraping and AI-driven analysis.
#MeeshoScraping#UKRetailers#TrendForecasting#BeautyInsights#MeeshoIndia#RetailAnalytics#AyurvedicBeauty#MeeshoReviews#eCommerceTrends2025#FastFashion#SentimentAnalysis
0 notes
Text

Decode Every Pixel of Retail - with Wisepl
Behind Every Retail Image Lies Untapped Intelligence. From checkout counters to smart shelves, every frame holds critical insights only if labeled with precision. We turn your raw retail data into high-impact intelligence.
Whether it’s SKU-level product detection, planogram compliance, footfall analytics, or shelf-stock status: Our expert annotation team delivers pixel-perfect labels across:
Bounding Boxes
Semantic & Instance Segmentation
Pose & Landmark Annotations
Object Tracking in Video Footage
Retail is not just physical anymore - it’s visual. Get the high-quality annotations your AI needs to predict demand, optimize layouts, and understand shopper behavior like never before.
Let’s make your retail data work smarter, faster, sharper.
Let’s collaborate to bring clarity to your retail vision. DM us or reach out at [email protected] Visit us: https://wisepl.com
#RetailAI#DataAnnotation#ComputerVision#SmartRetail#RetailAnalytics#ProductDetection#ShelfMonitoring#AnnotationExperts#AIinRetail#Wisepl#RetailTech#MachineLearning#VisualData#ImageAnnotation
0 notes
Text
Understand the growing role of Naver Blog Scraping in retail brand monitoring, offering real-time insights into market sentiment and brand visibility.
The Naver Blog platform represents a goldmine of consumer insights, authentic opinions, and real-time market feedback that savvy retailers can leverage through advanced data collection techniques. Naver Blog Brand Monitoring has emerged as an essential practice for retailers seeking to understand their position in the Korean market, track consumer sentiment, and identify emerging trends before competitors.
Source : https://www.retailscrape.com/retail-brand-monitoring-enhanced-by-naver-blog-scraping.php
Originally Published By https://www.retailscrape.com/
#NaverBlogScraping#NaverBlogDataExtraction#NaverShoppingAPIIntegration#BrandMonitoring#MarketSentiment#KoreanMarket#ConsumerInsights#CompetitiveIntelligence#TrendIdentification#SentimentAnalysis#ProductDevelopment#InfluencerMonitoring#RealTimeFeedback#BrandReputation#RetailAnalytics#KoreanConsumer#PRMonitoring
0 notes
Text
Your competitors aren’t guessing. Why are you?
In e-commerce, speed is nothing without strategy. 42Signals gives you a clear view of what your rivals are selling, how they price it, and what’s driving demand—so you can lead, not lag.
✨ Smarter assortments ✨ Real-time pricing intel ✨ Share of search & demand signals
📊 Make every move count. 🔗 Explore how brands win with 42Signals → https://tinyurl.com/yuh9zmn2
0 notes
Text
Weekend Rush Reports
Stop Guessing. Start Tracking Accurately with Xpandretail.
Which zone inside the mall other than the food court saw the highest visitor traffic this weekend?
Our smart footfall analytics reveal trends and high-traffic hotspots, helping mall managers make data-driven decisions that boost conversions and enhance customer experience.
Click to explore: https://xpandretail.com/mall-data-analytics/

#PeopleCounting#RetailAnalytics#FootfallTracking#ConversionRate#SmartRetail#MallTech#RetailAI#MENA#SàvantDataSystem#RetailInnovation#UAE#KSA#Qatar#Bahrain#Oman
1 note
·
View note
Text
Next.co.uk Product Pricing Scraping

Next.co.uk Product Pricing Scraping
Unlock Competitive Insights with Next.co.uk Product Pricing Scraping by DataScrapingServices.com.
In the ever-evolving world of eCommerce, staying competitive requires access to real-time pricing data. Next.co.uk Product Pricing Scraping offered by DataScrapingServices.com empowers businesses with actionable insights by extracting accurate product pricing data from one of the UK’s leading retail websites. Whether you're an online retailer, pricing analyst, or market researcher, this service is a game-changer for staying ahead of the competition.
Key Data Fields Extracted
Our scraping solution delivers a wealth of essential data, including:
- Product Name
- Product Categories
- Prices (Regular and Discounted)
- Product Descriptions
- Stock Availability
- Customer Reviews and Ratings
- SKU Numbers
- Image URLs
Benefits of Next.co.uk Product Pricing Scraping
1. Real-Time Market Intelligence
Gain instant access to updated pricing and product details. Stay informed about market trends and competitor strategies, enabling timely and informed decision-making.
2. Optimize Pricing Strategies
Analyze competitor pricing trends to adjust your prices dynamically, ensuring competitiveness while maximizing profits.
3. Efficient Inventory Management
Monitor stock availability and product trends on Next.co.uk to identify popular items and manage your inventory more effectively.
4. Enhanced Product Offerings
Understand customer preferences by reviewing product descriptions, ratings, and reviews. Use these insights to refine your own product offerings and improve customer satisfaction.
5. Boost Marketing Campaigns
Incorporate pricing data into targeted promotional campaigns. Highlight competitive advantages and offer timely discounts based on market insights.
6. Save Time and Resources
Automate the data collection process and eliminate the need for manual monitoring. This allows your team to focus on analyzing data rather than gathering it.
Best Data Scraping Services Provider
Extracting Product Details from Kogan
Tesco Product Prices Extraction
Lazada.com Product Prices Extraction
Amazon.ca Product Details Extraction
eBay.ca Product Information Extraction
Costco.ca Product Data Extraction
G2 Product Details Extraction
Target Product Prices Extraction
Etsy.com Product Details Extraction
Walmart Product Price Data Extraction
Best Next.co.uk Product Pricing Scraping:
Newcastle upon Tyne, Glasgow, Liverpool, Wolverhampton, Portsmouth, Birmingham, Dudley, Preston, Derby, Leicester, Brighton, Manchester, London, Southampton, Edinburgh, Hull, Sheffield, Bristol, Cardiff, Belfast, Northampton, Coventry, Plymouth, Nottingham, Leeds, Stoke-on-Trent, Luton, Swansea, Aberdeen and Southampton.
Conclusion
Data is the lifeblood of eCommerce success, and Next.co.uk Product Pricing Scraping is your gateway to staying ahead in the competitive retail landscape. By leveraging this service, businesses can gain a significant edge in pricing strategies, inventory management, and customer engagement.
At DataScrapingServices.com, we prioritize accuracy, efficiency, and compliance, delivering tailored solutions to meet your specific business needs.
📩 Get started today by reaching out to [email protected].
#ecommercedatascraping#nextukscraping#productpricinginsights#datadrivendecisions#retailanalytics#datascrapingservices#marketintelligence#competitiveedge
0 notes
Text
How can retailers benefit from unifying their online platforms and POS data using Power BI?
Unifying online platform and POS data with Power BI gives retailers a complete 360° view of their business. It helps them track sales trends, monitor inventory in real time, and understand customer behavior across channels all in one dashboard.
With visual insights and automated reports, retailers can make faster, data-driven decisions on everything from stock planning to marketing strategies. It’s a game-changer for businesses looking to stay agile and competitive in today’s digital-first retail world.
1 note
·
View note
Text
The Business Case for Dynamic Pricing in Modern Retail
Pricing is no longer a static number printed on a tag. In today’s hyper-competitive, data-rich environment, it’s a strategic lever that can shift in real-time, based on demand, competitor moves, inventory levels, customer behavior, and even the weather.

Welcome to the world of dynamic pricing, where retail data analytics takes center stage. Retailers that embrace AI-driven pricing strategies aren’t just reacting to the market—they’re shaping it.
Let’s explore why dynamic pricing has become essential in modern retail and how data analytics in retail industry is enabling businesses to optimize revenue, stay competitive, and delight customers in the process.
What Is Dynamic Pricing?
Dynamic pricing refers to the real-time adjustment of product prices based on a variety of factors, like supply and demand, customer interest, competitor pricing, seasonality, and more. Unlike traditional fixed pricing, this model leverages algorithms and data streams to calculate the optimal price at any given moment.
Think about how airlines and ride-sharing apps constantly adjust fares. Retail is heading in the same direction, and with the right tools in place, it's becoming just as agile.
Why Dynamic Pricing Matters Today
The modern retail landscape is complex:
Shoppers compare prices online and offline before buying.
Inventory costs are rising due to supply chain volatility.
Competitors launch flash sales at the click of a button.
Customer expectations around fair pricing and discounts are evolving.
In this environment, relying on seasonal markdowns or static pricing rules just isn’t enough. You need retail data analytics to make smarter, real-time pricing decisions that protect your margins and increase conversions.
How Retail Data Analytics Powers Dynamic Pricing
At the core of dynamic pricing is data—lots of it. Here's how data analytics in the retail industry enables smarter pricing strategies:
Real-Time Market Intelligence By continuously monitoring competitor pricing, inventory levels, and online trends, analytics tools provide a live view of the market. Retailers can automatically adjust their prices to stay competitive without sacrificing profitability.
Example: If a competitor drops the price of a trending product, your system can instantly match it or offer a bundled alternative.
Demand Forecasting and Elasticity Modeling AI models use historical sales data, seasonal trends, and customer behavior to predict future demand and understand how price changes will affect sales volume. This ensures you're not underpricing high-demand items or overstocking slow movers.
Example: During peak season, pricing engines can slightly increase the price of bestsellers without hurting sales—maximizing revenue.
Customer Segmentation and Personalization Not all customers respond to pricing the same way. Retail analytics can segment your audience and personalize discounts or price offers based on buying history, loyalty tier, or cart behavior.
Example: Offer returning customers a 5% loyalty discount, while new users get a first-time offer—both driven by the same dynamic pricing engine.
Inventory-Aware Pricing With real-time inventory data feeding into pricing models, retailers can increase prices for low-stock, high-demand items and offer targeted discounts for overstocked SKUs.
Example: If a certain color of jacket is selling out fast, raise its price slightly. Meanwhile, offer discounts on slower-selling colors.
Business Benefits of Dynamic Pricing
For retail decision-makers—CEOs, pricing managers, and marketing heads—dynamic pricing offers significant advantages:
Revenue Optimization: Capture more margin on high-demand products without losing sales.
Inventory Efficiency: Clear out excess stock faster through targeted pricing strategies.
Competitive Advantage: React to market shifts in real-time, not days later.
Customer Satisfaction: Offer personalized and timely deals that increase conversion and loyalty.
With the right strategy and tools, dynamic pricing becomes a driver of both short-term wins and long-term growth.
Key Technologies Behind Dynamic Pricing
Dynamic pricing isn’t manual—it relies on intelligent systems that process data at scale. Here’s what a modern setup typically includes:
Data platforms that unify inventory, sales, and competitor data.
AI and machine learning models to predict demand and price elasticity.
Pricing engines that automatically calculate and update prices across channels.
Retail dashboards to track performance and override rules if needed.
This tech stack is rapidly becoming essential for retailers that want to stay nimble and profitable.
Getting Started with Dynamic Pricing
Here are a few tips for businesses looking to adopt dynamic pricing:
Start with pilot products: Test on a select group of SKUs before scaling across categories.
Establish pricing guardrails: Set minimum and maximum price thresholds to protect brand image.
Invest in analytics infrastructure: Ensure your team has access to clean, real-time data streams.
Collaborate across departments: Pricing impacts marketing, operations, and finance, so alignment is key.
Remember: It’s not just about changing prices, it’s about using pricing as a strategic tool fueled by retail data analytics.
Final Thoughts
As retail continues to digitize, dynamic pricing is shifting from innovation to expectation. With powerful data analytics in the retail industry, businesses can move from reactive markdowns to proactive price optimization, improving margins while delivering value to the customer.
The question isn’t whether you should adopt dynamic pricing—it’s how quickly you can build the right foundation to make it work.
0 notes
Text
Unlock the Secret to Smarter Online Sales with Predictive Analytics in Ecommerce
In the ever-competitive ecommerce world, staying ahead means knowing what your customers want, before they even ask. That’s the power of predictive analytics in ecommerce.
This blog breaks down how top brands are using predictive models to: 🔍 Understand buying behavior and personalize experiences 📦 Optimize inventory and manage supply chains 📊 Forecast trends and boost customer retention
Whether you’re a digital retailer, ecommerce strategist, or product head, this read offers practical insights to turn data into profits and browsers into buyers.
#PredictiveAnalyticsInEcommerce#EcommerceGrowth#DataDrivenRetail#CustomerInsights#SmartCommerce#SalesForecasting#BusinessIntelligence#KodyTechnolab#RetailAnalytics#EcommerceOptimization#AIInEcommerce#DigitalRetailStrategy#DataScienceInEcommerce#TechForRetail
0 notes