#What Is Statistical Analysis
Explore tagged Tumblr posts
Visit Tumblr Blog
Explore Tumblr blogs with no restrictions, modern design and the best experience.
Last Seen Tumblr Blogs


Fun Fact
When “GIF” was named word of the year in 2012, Oxford Dictionaries U.S.A. credited Tumblr for pushing the word.
Text
What Is Statistical Analysis? Key Concepts with Examples

Statistical analysis is a powerful tool used to interpret and make sense of data, helping to uncover patterns, trends, and insights that are not immediately apparent. By applying statistical methods, researchers and analysts can draw meaningful conclusions and inform decision-making across various fields, from business and healthcare to social sciences and beyond. In this blog, we will explore what is Statistical Analysis, fundamental concepts of statistical analysis and provide practical examples to illustrate its application.
Understanding Statistical Analysis
At its core, statistical analysis involves collecting, reviewing, and interpreting data to make informed decisions. It combines mathematical theories and techniques to analyze numerical data and extract useful information. The process typically involves several key steps: data collection, data organization, data analysis, and interpretation.
Key Concepts in Statistical Analysis
Descriptive Statistics
Descriptive statistics summarize and describe the main features of a dataset. They provide a simple overview of the data, often through measures such as:
Mean: The average value of a dataset. For example, if the test scores of five students are 80, 85, 90, 95, and 100, the mean score is (80+85+90+95+100)/5 = 89.
Median: The middle value when the data is sorted in ascending or descending order. For the same test scores, the median is 90.
Mode: The most frequently occurring value in a dataset. If the scores were 80, 85, 90, 90, and 100, the mode would be 90.
Standard Deviation: A measure of the amount of variation or dispersion in a dataset. It indicates how much individual data points deviate from the mean.
Inferential Statistics
Inferential statistics allow us to make predictions or inferences about a population based on a sample of data. Common techniques include:
Hypothesis Testing: This involves making an assumption (the hypothesis) about a population parameter and then using statistical tests to determine if the sample data supports or rejects this assumption. For example, testing whether a new drug is more effective than an existing one involves setting up null and alternative hypotheses and analyzing clinical trial data.
Confidence Intervals: These provide a range of values within which we can be reasonably certain the true population parameter lies. For example, a confidence interval for the average height of a population might be 65-67 inches with 95% confidence.
Regression Analysis: This technique assesses the relationship between dependent and independent variables. For example, regression analysis can determine how factors like age, income, and education level affect an individual's spending behavior.
Probability
Probability is a fundamental concept in statistics that measures the likelihood of an event occurring. It is used to make predictions and assess risk. For instance:
Basic Probability: If a die is rolled, the probability of getting a six is 1/6, as there is one favorable outcome out of six possible outcomes.
Conditional Probability: This measures the probability of an event occurring given that another event has already occurred. For example, if a card is drawn from a deck and it is known to be a spade, the probability of it being a queen is 1/13.
Correlation and Causation
Correlation: This measures the strength and direction of the relationship between two variables. A positive correlation means that as one variable increases, the other does too, while a negative correlation indicates that as one variable increases, the other decreases. For example, there might be a positive correlation between hours studied and exam scores.
Causation: Unlike correlation, causation implies that one variable directly affects another. Establishing causation typically requires experimental or longitudinal studies. For instance, a well-designed experiment might show that increasing exercise leads to improved cardiovascular health.
Examples of Statistical Analysis in Action
Business: A company might use statistical analysis to evaluate customer satisfaction surveys. By analyzing the responses, the company can identify key areas for improvement, measure the effectiveness of changes made, and predict customer retention rates.
Healthcare: Researchers can apply statistical analysis to clinical trials to assess the effectiveness of new treatments. By comparing the health outcomes of patients receiving the treatment versus a control group, they can determine whether the new treatment is beneficial.
Social Sciences: Statisticians in social sciences might analyze survey data to understand public opinion on various issues. For example, they might use regression analysis to explore how demographic factors influence voting behavior.
Conclusion
Statistical analysis is an essential tool for understanding and interpreting data across various domains. By mastering key concepts such as descriptive and inferential statistics, probability, and the distinction between correlation and causation, individuals can make more informed decisions and derive actionable insights from data. Whether in business, healthcare, or social research, statistical analysis provides a framework for making sense of complex data and addressing real-world questions with precision and confidence.
0 notes
Text
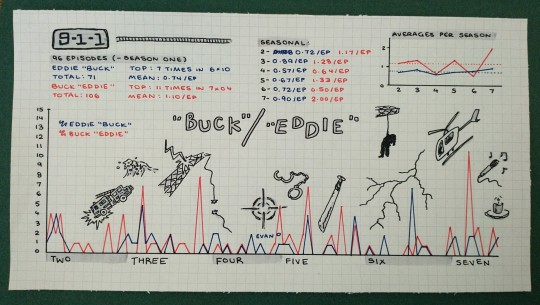
GRAPH IS COMPLETE!!! (Showing the frequency that Buck and Eddie say each others' names)
This one has the rest of the season 7 data, some corrected stuff and some added statistics for everyone because we all love statistics (I did this instead of revising for my actual statistics exam but if the a level paper is 9-1-1 based I will be all set). I have another graph coming but it's talking longer to track and I have exams so it'll be a while. Let me know if you have any questions or concerns!!!
#911 abc#graphs and such#9-1-1#buddie#evan buckley#eddie diaz#911 season 7#9 1 1#911 show#jwpyyy#911 fanart#911 meta#idk what to tag this#911 graph#statistics#my art#analysis ones#art ones#tops#500
952 notes
·
View notes
Text
reading back your old essays is so crazy what is this woman even talking about. she's so smart. i have no idea what any of this means
#any time she (my past self) starts talking about statistical analysis i'm completely lost#what the fuck is an ancova. you're just making things up now#personal
39 notes
·
View notes
Text
Okay, I've spoken to several of you who like both of these things and I need to know how deep this runs because it's an 'if I had a nickel for each time this thing happened, I'd have (x) nickels, which isn't a lot but it's weird that it's happened (x) times' thing-
#contestshipping#shuuharu#totally ok to rb/add commentary in the tags. i am so nosy#I am TRULY curious because I have anecdotally/personally found such a huge overlap lmao. I can name like five or six of you.#which-again- not a lot but given the community's dwindling current size that feels rather notable?#it makes total sense to me tbh. obviously there's large differences#but I feel like it taps into a similar 'poorly socialized guy x the girl who hates him but oh wait there's mutual growth because of E/O'-#- kinda thing.#again obviously there's way more to P&P than that. literary besties don't kill me. but like you see my simplified point right lol?#there's also way more to Lizzie and Darcy than that but you know what I meannnnnnnnnnn#sorry for the disclaimers but i can hear the 'shipping has ruined your ability to do literary analysis' brigade from here lmfao.#like okay well maybe for you. i can multitask but this is my shippy blog so of course I'm focusing on that part more BUT ANYWAYS#i've just met way too many people who like both things for me to not make a poll about it at this point.#or is it just a thing of how p&p is so popular and iconic that ANY random fandom niche would have a similar overlap???#idk. does anyone want to make a poll for their fandom niche and see if it's just a P&P thing???#let's compare. besties. let us band together#someone else do this for their own ship/corner/niche/etc#and of course tumblr polls are statistically useless in most ways available BUT it's interesting.
5 notes
·
View notes
Text
discovering Where The Math Is in something confusing is always such an immense relief
#been trying to learn data analysis for MONTHS now and i only just got a good big picture understanding of What It Is lmao#like. okay. you have some data#you come up with a clearly-defined question. you clean your data#you decide what statistical test is appropriate to answer the question & appropriate for your data#and. CRUCIALLY. deciding which one is Appropriate isnt just some sort of witchcraft!! they all have assumptions built in#often because of how theyre calculated#THATS JUST MATH!!!! i know how to do that#''you can only apply this thing in specific circumstances'' thats a theorem basically. 90% of my coursework in uni was theorems and proofs#still need to practice actually DOING data analysis & im sure ill run into some problems but. hooray! i think i know how to do this!#personal#numbers do not lie
6 notes
·
View notes
Text
What Are the Qualifications for a Data Scientist?
In today's data-driven world, the role of a data scientist has become one of the most coveted career paths. With businesses relying on data for decision-making, understanding customer behavior, and improving products, the demand for skilled professionals who can analyze, interpret, and extract value from data is at an all-time high. If you're wondering what qualifications are needed to become a successful data scientist, how DataCouncil can help you get there, and why a data science course in Pune is a great option, this blog has the answers.
The Key Qualifications for a Data Scientist
To succeed as a data scientist, a mix of technical skills, education, and hands-on experience is essential. Here are the core qualifications required:
1. Educational Background
A strong foundation in mathematics, statistics, or computer science is typically expected. Most data scientists hold at least a bachelor’s degree in one of these fields, with many pursuing higher education such as a master's or a Ph.D. A data science course in Pune with DataCouncil can bridge this gap, offering the academic and practical knowledge required for a strong start in the industry.
2. Proficiency in Programming Languages
Programming is at the heart of data science. You need to be comfortable with languages like Python, R, and SQL, which are widely used for data analysis, machine learning, and database management. A comprehensive data science course in Pune will teach these programming skills from scratch, ensuring you become proficient in coding for data science tasks.
3. Understanding of Machine Learning
Data scientists must have a solid grasp of machine learning techniques and algorithms such as regression, clustering, and decision trees. By enrolling in a DataCouncil course, you'll learn how to implement machine learning models to analyze data and make predictions, an essential qualification for landing a data science job.
4. Data Wrangling Skills
Raw data is often messy and unstructured, and a good data scientist needs to be adept at cleaning and processing data before it can be analyzed. DataCouncil's data science course in Pune includes practical training in tools like Pandas and Numpy for effective data wrangling, helping you develop a strong skill set in this critical area.
5. Statistical Knowledge
Statistical analysis forms the backbone of data science. Knowledge of probability, hypothesis testing, and statistical modeling allows data scientists to draw meaningful insights from data. A structured data science course in Pune offers the theoretical and practical aspects of statistics required to excel.
6. Communication and Data Visualization Skills
Being able to explain your findings in a clear and concise manner is crucial. Data scientists often need to communicate with non-technical stakeholders, making tools like Tableau, Power BI, and Matplotlib essential for creating insightful visualizations. DataCouncil’s data science course in Pune includes modules on data visualization, which can help you present data in a way that’s easy to understand.
7. Domain Knowledge
Apart from technical skills, understanding the industry you work in is a major asset. Whether it’s healthcare, finance, or e-commerce, knowing how data applies within your industry will set you apart from the competition. DataCouncil's data science course in Pune is designed to offer case studies from multiple industries, helping students gain domain-specific insights.
Why Choose DataCouncil for a Data Science Course in Pune?
If you're looking to build a successful career as a data scientist, enrolling in a data science course in Pune with DataCouncil can be your first step toward reaching your goals. Here’s why DataCouncil is the ideal choice:
Comprehensive Curriculum: The course covers everything from the basics of data science to advanced machine learning techniques.
Hands-On Projects: You'll work on real-world projects that mimic the challenges faced by data scientists in various industries.
Experienced Faculty: Learn from industry professionals who have years of experience in data science and analytics.
100% Placement Support: DataCouncil provides job assistance to help you land a data science job in Pune or anywhere else, making it a great investment in your future.
Flexible Learning Options: With both weekday and weekend batches, DataCouncil ensures that you can learn at your own pace without compromising your current commitments.
Conclusion
Becoming a data scientist requires a combination of technical expertise, analytical skills, and industry knowledge. By enrolling in a data science course in Pune with DataCouncil, you can gain all the qualifications you need to thrive in this exciting field. Whether you're a fresher looking to start your career or a professional wanting to upskill, this course will equip you with the knowledge, skills, and practical experience to succeed as a data scientist.
Explore DataCouncil’s offerings today and take the first step toward unlocking a rewarding career in data science! Looking for the best data science course in Pune? DataCouncil offers comprehensive data science classes in Pune, designed to equip you with the skills to excel in this booming field. Our data science course in Pune covers everything from data analysis to machine learning, with competitive data science course fees in Pune. We provide job-oriented programs, making us the best institute for data science in Pune with placement support. Explore online data science training in Pune and take your career to new heights!
#In today's data-driven world#the role of a data scientist has become one of the most coveted career paths. With businesses relying on data for decision-making#understanding customer behavior#and improving products#the demand for skilled professionals who can analyze#interpret#and extract value from data is at an all-time high. If you're wondering what qualifications are needed to become a successful data scientis#how DataCouncil can help you get there#and why a data science course in Pune is a great option#this blog has the answers.#The Key Qualifications for a Data Scientist#To succeed as a data scientist#a mix of technical skills#education#and hands-on experience is essential. Here are the core qualifications required:#1. Educational Background#A strong foundation in mathematics#statistics#or computer science is typically expected. Most data scientists hold at least a bachelor’s degree in one of these fields#with many pursuing higher education such as a master's or a Ph.D. A data science course in Pune with DataCouncil can bridge this gap#offering the academic and practical knowledge required for a strong start in the industry.#2. Proficiency in Programming Languages#Programming is at the heart of data science. You need to be comfortable with languages like Python#R#and SQL#which are widely used for data analysis#machine learning#and database management. A comprehensive data science course in Pune will teach these programming skills from scratch#ensuring you become proficient in coding for data science tasks.#3. Understanding of Machine Learning
3 notes
·
View notes
Text
i am biting maiming screaming at my supervisor
#LIKE I GET IT YOU HATE ME#JUST TELL ME WHAT FUCKING STATISTICS ANALYSIS TO USE#I AM NOT A MATHS GIRLIE I CAME FROM A FUCKING ARTS DEGREE#AND SHE DIDNT EVEN ANSWER ONE OF MY QUESTIONS#fuck this shit man i’m speaking to the student advocates
3 notes
·
View notes
Text
i wasted all of my afternoon and now i have a lot of things to do but not enough time
#ive written about 500 words#i need 1000 more 😬#i have to write about 2 more of the questionnaires so I'll try to make that 500 and then leave the rest for the statistical analysis part#which will have to wait until after we do the statistic analysis so that we can accurately say what we used#i think ill shower and then keep writing#that way whenever i get too tired i can just stop#or i can leave the rest of the methodology for tomorrow morning bc i can do that from my phone#and work on the introduction a bit tonight#but i want to go to sleep early cause the more sleep i get the less tired ill be tomorrow the less ill need to nap the more time ill have#ugh stupid internship is draining all my energy#jo says stuff#university update
5 notes
·
View notes
Text
it’s crazy like actually insane that i can’t find historical demographic analyses of childlessness rates among women of any time period before the 1800s. that seems like it should be such a interesting illustrative statistic in and of itself but also as an indicator of broader social/economic/religious/political/environmental conditions. it’s a statistic that establishes something entirely distinct from what you get out of an average birth rate...
OK NVM post kind of cancelled i'm finding a couple articles. but nothing that's really what i'm looking for/what i'd be wanting answers to. w/e do i sound insane/is this already obvious
#like they're bringing it up as something that was discussed/understood in the period but not how frequent it was and what factors informed#its presence#like there are time periods in many locations prior to the late modern period that would theoretically have administrative#records/census data collection that you could use to extract this statistic/analysis. i wonder if my jstor/school#library searches just aren't properly describing what i'm thinking of.#sorry. im high#a
4 notes
·
View notes
Text
staring at this r file like a whimpering wet dog that's scared of the unfamiliar surroundings yet hopeful it may have found a warm place to sleep
#nina.txt#sorry. losing all relatability by yet again posting about niche topics no one cares about#but. okay. i maybe shouldve checked how thorough my notes on how to use r are#*before* i volunteered to do the first dive into the statistical analysis of this data#because i have no idea what im doing and my notes are not helping#and again. i worked with r before and thought it was pretty easy to use and what we're doing isnt even that complicated#and yet! ive been staring at this file for like two hours and i have two commands written. which is. well. hm. not good#but i know i *can* be good at it i can do this i just. dont know how just yet#anyway! enough venting back to my number 🫡
2 notes
·
View notes
Text
considering how terrible just a single Chatgpt prompt is for the environment, seeing this pop up everywhere in everything really has me extra worried for the future of the planet. Like this will cause a lot of harm in other ways too, but also it's immediately causing harm now.
got a major pest problem this year actually


#I might defend the computer scientists here and guess that they were not the driving force behind even creating this iteration of ai#machine learning has been around for a while as an important statistical analysis tool trained on specific data sets#I feel like the idea 'what if the data set we used to train it...was the whole internet?'#was likely pushed more by the tech ceo type people
155K notes
·
View notes
Text
THE IRONYYYYY
#had an overdue assignment & realised submission portal is now closed & like. the reason why I haven't finished it? because it was too simple#& i overcomplicated & then had to pull back & then trying to do the actual assignment at the intended scope was like pulling teeth#i should've just. followed through on my idea. but we were not taught how to do the statistical tests required for that kind of analysis & i#didn't wanna ask questions because it was already overdue & also what i wanted to do was NOT PART OF THE ASSIGNMENT#so... ig I'll just. not get any marks#this is my own doing. i am conseing my quences#well good news is I've done well in my other assignments... at least the ones that have been marked#so unless something goes terribly wrong i should at least pass the course#hhhh
0 notes
Text
Finished my last midterm for my degree today... feeling dread. Can't get an entry level data scientist position 💔 became a math and statistics machine in the last 4 years but my downfall was only receiving basic training on SQL
#now I have to set aside free time to learn more coding languages#and business data analytics software :(#but hey maybe I can do some cool statistical experiments solo to build my portfolio#get ready for a disco elysium ao3 analysis#gonna webscrape ao3 and analyze for trends in what fics get the most engagement 🫣
0 notes
Text
ahhhh i've talked to so many people about wanting to do research in academia, whyyy didn't anybody tell me what a cv is 😭😭😭
#ahhh i've been asked for one and didn't anticipate it#i gotta whip up a good one#it's like a resume but longer?? and more specific#bro i dont feel confident writing a resume#although maybe thats just my anxiety#pls wish me luck i really want to get into this lab#i dont know for sure that many of my academic achievements are relevant or what theyre looking for but ive been talking to a physiologist#about a lab assistant job where i would primarily do observation and statistical analysis on rodent physiology#i havent told my family about it yet in case it falls through#pls wish me luck i know i said that ahhhhh my impostor syndrome!!!#shut up kaily
0 notes
Text
liveblogging my descent into madness
#okay okay okay okay okay okay okay#my supervisor set a new deadline for Now. tonight#bc he wants to meet tomorrow 2 with more draft to talk about#rn im on 4 full pages and trying to figure out what the hell my analysis would practically look like step by step#which is hard when im not that good at stats and this is actually one of the things he should be helping me with#and he evaded questions when I did ask him abt#but! getting annoyed doesn’t help me now#I am putting together bullet point steps to help me get my head round it bc it’s midnight and I’m having trouble like#keeping how exactly the methods work straight in my head#generalised linear mixed models! woo!! I don’t know whether they substitute for finding an association between two factors first or are like#subsequent step to that. more refined. gives amount of variance in x due to y that can be explained by z factor#if I had more time I’d be able to figure this out and I will want to ask about this so maybe that’s worth leaving for now as long as I know#roughly what outputs I’m expecting and what things I’ll need to separate for each hypothesis#ohhhhhhh wait I’m describing summary statistics. Im saying I’ll do summary statistics for each factor first before I do a glmm#eg for spatial effect I need to see the correlation between distance and occupancy in individual sites#and whether there’s a difference in the average distance between my two groups#wait so that’s not a correlation it’s comparing two categories and seeing whether their distributions differ which. anova? non parametric?#dude i have no idea at this point I think this is smth I have to ask about#okay. so I haven’t touched my extension section and I want to have something there that he can give feedback on#so for each of my objectives I’ll detail an experiment I couldn’t do that would advance the objective somehow#in the first two that’ll be quantification#or do I do that? what did he say last week#okay im going now I got shit to do#deeply sorry to anyone who is still reading these science is hard and I’m TIRED#luke.txt
1 note
·
View note
Text

According to a new report published Wednesday by the Pew Research Center, you live in a deeply embarrassing and barely functional country. “Our latest research and statistical analysis shows that you are currently the citizen of an objectively humiliating nation wreathed in a miasma of pettiness, sloth, rank stupidity, and failure,” the report read in part, adding that this—this goddamned disgrace of a culture and system of government, if that’s what you call whatever the hell this is—is where you live, where you are from, and where you will likely die.
Full Story
4K notes
·
View notes