#Winforms Graphs
Explore tagged Tumblr posts
Visit Tumblr Blog
Explore Tumblr blogs with no restrictions, modern design and the best experience.
Last Seen Tumblr Blogs


Fun Fact
China blocked Tumblr because of pornography and censorship problems in 2013.
Text
C# Tutorial - Live Chart Graph Controls in WinForm App | FoxLearn
How to use CartesianChart with LiveChart control in C# Windows Forms Application lvcharts is simple, flexible, interactive and … source
0 notes
Text
What are WPF and WPF Charting Controls?
Original Source : https://arctionltd.blogspot.com/2020/02/what-are-wpf-and-wpf-charting-controls.html
Many people are working in the professional world. Therefore, a lot of people require software that help them in getting their work done in an efficient manner. Therefore, WPF was designed to bring better working in the profession. The word WPF stands for Windows Presentation Foundation. It is used by a lot of people and enables various features and benefits. It considered as an effective way of linking things in an application or software. It is one of the most advanced ways of bringing better functionality to windows applications.
WPF (windows presentation foundation)
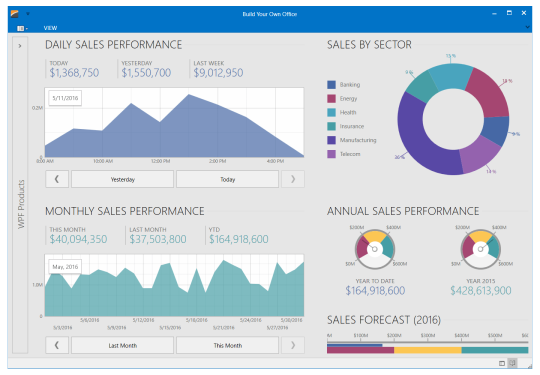
Windows presentation foundation helps in rendering the user interface components for different applications. It is very much similar to the windows forms with a very slight difference. It is also a part of the .Net framework. Thus, windows presentation foundation (WPF) brings all the user interface tools and methods that help in making a certain information or things look much better and provide accurate functionality. It helps in enhancing the application. The windows presentation foundation also provides you the facility to create a quality application that works very well and brings out the best from the application. It is such a great way of handling the entire framework of .Net And build applications that have a great user interface and work very much efficient. The WPF charting controls are very much useful while developing an application, to visualize data.
Features of WPF(windows presentation foundation)

The following are the various features of WPF(windows presentation framework):-
1. Direct 3D
This feature helps in making better 3D art as it is responsible for providing better graphics or images, but has handicaps: built in System.Windows. Media graphics interface is not efficient in performance. Therefore, low-level DirectX rendering attached with WPF gives the optimal performance.
2. Data binding
It also helps a lot in binding the data and properties.
3. Media service
It is very much efficient in providing media services.
4. Templates
It has many templates that help in displaying the information through the application in an efficient manner.
5. Animations
This allows the WPF to explore the possibility of providing animated graphics.
6. Imaging and effects
It is also very much useful in adding effects to the various graphical components.
7. Documentation
It involves the proper arrangement of the data in an effective way.
8. Text facility
You can make the text more appealing through the various graphical attributes of the WPF.
9. Alternative input
It is quite amazing how the alternative input works in the WPF.
10. Interoperability
It provides the feature to make the application work in a flexible way on various devices.
11. Accessibility
It has all the working and management done in a productive and efficient manner.
Thus, all these features make the website and other applications handle the work well. WPF (windows presentation foundation) involves all the various graphic elements and binds them together to bring out the best Wpf Charts Library. It creates good quality applications that are used by various people. It enables the developer to make such an application that satisfies all the needs of the client.
#Wpf Chart Control#Wpf Line Charts#Wpf Charts#Wpf Charting Controls#Winforms Graphs#Web Charts Library#Wpf Charts Library#Javascript Charting Components#Uwp Charts#Webgl Charts Library
0 notes
Text
F# Weekly #49, 2018 – F# Tooling Update and gifts from F# Advent bloggers
F# Weekly #49, 2018 – F# Tooling Update and gifts from F# Advent bloggers
Welcome to F# Weekly,
A roundup of F# content from this past week:
News
Announcing ML.NET 0.8 – Machine Learning for .NET
Announcing .NET Core 3 Preview 1 and Open Sourcing Windows Desktop Frameworks
Announcing .NET Core 2.2
Take C# 8.0 for a spin
Announcing .NET Framework 4.8 Early Access build 3694
Announcing WPF, WinForms, and WinUI are going Open Source
Graph view for ast-viewer is live!
SAFE:
View On WordPress
0 notes
Text
New Windows 10 SDK now available with Visual Studio 15.9.1

New Windows 10 SDK now available with Visual Studio 15.9.1. What’s in this update: Windows UI Library (WinUI) allows you take advantage of the latest Fluent controls and styles for Windows 10 apps without having to wait for all your customers to update to the latest OS version. The WinUI nuget package is backward-compatible, down to Windows 10 version 1607 (Anniversary Update) and includes the same powerful, supported controls that Windows uses in its apps and experiences. UWP XAML hosting API (Preview) allows ‘islands’ of UWP XAML UI elements to be hosted in applications built using non-UWP technologies such as Windows Forms, WPF, or C/C++ Win32, eliminating the need to re-write or re-package your application for UWP. We’ve created a set of WPF and WinForms wrappers for common UI elements that developers can use to save time. Adaptive Cards 1.1 boosts feature additions such as Media Element and Action Icons and building cards easier with the new visual designer. Adaptive Cards is available in Outlook as Actionable Messages, in Cortana with Skills, and Teams through Azure Bot Service. Graph Notifications (Preview) offers an enterprise-compliant, people-centric, and cross-platform notifications platform using Microsoft Graph. The tech preview supports iOS, Android, Windows, and the Graph Explorer. Project Ink Analysis allows you to write applications that allow users to draw and express themselves and offers the capabilities to understand/recognize and make the ink more productive. This is the same technology we use to power Office today. Hyper-V allows Android developers on Windows to enjoy a fast Android emulator running the latest Android APIs, all on Hyper-V. The minimum requirements to run this are Windows 10 version 1803 on an x86 based machine and Visual Studio v15.8 for IDE support. It’s easier to start using the new Windows Machine Learning API, as it’s the same for both Win32 and UWP applications. New capabilities include: support for ONNX v1.2.2 models, converting FP32 datatypes in ONNX models to use FP16, support for Windows Server 2019, and improved evaluation times on the CPU and GPU. Read the full article
0 notes
Text
C# Tutorial - Live Chart/Graph in C# Winforms Application | FoxLearn
Live Chart/Graph using LiveCharts control help you create c# graphs and charts windows application using c# chart control. source
0 notes
Text
What Are the New Features of LightningChart .NET V.10.0?
Original Source: https://arctionltd.blogspot.com/2021/01/what-are-new-features-of-lightningchart.html
Web developers have to incorporate graphs and charts on their web development projects. Using graphs and charts can help the data to be represented in a flawless manner. It helps the readers to interpret complex data in a simpler way. For adding charts and graphs, developers use professional charting library. If you want .NET charting library, LightningChart .NET is an excellent product for you. Developed by Arction, this charting library for .NET has hundreds of interactive charts to offer. At Arction, we have developed this charting library to support many demanding industries including engineering, finance, science, commerce, space, energy, defense, etc.
Features of LightningChart .NET
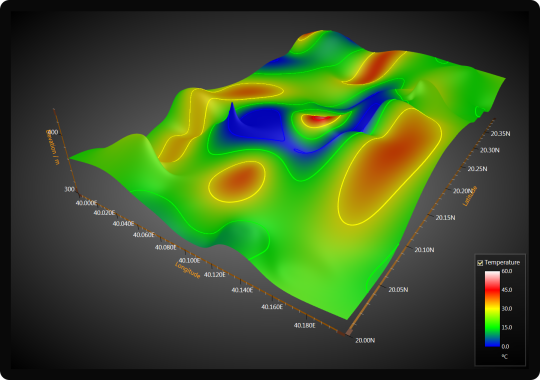
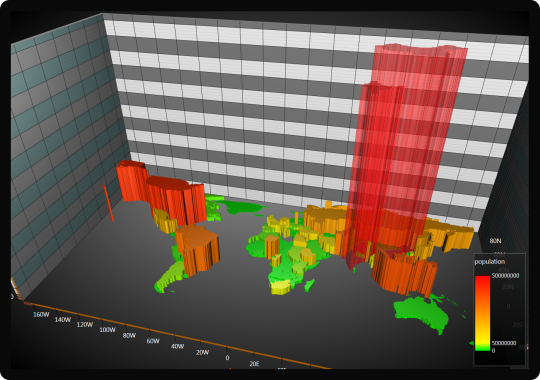
LightningChart comes with many useful features for the developers. It offers high performance, which makes the web development projects seamless and satisfactory for the clientele. Being a cost-effective platform, it helps the developers to earn better revenue through their projects. Another notable feature is the availability of 2D and 3D charts in the charting library. Along with 2D charts, demand is rising for 3D charts. We have developed LightningChart to offer fully customization to the users. Along with these features, the new version of the LightningChart comes with many new things in offering. So, what are the new features with LightningChart .NET V.10.0? You can find the answer in the following section.
What New We Offer?
Our LightningChart .NET V.10.0 comes with a few new things to offer to the users. LightningChart is available for both the WPF and WinForms applications. There are no differences in the features between WPF and WinForms charting controls. With the new version, we have made various improvements. Some of those improvements can be noted in the following section of this article.

UWP Platform
The major improvement with the new version of LightningChart is the support UWP platform. You can integrate our charting library to your UWP applications. It makes the process easier to create Microsoft Windows 10 based applications. You can create advanced charting applications for desktops, mobiles, Windows IoT devices, and XBOX. Not only different applications for different systems, but you can also develop different types of charts with our new version of LightningChart charting library. For example, you can build charts like 3D, 2D, Polar, Pie Charts, etc.
Faster Multiple 2D Series
With the new version of LightningChart, you can note many other improvements. Among those improvements, you can notice the faster performance for the multiple 2D series. Charting applications for multiple 2D series may become sluggish in performance. Hence, developers need charting controls that work faster. We have realized the demand of the modern-day developers, and thus we have turned the version 10 of LightningChart faster for dealing with multiple 2D series. Compared to LineCollection and PointLineSeries, our LighteningChart V.10.0 can deliver two to four times faster performance. For turning the API clearer, we have omitted all the obsolete properties and methods.
Improved Interactive Examples
We make endless efforts to provide improved interactive examples to users. With these improvements, developers can understand the crucial features LightningChart. They can easily extract example code projects. Addition of more examples makes things simpler for the new developers. These examples help the developers to learn the process of using charting libraries to create application with charts and graphs. For the new UWP platform, we have added 30 interactive examples. Many WPF projects were already there, and we have added some more interactive examples for WPF projects to help the developers. Browsing various examples has turned easier with the improved search function.
Built-in Functionalities
We have developed exclusive trader charts so that developers can create trading applications with ease. For making things even more convenient for them, trader charts come with built-in functionalities which include data cursors, color themes, data values, auto removal of non-trading time period, and many more. We have also introduced technical indicators for the trading charts, and these indicators can calculate data automatically based on the input parameters.
We are committed to add more improvements to LightningChart based on the feedback of the developers. Lightningfast performance and GPU-accelerated rendering are the features that developers will attain with our newly improved LightningChart .NET V.10.0. For support and more information, you can contact us anytime at Arction.
0 notes
Photo

With our amazing C# Graph, Winforms Graphs, Charts You get full DirectX hardware acceleration, superior 2D and 3D rendering performance and real-time data monitoring optimization. Get More Information: https://www.arction.com/c-graph
0 notes
Audio
With our amazing C# Graph, Winforms Graphs, Charts You get full DirectX hardware acceleration, superior 2D and 3D rendering performance and real-time data monitoring optimization. Get More Info: https://www.arction.com/c-graph/
0 notes
Text
Charting with PHP can help business more efficient
Original Source: https://arctionltd.blogspot.com/2019/12/charting-with-php-can-help-business.html
There can be no doubt that graphs and charts are an essential part of business ventures. They help in gauging different aspects of the business development projects. The PHP graphs will be making it quite easy to display various nuances of the business projects and reflect lots of data. There are a lot of business websites which should need to display graphically all their numerical data. Authors would need to fill these requirements by creating charts in some application and then posting. But there are several problems in this approach. By using HTML5 Charts and Winforms Scientific Charts, these problems can be alleviated.
What are the problems associated with using charting software:
When you want to update your chart with new data then you would have to redo the entire process all over again.
Charts will not be interactive. You cannot zoom in to the data and take a closer look.
There will not be any easy method for allowing the users in changing their datasets.
The charts will not be able to implement new themes.
In order to solve these issues, it is necessary to generate dynamic charts on your web pages. You can use Javascript codes to do this. It can take some time but the results would be amazing. You can make HTML5 charts and Winforms Scientific Charts also.
Using PHP for making charts
You can also use PHP to create graphs and charts. It is an inexpensive process which will give you total charting controls over what is written in PHP. So you can also easily integrate it in your WordPress and business website. PHP charts are easy to create and integrate. All you will need is two simple lines of script in order to render a new chart. The charts and graphs developed on PHP would be extremely flexible also. You can tweak various different aspects of these charts. The different aspects of the chart which you can modify are:
Chart type: bars, lines, stacks, banded lines, bubbles, pies, candlesticks, gauge, and so many more.
Change the axis, legends, different labels, titles, etc.
Customise the javascript to be dynamically changing the charts on the web page.
Rotate the text labels.
Multiple series would be displayed in one single chart.
How will the data be handled?
Data would be taken in the form of an array in the charting function. This will mean that you would need to extract the data from any sources you want. But you will have to parse these values into arrays which should be passed on to the chart’s script. You can control the chart with JavaScript to enable dynamic changes to get displayed.
Conclusion
To conclude, you can use PHP to create amazing dynamic charts which can reflect real time data changes in an accurate manner. This will help businesses to understand various market trends in a more comprehensive way. JavaScript charts would have more flexibility and dynamic features.
0 notes