#calculating velocity
Explore tagged Tumblr posts
Visit Tumblr Blog
Explore Tumblr blogs with no restrictions, modern design and the best experience.
Last Seen Tumblr Blogs


Fun Fact
The total number of visits Tumblr.com received during January 2021 is 327 million.
Text
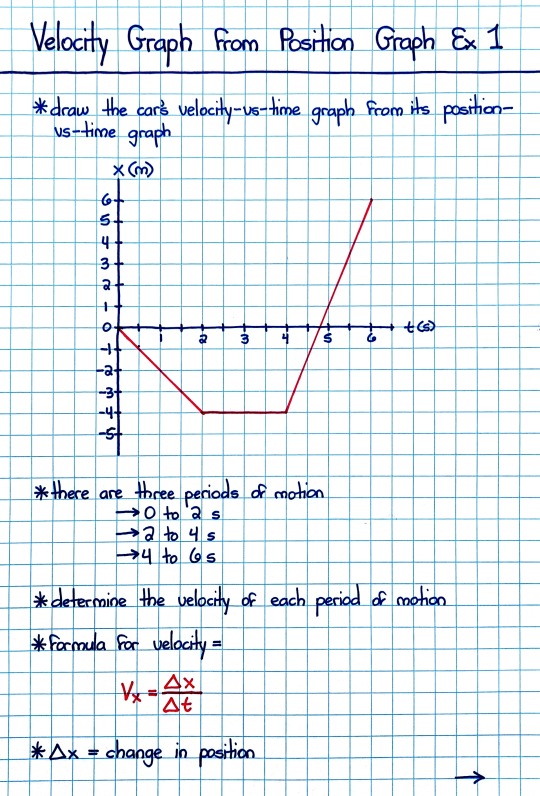
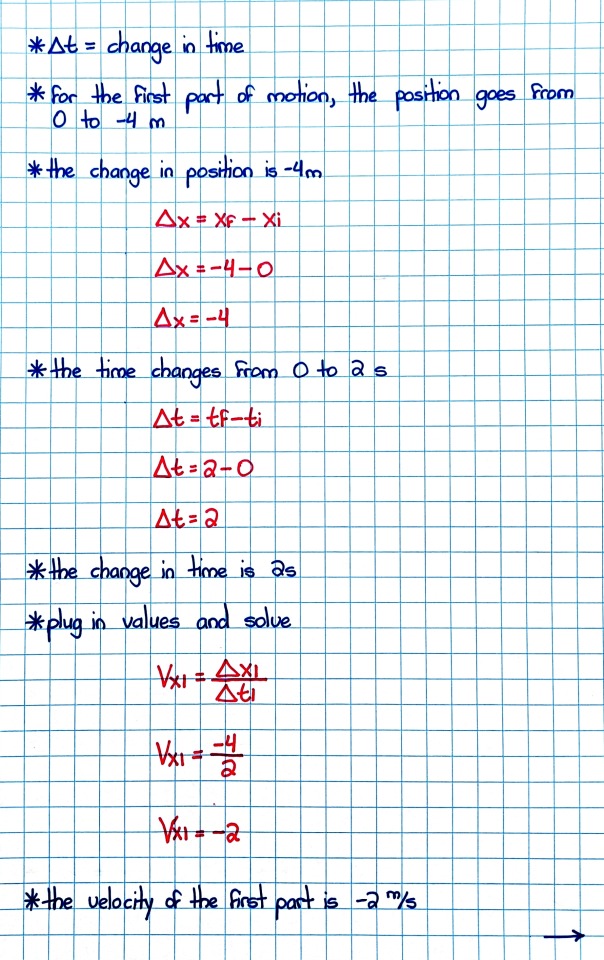
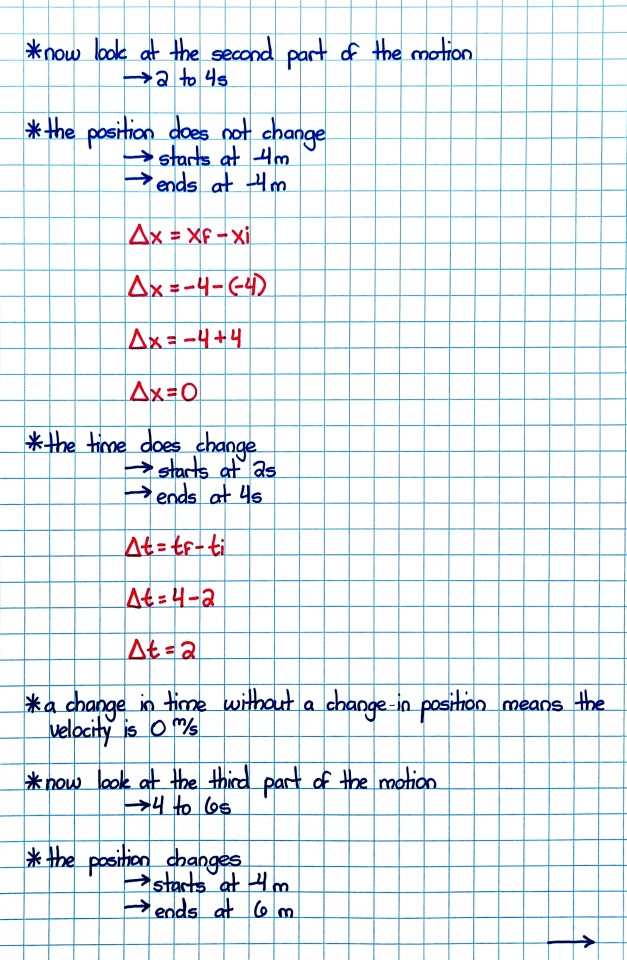
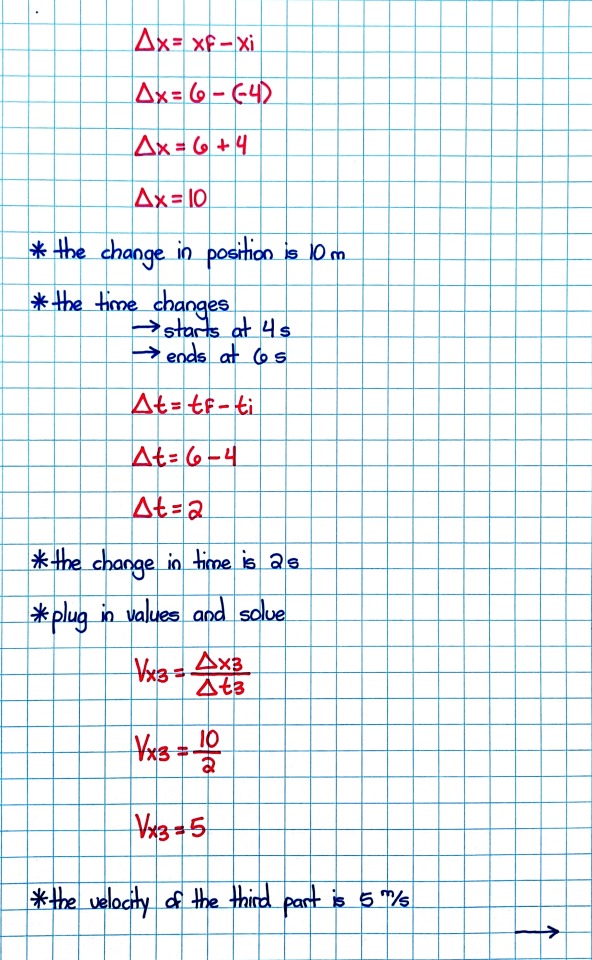
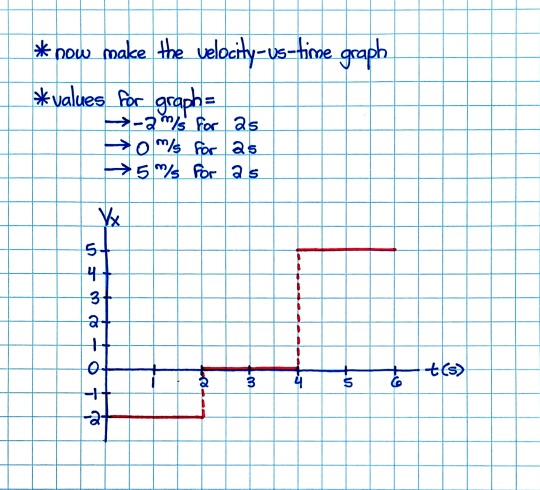
Velocity Graph from Position Graph [Ex. 1]
Patreon
#studyblr#notes#physics#physics 1#physics 2#velocity graph#position graph#velocity#position#position in physics#velocity in physics#velocity and position#position and velocity#distance#time#calculating velocity#calculating position#velocity from position#physics velocity#physics position#graphs in physics#physics graphs#my notes#physics notes#physics vocabulary#physics vocab#science#introductory physics#physics I#physics II
2 notes
·
View notes
Text
i calculated the terminal velocity of a coconut
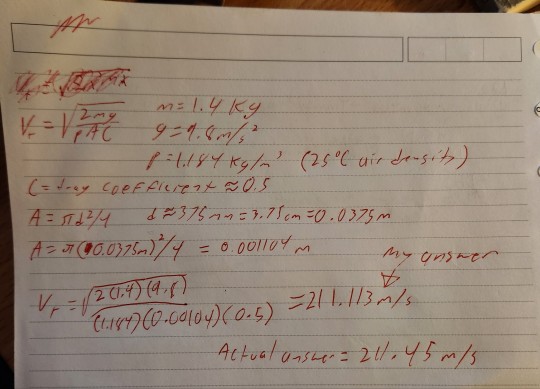
idk why i did this but I was 0.337 m/s off from the actual answer given by an online calculator so that's cool
#tell me if i did this shit wrong lol#there were a lot of assumptions cause i don't actually have a coconut here#i couldn't be fucked to calculate the projected area and drag of a coconut based on shit i couldn't test#so in reality it's a perfect sphere that's close to nasa's calculations of the drag coefficient of what a perfect sphere would be (0.5)#and the diameter of a coconut is apparently 300-450mm so i picked 375 cause why not#and used the sphere formula for that#i put in the calculations for the density of air into an online calculator too#so really it's the calculation of the terminal velocity of a perfect sphere around the same size and weight as a coconut#done as lazily as possible#and compared to another online calculator#physics#science
351 notes
·
View notes
Note
Because N has probably never been to school or learned math until the end of the series what would happen if he tried to help porter with math homework?
He's a robot pretty sure he has a built in calculator /lh
Porter is pretty good at math! Not her strongest subject but gets homework done fast (when she remembers)
#hes really good at calculating velocity and calculations bc he subconsciously uses them to help him fly and hunt tbh#porter doorman#serial designation n#ty for the ask!!#md headcanons
97 notes
·
View notes
Text

#ㅤꢾ꣒ kkamiyaps#is it obvious I can’t do physchem#pls send help#I don’t want to calculate the value of escape velocity for a satellite because it helps me in no way to become a future doctor#IS THAT TOO MUCH TO ASK FOR#physics hate#even chem is bearable#but PHYSICS????? fuck no
8 notes
·
View notes
Text
Brother in christ I didn't suffer through physics class to get CURBSTOMPED BY CALCULUS!
#we learning about calculating velocities and tangent lines#at first i was like 'yo i got this'#only to find THE MATH NOT MATHING!#ace rambles#vent
4 notes
·
View notes
Text
sometimes when i’m doing physics i feel like a renaissance man, but a lot of the time i just feel like a medieval knight being asked about the airspeed velocity of an unladen swallow
12 notes
·
View notes
Text
oscillations padh padh ke sar ghoom gaya hai
#😔🙏calculate the max velocity of my thoughts scattering if the length of my brain is 0.00000001mm#desiblr#chaotic academia#humor#memes#physics memes
12 notes
·
View notes
Text

How does Mario Kart 8 Deluxe speed translate into real-life units ?
This something we all have been wondering at some point as a civilized Mario Kart player.
This is also a thing that was pretty much not covered at all within the vast universe of Internet.
So we're going to work it out for the sake of players' curiosity.
Right off the bat, I already see some people coming with the : "No need for experiments, the whole topic is solved 'cause on Mario Kart 8 Deluxe CTGP shows you how fast you drive with a speedometer".
1) There is no way to evaluate, assume anything since the speedometer doesn't display any actual units but numbers/values.
2) Mario Kart 8 Deluxe CTGP is a modified version of the game so go ask its developers for the speedometer's reliability in the first place.
Our main goal here is to authentically/legally (with no other tools than the game provides except for time) find out the real-life scaled coinless speed values (with their respective units) for 50cc, 100cc, 150cc and 200cc.
Let's dive right into the researches :)
First & foremost, we have to understand what speed is.Basically it is a variation of distance for a given amount of time, in other words it is an amount of distance per amount of time.
In this post, we'll only be focusing on the maximum speed of each engine class as it's the most relevant information we wanna know (thus ignoring Instantaneous speed as well as acceleration) :p
Consequently, we will use the following speed formula for constant speed :

(P.S: I wrote unidirectional due to the fact I was in fact implying we are going to test speed/velocity with no direction change during experiments)
Then we want to find a good course to study and to test things out.
Ultimately, we have to choose a track with a simple continuous layout (with no track type variations nor holes/empty areas ==> discontinuous) that could be broken down into different parts to test on.In our case ExciteBike arena fits perfectly experiment wise (especially for its simple layout featuring simple geometric shapes).
Here is ExciteBike arena's map broken down into lines following symmetries (axial symmetry or central symmetry), the map being made from an in-game deep track exploration (note that the track is not well represented nor to-scale, it is only to be seen as a visual help) :

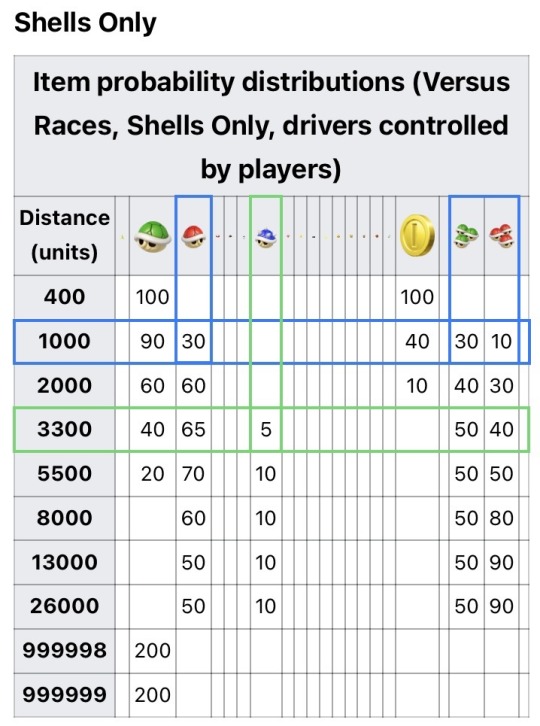
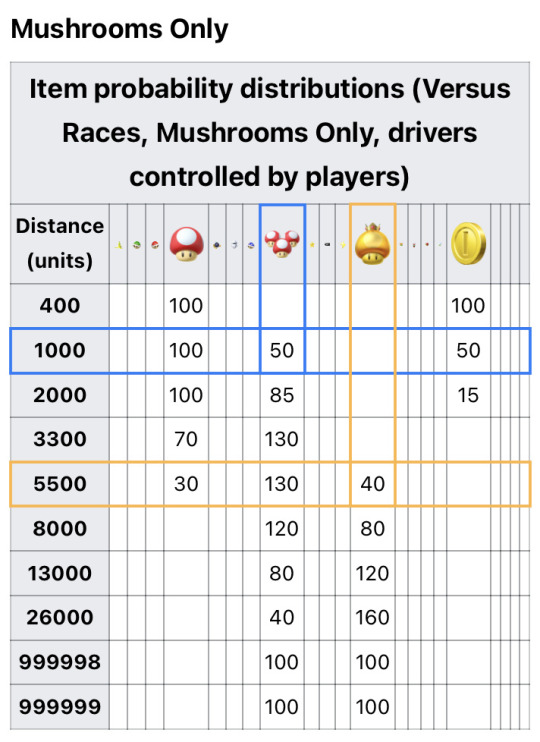
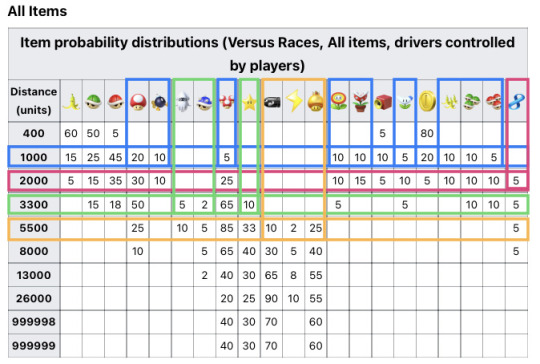
Let's try to frame an estimate of the track's total distance in distance units (probably a unit symbolizing distance which is used in Mario Kart 8 Deluxe wiki) with the following item probability distributions' charts :
Method :
Multiplayer offline (2 players : to disable the position factor as much as possible)/Versus mode/no CPUs, AIs.
2nd player have to be placed on the test line and pick one item at a time and use it before hitting back to the item box (to disable conditional probabilities) to make each case identical and independent as well.Use the frantic items’ probabilities chart (features high probabilities of appearances with the most efficient & cheap amount of tries simplifying experiments) to follow the appearances (items’ appearances are easier to follow than their disappearances) of a given item for a given distance value in distance units, items' appearences to identify (read as colomns and rows intersections for a specific colour, itself for a specific amount of distance) :

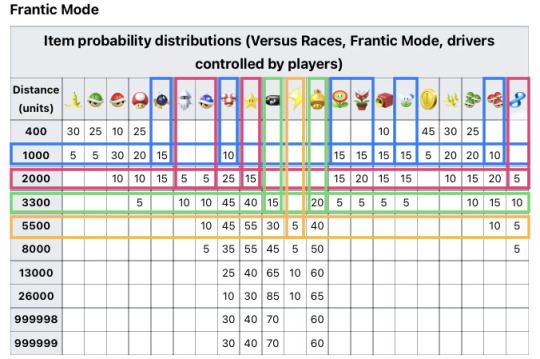
Once an item appeared after a certain amount of tries, check its related distance and try to drive back and forth from an apparent track line/current location to another apparent track line till the range tends to no difference (we can identify framed distances more easily using different item modes in favour of it).
Using given items' probabilities (see the charts above) to identify an estimate of a given distance in a given item mode.With the use of the Binomial law, we can consider stochastic variables (like X) associated with items to identify appearances in which trials' success corresponds to those items' presences.
To calculate the number of tries for getting at least one appearance of an item amongst the ones we have got to identify for a given framed distance, we have to solve for the number of trials after mathematically modeling our situation with probabilities :
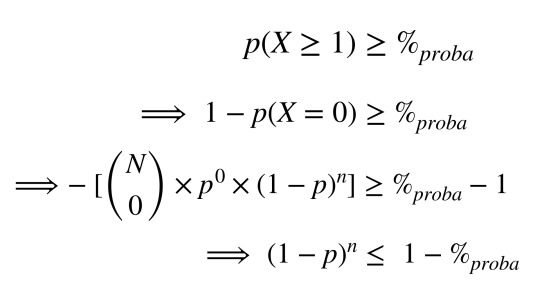

In our case, finding out the best item setting for each given distances (ranging from 1000 to 5500) with a wanted likelihood of appearance equivalent to 95% :
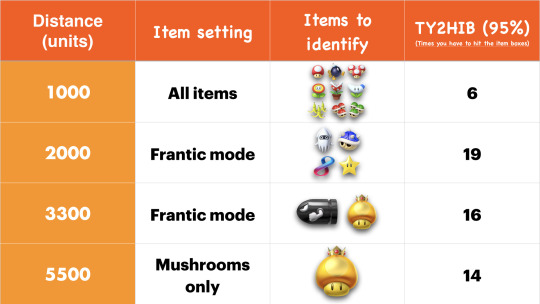
where :

Sum up all the track's section estimated distances to get the total distance.
Unfortunately, this approach only gives off framed estimates of distances and takes up way too much time & effort for something as uncertain as it is :/ . We'd have to be doing the track measurements in Mario Kart 8 Wii U version to avoid introducing conditional probabilities on top of assuming MK8 tracks are the same lengths as MK8DX tracks (plus, as the items' probabilities (charts) take into account Mario Kart 8 Wii U datas instead of Mario Kart 8 Deluxe's).
I know I did not elaborate much on this part and got a little quick but believe me it's absolutely not necessary to.
(Btw, see Mario Kart 8 items' probability distributions wiki to understand the probility system)
Let's now try out another way to determine ExciteBike arena's track length.
Firstly, we have to measure ExciteBike arena course's length.
Secondly, if we take a close look at Mario Kart 8 Deluxe player's statistics menu, we clearly see there is a traveled distance counter which displays this total traveled distance in kilometers (Km).
That means we can measure ExciteBike arena course's length but we have to do many races to get some decimal places out, doing the course over 100 times (driving in the middle of the road to get a fair estimate) should be enough for the experiments (a decameter accuracy is not a big deal simply because doing 1000 times a course to get a meter accuracy is useless since a few meters are negligible, e.g when you measure how tall you are you clearly not take millimeters into account as they almost make no signaficant differences to your height.. same goes for race tracks...)
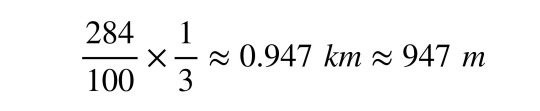
Dividing the distance we obtain after 100 courses (took me about 3.5 hours straight btw) by 100 then by 3 (because there are 3 laps per course) indicates ExciteBike arena course's approximated length is 947 m (0.947 km).
Some people might be wondering why I do not use max speed values (in 150cc) from the Mario Kart 8 Deluxe wiki to determine ExciteBike arena's length in distance units but to my mind using undefined units (sorry not sorry but the wiki did not explained what a "distance unit" necessarily symbolizes in the game distance nor how it's been measured, same story with the "frame") for both distance and time isn't the best way to go for since those said values were provided by some people's tests not by developers themselves.Unless explained, we are not going to use distance units nor frames but rather in-game units for both distance and time (we'll be using the game's stopwatch in time trial mode).
Secondly, notice that the track consists of semi-cercles merged to a rectangle on each side of it like this :


We wanna apply pixel measurements to be able to quantify different proportions of the track :

Knowing the length of the used bars and using perimeter formulas we get the track's total length in pixels :

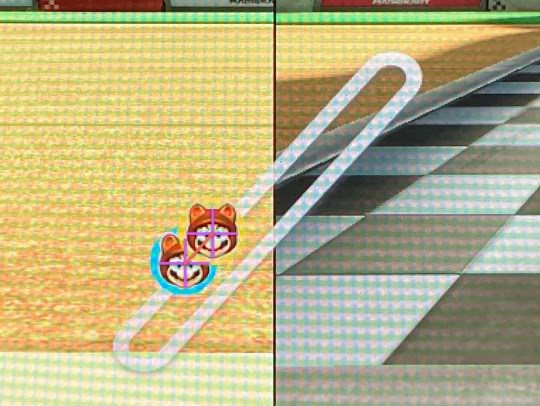
Then we have to take a specific portion of the track as long as possible with visually distinguishable eye marks from which we can get the experiments started (just as follows) :

To measure its length, we can place 2 players at both eye marks to determine the distance in-between the 2 players' map icons' barycenters in pixels (to make the barycenter thing easier, we only use Tanooki Mario's map icon since the shape is quite similar to a circle) :

And get that length in meters too :

To set up the experiments, we have to take a combination with a level 10 of speed (3.25 speed stat bars), an average speed stat level combination :

We'll place the vehicle a certain amount of distance back from the first eye mark and make it use a mushroom to get to top speed quickly when its effect fades away while driving straight (no tilt to be as accurate as possible).Besides, we'll count the elapsed time using time trial's time display for 150cc & 200cc and external time counters for 50cc & 100cc (pardon the low quality) :
youtube
This way we can apply the average speed formula because the speed will remain constant during the tests, we can make a sequence of 20 values for each engine class (50cc, 100cc, 150cc & 200cc) and calculate top speed related to every single value :
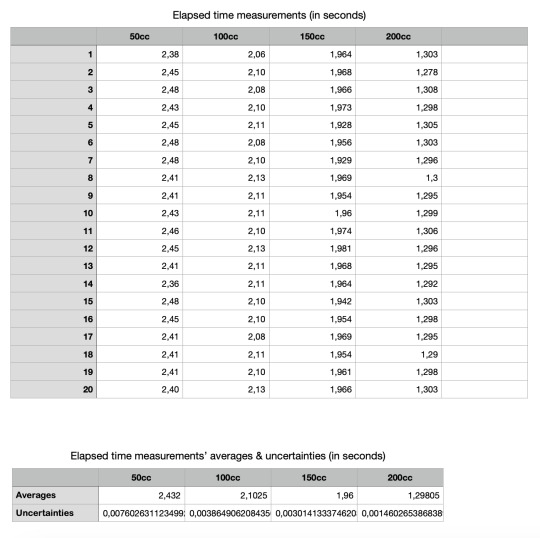

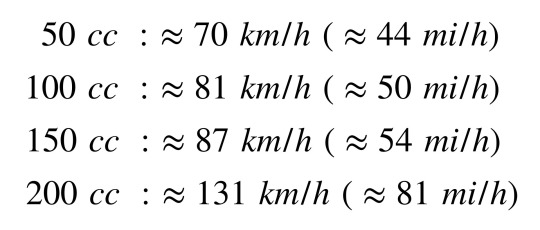
Eventually, we can average out the top speed values in real-life units for every engine class as follows :
Suffice-it-to-say there are uncertainties but after correctly and identically performing experiments those shouldn't be a big problem, we could estimate those using variance and standard deviation :

So here we are with an interesting outlook on Mario karts' (bikes', ATVs' & all) top speed values (coinless), 200cc is just outrightly wicked fast irl (you'd definitely get pulled over in the motorway lol) :$
At least this info should calm down Mario Kart 8 Deluxe haters always obliviously claiming it's slow asf x)
Sidenote: For sUsSy BaKaS, We were obviously talking about ground speed (tbh I don't see people driving underwater, in anti-gravity nor airborne lol) as we tried to reach for a realistic approach.
Overall, all values are approximations (fair ones) but I curiously really wanted to get my hands on this topic as no one did it so far in the vast world that is internet :)
#mario kart 8 deluxe speed#mk8dx#mk8#mario kart 8#mario kart 8 deluxe#deep dive#deep thinking#gaming#video games#nintendo#mario kart 8 switch#mario#mario kart#mario kart 8 dlc#mario kart 8 deluxe real life speed#mario kart 8 deluxe velocity#maths#math#calculation
2 notes
·
View notes
Text
bro might be a professional fanfic writer (his favourite tag is the canon divergence tag)

peak philosophy in ao3 tags
#link click#“everything reminds me of link click” <so real#cant go two minutes without thinking about it#“calculate the velocity of the bullet -” tje bullet? the bullet from vein's gun? the bullet from vein's gun that hit cxs?
33K notes
·
View notes
Text
Imperial measurements are cottagecore and the metric system is dark academia. Is this anything
#this might just be a weird association in my brain#but like#measurement by portions and halves and halves of halves and so on#vs measurement by a system completely built on and integrated with base 10 mathematics#hmm i am calculated the velocity of a moving object based on measurements of distance and time#it gives my brain a very weird dichotomy. like#hmm i am building a house. i need one and three quarters lengths for this piece#hmm i am calculating the velocity of a thing based on measurements of time and distance with fractions not always easy to visualize
0 notes
Text
Guidance Waves
And now for something different from usual: theoretical physics. If that turns you off, so be it, but the reason I am excited is I have now published my ebook ��Guidance Waves 2nd Edition”, which I claim is an alternative theory for quantum mechanics. Which raises the question, what does it need to do to be an alternative theory? First, before everyone turns off completely, the main equation is…
#action quantized#cause of gravity#new ebook#nuclear binding#phase relationship#phase velocity#simple quantum calculations#wave particle duality#wave separable into components
0 notes
Text
im trying to do river basin calculations and physics n shit And i have to go to a documentary screening about police brutality in a minute. and meanwhile carlos is losing a tennis match
#this is not conducive to calculating slope and water volume and river velocity#spain please. Please
1 note
·
View note
Text
if i have to do calculus for one more second i'm going to throw myself off a cliff
1 note
·
View note
Text
I won't bore you with the calculations but the results come out as follows:
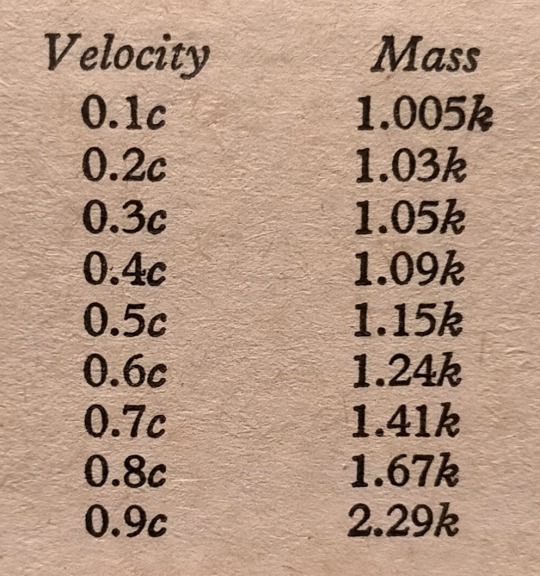
"The Stars in their Courses" - Isaac Asimov
#book quotes#the stars in their courses#isaac asimov#nonfiction#essay#the luxon wall#calculations#velocity#mass#lorentz equation
1 note
·
View note
Text
I desperately need a Subnautica-esque open world game set in deep space like BADLY
#PLEAAAAASE LET ME DEFY PHYSICS AND EXPLORE A BLACK HOLE PLEEEEEEEEEEAAAAAAAAAAAAAAASE#I DON'T CARE IF I GET SPAGHETTIFIED THAT WOULD BE THE COOLEST THING EVERRRRR#it would have to be supermassive though so one would have an actual amount of time to explore it#and not just be sucked in within literal milliseconds#BUT EVEN SO I REAAAAAAAALLY WANT IT#LET ME WATCH A STAR COLLAPSE I WANNA SEE A SUPERNOVA#LET ME EXPLORE A NEBULA I'M ON MY HANDS AND KNEES BEGGING SOMEONE TO DO THIS#where you can like. travel to different planets in different solar systems. even planets floating around with no stars#even to other galaxies bro that would be unbelievably awesome#HAVE A SURVIVAL MODE WHERE YOU HAVE TO DO ACTUAL CALCULATIONS FOR THINGS TO WORK!!#MAKE ME CALCULATE THE ESCAPE VELOCITY TO GET OFF CERTAIN PLANETS AND MOONS AND JUNK !!#MAKE ME CALCULATE THE SCHWARZCHILD RADIUS TO ENSURE I'M GONNA HAVE LONGER THAN TWO MILLISECONDS IN A BLACK HOLE !!#THAT WOULD BE SICK !! IT'S ALSO VERY EASY !!#this may be a “rolling up my sleeves i'll do it myself” moment idk#assuming i ever get around to learning coding and game design#tell me i'm not the only one who would go nuts at a game like that#shut up lea
0 notes
Text
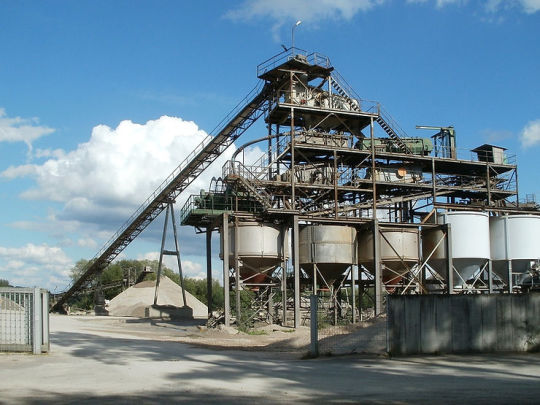
Little P.Eng. for Discrete Element Modeling (DEM) Services
In a world driven by technological advancements, the ability to understand granular systems at a particle level has never been more essential. This precise understanding has been made possible through a computational technique known as Discrete Element Modeling (DEM). While many entities offer DEM services, Little P.Eng. has carved a niche for itself as a front-runner in this specialized domain.
Understanding Discrete Element Modeling (DEM)
Before diving into the specifics of Little P.Eng.'s offerings, it's essential to demystify DEM:
DEM is Calculation-based Modeling: At the heart of DEM is mathematics. This method uses precise calculations to predict the behavior of individual particles within a system. By doing so, it can accurately predict the interactions and outcomes when these particles are subjected to various conditions.
DEM Allows for Visualizing Results: One of the standout features of DEM is its ability to provide visual results. Users can observe:
Particle Velocity: Understand the speed and direction of individual particles.
Forces: This includes shear (parallel to the surface) and normal (perpendicular to the surface) forces that the particles experience.
Moments: This refers to the bending and torsional (twisting) moments affecting the particles.
Acceleration and Material Scatter: Track how quickly particles move and the variations in their dispersion patterns.
DEM: More than just Flow Simulation: While DEM is instrumental in predicting the flow of bulk materials, its capabilities extend beyond this. It plays a crucial role in understanding:
Wear Patterns: Predict how equipment will fare over time by simulating particle interaction and the resultant wear.
Mixing: Understand how different particles mix, which is vital in industries like pharmaceuticals and food production.
Center Loading: This refers to the loading pattern where materials concentrate towards the center, crucial in industries like construction.
DEM Programs: The Power Behind the Predictions
Any tool is only as good as the software powering it. When it comes to DEM, numerous programs can be used to perform this intricate modeling:
EDEM: A market leader, renowned for its comprehensive modeling capabilities.
PFC (Particle Flow Code): Known for its versatility, offering both 2D and 3D simulations.
LIGGGHTS: An open-source powerhouse that's both versatile and widely accepted.
Rocky DEM: Its strength lies in simulating realistic particle shapes, crucial for specific industries.
Yade: An open-source tool prized for its extensibility.
Abaqus: A multi-faceted software that, beyond its renowned finite element analysis, offers DEM capabilities.
Ansys Rocky: Building on the Ansys platform's strengths, it focuses on granular flow simulations.
Barracuda Virtual Reactor: Ideal for energy sector applications, especially particle reactions.
Also there are some open sources:
Kratos Multiphysics is developed by CIMNE (International Center for Numerical Methods in Engineering) in Barcelona and covers all kinds of numerical simulations, including DEM/PEM and DEM/PEFM-FEM coupling.
YadeDEM is a DEM package that is specifically designed for geomechanics.
Woo is a fork of YadeDEM with a strong focus on parallel computing and portability.
LAMMPS is a general purpose DEM/PEM.
LIGGGHTS is a general purpose DEM software that includes heat transfer simulations and is based on LAMMPS.
ESyS Particle is developed at the University of Queensland, Australia, with a focus on geoscientic/geotechnical applications.
GranOO is a general purpose DEM.
MercuryDPM is a general purpose Discrete Particle Method (DPM) software.
Little P.Eng.: Setting the Gold Standard in DEM Services
In the expansive realm of DEM, Little P.Eng. shines brightly, and here's why:
Mastery Over Multiple Platforms: Their team is proficient in a diverse array of DEM programs, ensuring they always have the right tool for the job.
A Client-centric Approach: They tailor their solutions, ensuring that each client's unique needs and challenges are addressed.
In-depth Analysis: Beyond merely running simulations, they delve deep, integrating real-world measurements to enhance simulation accuracy.
Applications and Implications of DEM in Industries
The true power of DEM, as harnessed by Little P.Eng., lies in its diverse applications:
Equipment Design: Through DEM, companies can design equipment that's optimized for longevity and efficiency.
Optimizing Production Lines: By understanding how granular materials behave, industries can fine-tune their production lines for maximum efficiency.
Safety Protocols: Predicting particle behavior, especially in industries dealing with hazardous materials, can lead to enhanced safety protocols.
Challenges in DEM and How Little P.Eng. Overcomes Them
DEM, while powerful, isn't without its challenges. The accuracy of simulations is heavily reliant on input parameters. Additionally, the computational demands for large-scale simulations are immense.
Little P.Eng. rises above these challenges through a blend of rigorous experimental data collection and a deep understanding of the DEM software landscape. Their iterative approach ensures that simulations are continually refined for better accuracy.
Conclusion
Discrete Element Modeling (DEM) is transforming our understanding of granular systems. With its capability to provide in-depth insights at a particle level, its applications span a wide array of industries.
In this domain, Little P.Eng. emerges not just as a service provider, but as a trusted partner, guiding businesses towards better efficiency, safety, and innovation. As we venture further into an era where the micro informs the macro, the services of entities like Little P.Eng., underpinned by the power of DEM, will undoubtedly be invaluable.
Read more:
Little P.Eng. for Discrete Element Modeling (DEM) Services: Unveiling the Power of Simulation
The Importance of Discrete Element Modeling (DEM) Studies and What Problems It Can Solve
Tags:
Little P.Eng.
Discrete Element Modeling
Mixing
Granular systems
Particle behavior
EDEM
PFC (Particle Flow Code)
LIGGGHTS
Rocky DEM
Yade
Abaqus
Ansys Rocky
Barracuda Virtual Reactor
Calculation-based modeling
Particle velocity
Shear forces
Normal forces
Bending moments
Torsional moments
Acceleration
Material scatter
Flow simulation
Wear patterns
Center loading
Equipment design
Production line optimization
Safety protocols
Computational simulations
Input parameters
Simulation accuracy
Bulk Material Handling & Processing
Engineering Services
Located in Calgary, Alberta; Vancouver, BC; Toronto, Ontario; Edmonton, Alberta; Houston Texas; Torrance, California; El Segundo, CA; Manhattan Beach, CA; Concord, CA; We offer our engineering consultancy services across Canada and United States. Meena Rezkallah.
#Little P.Eng.#Discrete Element Modeling#Mixing#Granular systems#Particle behavior#EDEM#PFC (Particle Flow Code)#LIGGGHTS#Rocky DEM#Yade#Abaqus#Ansys Rocky#Barracuda Virtual Reactor#Calculation-based modeling#Particle velocity#Shear forces#Normal forces#Bending moments#Torsional moments#Acceleration#Material scatter#Flow simulation#Wear patterns#Center loading#Equipment design#Production line optimization#Safety protocols#Computational simulations#Input parameters#Simulation accuracy
0 notes