#dplyr
Explore tagged Tumblr posts
Visit Tumblr Blog
Explore Tumblr blogs with no restrictions, modern design and the best experience.
Last Seen Tumblr Blogs


Fun Fact
Tumblr has a low social media market share in South America.
Text
using dplyr to organize temperature heatwave data. call that piping hot
32 notes
·
View notes
Text
i made this for ME because I PERSONALLY am amused
1 note
·
View note
Text
instagram
#DataWrangling#dplyr#tidyr#Tidyverse#RForDataScience#RProgramming#DataCleaningR#DataManipulation#LearnR#TechForStudents#AssignmentHelp#AssignmentOnClick#assignment#assignment help#assignment service#assignmentexperts#assignmentwriting#Instagram
0 notes
Text
my supervisor telling me about tidyverse: you probably use it and know it really well. i cant get the hang of it. i feel like a dinosaur. it is super modern and is supposed to be intuitive, but base R is so much better for me.
me, who only ever made one (1) ggplot: *cricket noises*
me later when i want to count mean for group of data using dplyr: HOW IS THIS INTUITIVE
#pls help me#is there a way to make base R do it (without having to make a subset)?#no im not sure if i will get hang of dplyr#intuitive who. whats the % supposed to mean.#AAAA#yes i am actually ranting about Rstudio on tumblr dot com#what have i become#biostatistics#rstudio#bachelor thesis#is this what my science career is gonna look like
10 notes
·
View notes
Text
i wish people making r packages would just. name their functions things Other than functions that are already in base r or in really basic packages like dplyr
5 notes
·
View notes
Text
A Beginner’s Guide to Data Cleaning Techniques

Data is the lifeblood of any modern organization. However, raw data is rarely ready for analysis. Before it can be used for insights, data must be cleaned, refined, and structured—a process known as data cleaning. This blog will explore essential data-cleaning techniques, why they are important, and how beginners can master them.
#data cleaning techniques#data cleansing#data scrubbing#business intelligence#Data Cleaning Challenges#Removing Duplicate Records#Handling Missing Data#Correcting Inconsistencies#Python#pandas#R#OpenRefine#Microsoft Excel#Tools for Data Cleaning#data cleaning steps#dplyr and tidyr#basic data cleaning features#Data validation
0 notes
Text
hey who named the dplyr cumulative functions like that
5 notes
·
View notes
Text
Exploring Data Science Tools: My Adventures with Python, R, and More
Welcome to my data science journey! In this blog post, I'm excited to take you on a captivating adventure through the world of data science tools. We'll explore the significance of choosing the right tools and how they've shaped my path in this thrilling field.
Choosing the right tools in data science is akin to a chef selecting the finest ingredients for a culinary masterpiece. Each tool has its unique flavor and purpose, and understanding their nuances is key to becoming a proficient data scientist.
I. The Quest for the Right Tool
My journey began with confusion and curiosity. The world of data science tools was vast and intimidating. I questioned which programming language would be my trusted companion on this expedition. The importance of selecting the right tool soon became evident.
I embarked on a research quest, delving deep into the features and capabilities of various tools. Python and R emerged as the frontrunners, each with its strengths and applications. These two contenders became the focus of my data science adventures.
II. Python: The Swiss Army Knife of Data Science
Python, often hailed as the Swiss Army Knife of data science, stood out for its versatility and widespread popularity. Its extensive library ecosystem, including NumPy for numerical computing, pandas for data manipulation, and Matplotlib for data visualization, made it a compelling choice.
My first experiences with Python were both thrilling and challenging. I dove into coding, faced syntax errors, and wrestled with data structures. But with each obstacle, I discovered new capabilities and expanded my skill set.
III. R: The Statistical Powerhouse
In the world of statistics, R shines as a powerhouse. Its statistical packages like dplyr for data manipulation and ggplot2 for data visualization are renowned for their efficacy. As I ventured into R, I found myself immersed in a world of statistical analysis and data exploration.
My journey with R included memorable encounters with data sets, where I unearthed hidden insights and crafted beautiful visualizations. The statistical prowess of R truly left an indelible mark on my data science adventure.
IV. Beyond Python and R: Exploring Specialized Tools
While Python and R were my primary companions, I couldn't resist exploring specialized tools and programming languages that catered to specific niches in data science. These tools offered unique features and advantages that added depth to my skill set.
For instance, tools like SQL allowed me to delve into database management and querying, while Scala opened doors to big data analytics. Each tool found its place in my toolkit, serving as a valuable asset in different scenarios.
V. The Learning Curve: Challenges and Rewards
The path I took wasn't without its share of difficulties. Learning Python, R, and specialized tools presented a steep learning curve. Debugging code, grasping complex algorithms, and troubleshooting errors were all part of the process.
However, these challenges brought about incredible rewards. With persistence and dedication, I overcame obstacles, gained a profound understanding of data science, and felt a growing sense of achievement and empowerment.
VI. Leveraging Python and R Together
One of the most exciting revelations in my journey was discovering the synergy between Python and R. These two languages, once considered competitors, complemented each other beautifully.

I began integrating Python and R seamlessly into my data science workflow. Python's data manipulation capabilities combined with R's statistical prowess proved to be a winning combination. Together, they enabled me to tackle diverse data science tasks effectively.
VII. Tips for Beginners
For fellow data science enthusiasts beginning their own journeys, I offer some valuable tips:
Embrace curiosity and stay open to learning.
Work on practical projects while engaging in frequent coding practice.
Explore data science courses and resources to enhance your skills.
Seek guidance from mentors and engage with the data science community.
Remember that the journey is continuous—there's always more to learn and discover.
My adventures with Python, R, and various data science tools have been transformative. I've learned that choosing the right tool for the job is crucial, but versatility and adaptability are equally important traits for a data scientist.
As I summarize my expedition, I emphasize the significance of selecting tools that align with your project requirements and objectives. Each tool has a unique role to play, and mastering them unlocks endless possibilities in the world of data science.
I encourage you to embark on your own tool exploration journey in data science. Embrace the challenges, relish the rewards, and remember that the adventure is ongoing. May your path in data science be as exhilarating and fulfilling as mine has been.
Happy data exploring!
23 notes
·
View notes
Text
Navigating Challenges in R Programming Homework: A Comprehensive Guide for Students
When it comes to mastering R programming, students often find themselves facing numerous challenges in completing their homework assignments. In this comprehensive guide, we'll explore the common obstacles students encounter and provide practical tips to overcome them. Whether you're a beginner or an experienced R programmer, this handbook aims to be your go-to resource for navigating the complexities of R homework.
Understanding the Importance of R Homework
Before delving into the challenges, let's establish why R homework is crucial for students pursuing statistics or data science courses. R programming is widely used in these fields for data analysis, visualization, and statistical modeling. Completing R homework assignments not only reinforces theoretical knowledge but also hones practical skills, preparing students for real-world applications.
Challenges Faced by Students
Complexity of R Syntax Overcoming the Syntax Maze The intricacies of R syntax can be overwhelming, especially for beginners. To overcome this challenge, consider breaking down your code into smaller segments, focusing on one concept at a time. Utilize online resources and seek assistance from R programming communities to enhance your understanding of syntax rules.
Data Handling and Manipulation Mastering Data Manipulation Effective data handling is a fundamental aspect of R programming. Practice with real-world datasets and explore functions like dplyr and tidyr to enhance your data manipulation skills. Online platforms and tutorials can provide hands-on exercises to reinforce these concepts.
Debugging and Error Resolution Navigating the Debugging Terrain Encountering errors in your R code is inevitable, but learning how to debug efficiently is key. Utilize debugging tools, such as the traceback function, and carefully review error messages. Online forums and communities can be valuable resources for seeking guidance on specific error resolutions.
Time Management Balancing Act: Homework vs. Other Commitments Many students struggle with time management when it comes to R homework. Create a schedule, allocate dedicated time slots for homework, and break down tasks into manageable chunks. Prioritize assignments based on deadlines and complexity, allowing for a more structured and efficient approach.
Seeking External Support
Relying on Professional Assistance Exploring R Homework Help Services For students facing persistent challenges, seeking professional help is a viable option. Websites like StatisticsHomeworkHelper.com offer specialized R homework help services, ensuring personalized assistance and timely completion of assignments. These services can provide valuable insights and guidance, complementing your learning journey.
Conclusion
In conclusion, overcoming obstacles in completing R homework requires a strategic approach, persistence, and access to the right resources. By understanding the challenges associated with R programming, implementing effective learning strategies, and leveraging external support when needed, students can navigate the complexities of R homework successfully. Remember, mastering R programming is a gradual process, and each obstacle conquered is a step closer to becoming a proficient R programmer.
Frequently Asked Questions
Q1: Is it common for students to struggle with R homework? A1: Yes, it's common for students to face challenges in R homework, especially due to the complexity of syntax, data manipulation, and debugging. Q2: How can I improve my time management for R homework? A2: To improve time management, create a schedule, allocate dedicated time slots, and prioritize assignments based on deadlines and complexity. Q3: When should I consider seeking professional R homework help? A3: If you're facing persistent challenges and need personalized assistance, consider seeking professional help from reliable services like StatisticsHomeworkHelper.com.
By addressing the challenges associated with R homework and providing practical solutions, this handbook aims to empower students to tackle their assignments with confidence. Whether you're a beginner or an advanced R programmer, the key lies in persistence, strategic learning, and utilizing available resources to overcome obstacles successfully.
10 notes
·
View notes
Text
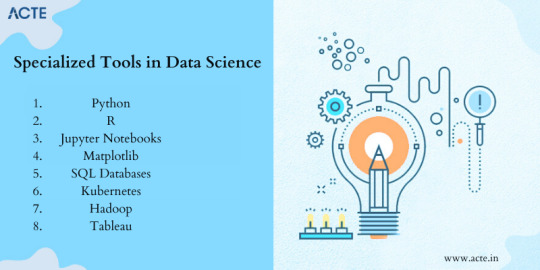
Embarking on the Odyssey of Data Science Mastery: A Comprehensive 8-Step Guide
Navigating the dynamic waters of data science requires a combination of technical acumen and analytical finesse. This comprehensive guide unfolds an 8-step roadmap, not just to become a data scientist but to master the intricate art and science that defines this dynamic field.

1. Building a Sturdy Mathematical Foundation: The Pillars of Understanding
Embark on your journey with a laser focus on constructing a formidable foundation in fundamental mathematical principles, probability theory, and statistics. This foundational knowledge serves as the bedrock upon which you'll interpret data and seamlessly implement statistical models with precision.
2. Mastering Programming Languages: The Data Scientist's Linguistic Proficiency
In the vast toolkit of a data scientist, mastery in a programming language is key. Delve into the intricacies of Python or R, navigating the landscape of data manipulation libraries like Pandas or data.table. These tools become your allies in handling large datasets with finesse.
3. Navigating Data Analysis Libraries: Unleashing the Power of Manipulation
With programming proficiency comes the need to manipulate and analyze data efficiently. This is where libraries like Pandas (Python) and dplyr (R) shine. Pandas, known for its ease of use, provides data structures and functions needed to manipulate structured data seamlessly, while dplyr simplifies data manipulation in R.
4. Crafting Visual Narratives: The Art of Data Visualization
Transforming complex insights into compelling visual narratives is the hallmark of a skilled data scientist. Immerse yourself in the world of data visualization tools such as Matplotlib, Seaborn, or ggplot2. Through mastery of these tools, your analytical findings metamorphose into visually striking stories.
5. Navigating the Landscape of Machine Learning Basics: Algorithms as Your Guide
Machine learning (ML) is the heart of data science. Start with the basics – linear regression, logistic regression, and classification algorithms. Platforms like Scikit-Learn (Python) and caret (R) provide practical implementations. A solid grasp of the fundamentals empowers you to tackle a myriad of real-world problems.
6. Bridging Theory and Practice: The Power of Hands-On Projects
Theoretical knowledge gains potency when applied. Platforms like Kaggle provide datasets and competitions, allowing you to test your skills in a real-world context. Building a portfolio of projects showcases your skills to potential employers and collaborators.
7. Structured Learning Paths: The Guiding Compass of Online Courses
The world of data science is vast, and structured courses can act as your compass. Platforms like Coursera, edX, and Udacity offer courses tailored to various aspects of data science. These courses provide not just theoretical knowledge but hands-on experience, ensuring a well-rounded education.
8. Learning Together: The Vibrant Tapestry of Community Engagement
Data science is not a solitary pursuit. Engage with the community. Platforms like Stack Overflow, Reddit (r/datascience), and GitHub offer spaces to ask questions, share insights, and learn from experienced practitioners. Actively participating in the data science community exposes you to the latest trends, tools, and best practices.
Conclusion: A Journey of Continuous Discovery Embarking on the data science odyssey is not a sprint; it's a marathon of continuous learning. Each step in this guide is a stepping stone, guiding you through the intricate landscape of data science. As you navigate through the sea of data, may your curiosity be your compass, and may the insights you unearth become beacons of knowledge in the vast realm of data science. Best of luck on your journey!
#data science course#datascience#technology#data science certification#data science training#tech#education
4 notes
·
View notes
Text
Most of the extremely nerdy swag I got from an event this weekend is too specific to what I do to share, but I am extremely enjoying this shiny dplyr sticker, along with the rest.
3 notes
·
View notes
Text
Building a Smart Python-to-R Code Converter with Gemini AI-Powered Validation and Feedback
class EnhancedPythonToRConverter: """ Enhanced Python to R converter with Gemini AI validation """ def __init__(self, gemini_api_key: str = None): self.validator = GeminiValidator(gemini_api_key) self.import_mappings = { 'pandas': 'library(dplyr)\nlibrary(tidyr)\nlibrary(readr)', 'numpy': 'library(base)', 'matplotlib.pyplot': 'library(ggplot2)', 'seaborn':…
0 notes
Text
How to create your own RAG applications in R
See how to query documents using natural language, LLMs, and R—including dplyr-like filtering on metadata. Plus, learn how to use an LLM to extract structured data for text filtering. Credit: Koshiro K – shutterstock.com One of the handiest tasks large language models can do for us is answer questions about a specific collection of information. This is often done using a technique called RAG,…
0 notes
Text

Python vs R in 2025: Which Language Is Better for Data Science?
In the fast-evolving field of data science, one question continues to spark debate: Python or R? As we step into 2025, this discussion remains highly relevant for data professionals, students, and organizations trying to build robust data solutions.
Both languages have their strengths, dedicated communities, and unique ecosystems—but which one is better for data science in 2025?
Let’s break it down.
🚀 Overview: Python and R in a Nutshell
Python is a general-purpose programming language that excels in flexibility, ease of use, and integration across the entire software development lifecycle.
R was built specifically for statistical computing and data visualization. It remains a favorite among statisticians, academic researchers, and niche analytics teams.
🔍 Popularity & Community Support
Python
Most popular programming language in the world as of 2025 (per TIOBE and Stack Overflow).
Huge ecosystem of libraries, frameworks, and integrations (e.g., Pandas, scikit-learn, TensorFlow, FastAPI).
Massive community support—easy to find tutorials, GitHub repos, and troubleshooting help.
R
Still widely used in academia, bioinformatics, and research-heavy sectors.
Strong support from statisticians, with purpose-built libraries like ggplot2, caret, and shiny.
The community is loyal, but smaller compared to Python’s.
✅ Verdict: Python wins in popularity and long-term ecosystem growth.
🧠 Learning Curve & Usability
Python
Simple, readable syntax that resembles plain English.
Ideal for beginners in both programming and data science.
Versatile—can be used for web development, automation, machine learning, and more.
R
Steeper learning curve, especially for those new to programming.
More intuitive for statisticians and data analysts with a mathematical background.
Syntax can feel inconsistent for programmers transitioning from other languages.
✅ Verdict: Python is more beginner-friendly and versatile.
📊 Data Analysis & Visualization
Python
Offers data manipulation and visualization through pandas, matplotlib, seaborn, and plotly.
Interactive dashboarding with Dash, Streamlit, or Bokeh.
Great for combining analytics with automation or app development.
R
Built for data exploration and visualization from the ground up.
Tools like ggplot2 and dplyr are unmatched for creating clean, elegant plots and handling complex statistical data.
Shiny apps allow quick deployment of interactive dashboards—ideal for internal analytics tools.
✅ Verdict: R edges ahead in statistical visualization and reporting tasks.
🤖 Machine Learning & AI
Python
Dominates in ML and AI development with libraries like scikit-learn, TensorFlow, PyTorch, and XGBoost.
Seamless integration with cloud platforms (AWS, GCP, Azure).
Rapid development of end-to-end AI pipelines.
R
Good for model prototyping using packages like caret, mlr3, and xgboost (also available in Python).
More limited in deep learning frameworks.
Mostly used for academic ML applications rather than production environments.
✅ Verdict: Python leads in ML, deep learning, and deployment.
🧪 Statistical Modeling
Python
Capable with statsmodels, SciPy, and PyMC, but not as intuitive for complex statistical techniques.
R
Designed with statistics in mind—everything from linear regression to time series and hypothesis testing is built-in.
More transparent for statistical modeling and custom formulas.
✅ Verdict: R is still the best for pure statistical analysis and research.
🏭 Industry Adoption & Job Market
Python
Used by major tech companies, banks, retailers, and startups.
In-demand skill for data scientist, ML engineer, and AI roles.
Many job listings require Python as a core skill.
R
More common in academic, healthcare, pharma, and government sectors.
Roles using R are often niche or research-focused.
✅ Verdict: Python dominates the job market in both volume and diversity.
⚙️ Integration & Deployment
Python
Easily deploy models via APIs, microservices, or cloud platforms.
Compatible with web frameworks like Flask, FastAPI, and Django.
Works smoothly in production environments.
R’s deployment is usually tied to Shiny or markdown reporting.
Limited support in production-ready environments.
Less preferred for integrating into scalable applications.
✅ Verdict: Python is more production-ready and scalable.
🏁 Conclusion
In 2025, Python is the clear winner for most data science applications—especially those involving machine learning, automation, and real-world deployment. Its versatility, simplicity, and massive support ecosystem make it a go-to language for data professionals.
However, R still holds strong in domains where advanced statistical modeling, academic research, or specialized data visualization is the core focus.
The best advice? Learn both if you can. But if you're just starting your data science journey or aiming for a career in industry, Python is the smarter investment.
#python#rstats#datascience2025#machinelearning#statisticalanalysis#dataanalytics#pythonvsr#mltools#datavisualization#ai2025
0 notes
Text
CptS 475/575 Assignment 3: Data Transformation and Tidying Solved
Question 1. (50 pts total) For this question you will be using either the dplyr package from R or the Pandas library in Python to manipulate and clean up a dataset called NBA_Stats_23_24.csv (available in the Modules section on Canvas under the folder Datasets for Assignments). This data was pulled from https://www.nba.com/stats website. The dataset contains information about the Men’s National…
0 notes
Text
Mastering Data Analytics with R Studio for Smarter Insights In today's data-driven world, the ability to analyze and interpret data is a crucial skill for businesses seeking a competitive edge. R Studio is a powerful tool that facilitates data analysis and visualization, making it indispensable for data analysts. This blog will guide you through mastering data analytics with R Studio, providing insights to enhance your analytical capabilities and drive smarter business decisions. https://discdown.org/rprogramming/images/03/03_RStudio_2.jpg R Studio Interface Overview What is R Studio? R Studio is an integrated development environment (IDE) that allows users to work with R, a statistical programming language. It offers a user-friendly platform with features that support data analysis, statistical computing, and graphical representation. The open-source nature of R Studio, combined with its extensive community support, makes it an excellent choice for data analysts at all levels. Why Choose R Studio for Data Analytics?
https://s3.amazonaws.com/assets.datacamp.com/blog_assets/Machine+Learning+R/plot_675020181.png Flexibility and Customization R Studio offers unparalleled flexibility, allowing analysts to tailor their environment and scripts to meet specific needs. This customization capability extends to data manipulation and visualization, enabling users to adapt their analysis to various datasets and objectives. Comprehensive Package Ecosystem The R ecosystem boasts a vast array of packages designed for different aspects of data analysis, from data cleaning and transformation to advanced statistical modeling. Popular packages like dplyr, ggplot2, and tidyr simplify complex tasks, making it easier to derive insights from data. Robust Visualization Capabilities Visualization is a cornerstone of data analysis, and R Studio excels in this area. With packages like ggplot2, users can create highly customizable and aesthetically pleasing visualizations that effectively communicate findings to stakeholders. This capability is critical for translating complex data into actionable insights. Getting Started with R Studio Installation and Setup To begin using R Studio, download and install both R and R Studio from their official websites. Once installed, familiarize yourself with the R Studio interface, which includes the console, script editor, and various panes for managing files, plots, and packages. Importing Data R Studio supports importing data from various sources, including CSV files, databases, and APIs. Use functions like read.csv() or DBI packages to connect to databases and import data into your R environment. Data Cleaning and Preprocessing Before analysis, data must be cleaned and preprocessed. Tools like dplyr and tidyr are essential for transforming data, handling missing values, and ensuring datasets are ready for analysis. Mastering these packages will streamline your data preparation process. Advanced Data Analysis Techniques Statistical Modeling R Studio is well-equipped for statistical modeling, offering packages for linear and non-linear modeling, time-series analysis, and machine learning. Leverage packages such as caret and randomForest to build predictive models that enhance decision-making.
Machine Learning with R Machine learning is a transformative technology in data analytics. With R Studio, implement machine learning algorithms using packages like caret and mlr3. These tools enable the creation of models that predict outcomes, classify data, and cluster datasets based on similarities. Data Visualization in Time-Series Analysis For businesses relying on temporal data, time-series analysis is invaluable. R Studio provides powerful tools for this type of analysis, enabling the identification of trends and seasonal patterns. Use packages like forecast and zoo to analyze time-dependent data effectively. Visualization and Reporting Creating Effective Visualizations Effective visualizations are critical for conveying data insights. R Studio's ggplot2 package is renowned for its ability to create detailed and informative charts and graphs. Whether it's a simple line graph or a complex multi-faceted plot, ggplot2 offers the tools to visualize data clearly and succinctly. Generating Reports with R Markdown R Markdown is a dynamic tool in R Studio for creating reproducible reports. It allows users to integrate R code with narrative text, generating documents that include both analysis and interpretation. This feature is particularly useful for creating comprehensive reports for stakeholders. Best Practices for Mastering R Studio Continuous Learning and Community Engagement The field of data analytics is continuously evolving, and staying updated is crucial. Engage with the R community through forums, blogs, and social media to learn new techniques and best practices. Participate in webinars and workshops to enhance your skills and network with other professionals. Developing a Structured Workflow A well-structured workflow is essential for efficient data analysis. Organize your scripts, datasets, and outputs systematically within R Studio. Utilize version control tools like Git to track changes and collaborate with team members effectively. Prioritizing Data Security Ensuring the security of your data is paramount. Implement best practices for data security within R Studio, such as encrypting sensitive data, regularly updating packages, and managing user access rights carefully. Conclusion Mastering data analytics with R Studio is a journey that offers immense rewards in terms of enhanced analytical capabilities and smarter business insights. By leveraging R Studio's flexibility, comprehensive package ecosystem, and robust visualization tools, you can transform raw data into meaningful insights that drive strategic decision-making. Embrace continuous learning and engage with the vibrant R community to stay at the forefront of data analytics innovation. https://www.datavis.ca/courses/RGraphics/images/headers/Rgraphics2.png
Machine Learning with R Studio FAQs Q: What is the primary advantage of using R Studio over other data analysis tools? A: R Studio offers unmatched flexibility and a comprehensive package ecosystem that caters to a wide range of data analysis needs. Its robust visualization capabilities and open-source nature make it a preferred choice for analysts. Q: Can beginners easily learn R Studio? A: Yes, beginners can learn R Studio with the help of numerous online resources, tutorials, and community support. The user-friendly interface simplifies the learning curve for new users. Q: How does R Studio support machine learning? A: R Studio supports machine learning through packages like caret and mlr3, which provide tools for building, training, and evaluating machine learning models. Q: Is R Studio suitable for time-series analysis? A: Absolutely, R Studio is well-suited for time-series analysis, offering specialized packages like forecast and zoo that help identify trends and seasonal patterns in temporal data. Q: How can I ensure data security while using R Studio? A: To ensure data security, implement encryption for sensitive data, keep your R Studio and packages updated, and manage user access rights diligently. Regularly back up your data to prevent loss.
0 notes