
Statistics
We looked inside some of the posts by abhhijit-dutta and here's what we found interesting.
Average Info
Notes Per Post
13
Likes Per Post
13
Reblog Per Post
0
Reply Per Post
0
Time Between Posts
5 days
Number of Posts By Type
Text
17
Last Seen Tumblr Blogs


Fun Fact
China blocked Tumblr because of pornography and censorship problems in 2013.
Text
COMPANY'S FINANCIAL HEALTH USING RATIOS
Assessing a company’s financial health requires analyzing its profitability, liquidity, solvency, and efficiency ratios. These ratios provide insights into the company’s ability to generate profits, meet its obligations and use its resources efficiently. Here’s an overview of each of these ratios: Profitability ratios: These ratios help assess a company’s ability to generate profits. Common…
View On WordPress
0 notes
Text
GENERAL TERMS USED IN THE STOCK MARKET REGULARLY
1) What is stock market index? A stock index or stock market index is a measurement of a section of the stock market. It is computed from the prices of selected stocks. It is a tool used by investors and financialmanagers to describe the market and to compare the return on specific investments. You may often hear people speaking that the ‘market’ fell one day, or that the ‘market’…
View On WordPress
#Basics of stock market#FAQ#General terms used in stock market#Question and Answers#Stock Market#stock market for beginners
1 note
·
View note
Text
|ASCENDING AND DESCENDING TRIANGLES|CHART PATTERN|TECHNICAL ANALYSIS|
Ascending Triangle and Descending Triangle are two important chart patterns used in technical analysis to predict the future price movement of a stock. These patterns are formed by two trend lines that converge to a point, indicating a potential breakout in the price.An Ascending Triangle is formed by a horizontal resistance line and a rising trend line that connects a series of higher lows. The…

View On WordPress
0 notes
Text
|CUP AND HANDLE|CHART PATTERN|TECHNICAL ANALYSIS|
The Cup and Handle pattern is a popular chart pattern used in technical analysis by traders and investors to identify potential bullish opportunities in the stock market. This pattern is formed when a stock price experiences a moderate decline followed by a gradual recovery, creating a “cup” shape on a price chart. The cup shape typically lasts for several weeks to several months and has a…

View On WordPress
1 note
·
View note
Text
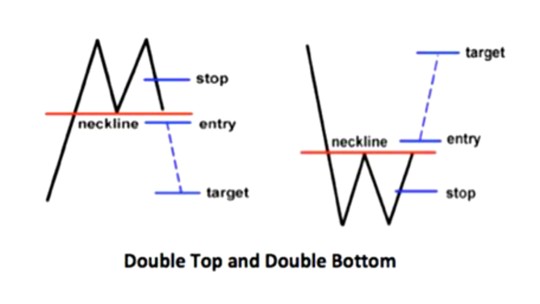
|DOUBLE TOP AND DOUBLE BOTTOM|CHART PATTERNS| TECHNICAL ANALYSIS|
Double top and double bottom are common chart patterns used in technical analysis to identify potential trend reversal points in the stock market. The double top pattern occurs when a stock price reaches a high point twice and fails to break above it, forming two peaks at approximately the same price level. On the other hand, the double bottom pattern occurs when a stock price reaches a low point…
View On WordPress
1 note
·
View note
Text
|HEAD AND SHOULDERS |CHART PATTERN |TECHNICAL ANALYSIS|
The “Head and Shoulders” pattern is a commonly used technical analysis chart pattern in the stock market. It is a reversal pattern that indicates a potential change in the direction of the price trend. The pattern is named after its resemblance to a human head and shoulders. The pattern is characterized by three peaks, with the central peak being higher than the other two. The two smaller peaks…

View On WordPress
1 note
·
View note
Text
|ZIG ZAG|TECHNICAL ANALYSIS INDICATOR|
The ZigZag indicator is a technical analysis tool that helps identify trend changes and potential reversals in the stock market. It is a popular indicator among traders and investors who use technical analysis to make investment decisions. The ZigZag indicator works by filtering out small price movements and focusing on significant price swings. It connects the high and low points of a chart and…

View On WordPress
1 note
·
View note
Text
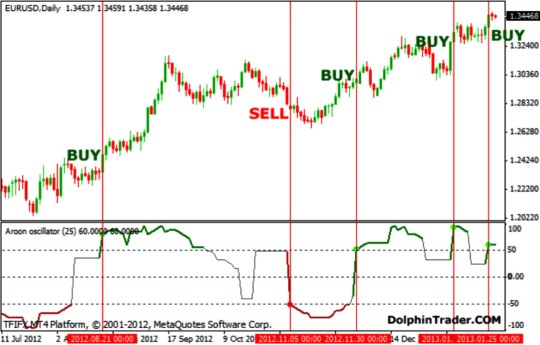
|AROON OSCILLATOR|TECHNICAL ANALYSIS INDICATOR|
The Aroon Oscillator is a technical indicator that is commonly used in stock market analysis. It is based on the Aroon indicator, which was developed by Tushar Chande in 1995, and provides insights into the strength and direction of a trend. The Aroon Oscillator is a derivative of the Aroon indicator, and its main purpose is to identify the trend’s momentum. The Aroon Oscillator is calculated by…
View On WordPress
1 note
·
View note
Text
|AVERAGE TRUE RANGE|TECHNICAL ANALYSIS INDICATOR|
The Average True Range (ATR) is a technical analysis indicator used to measure volatility in the stock market. The indicator was developed by J. Welles Wilder Jr. and was introduced in his book, “New Concepts in Technical Trading Systems.” ATR is a useful tool for traders and investors as it helps them to determine the strength of a trend, identify potential reversal points, and set stop-loss…

View On WordPress
1 note
·
View note
Text
|ULTIMATE OSCILLATOR|TECHNICAL ANALYSIS INDICATOR |
The Ultimate Oscillator (UO) is a technical analysis indicator used to analyze the stock market. It is a momentum oscillator that combines three different time periods to give a more accurate picture of a stock’s price movements. The UO is calculated by taking the weighted average of three different timeframes of the stock’s closing prices, usually 7, 14, and 28 periods. The formula for the UO…

View On WordPress
1 note
·
View note
Text
|STANDARD DEVIATION (SD)|TECHNICAL ANALYSIS INDICATOR|
The Standard Deviation (SD) is a popular indicator used in technical analysis of the stock market. It is a statistical measurement that calculates the amount of variability or dispersion in a set of data points, typically a stock’s closing price over a given period. It is used to measure the volatility of a stock, which can help traders and investors to assess the risk of investing in that…

View On WordPress
0 notes
Text
AWESOME OSCILLATOR
The Awesome Oscillator is a technical analysis indicator developed by Bill Williams. It is used to measure market momentum and is based on the difference between a 34-period simple moving average (SMA) and a 5-period SMA, both applied to the median price (HL/2). The Awesome Oscillator is represented by a histogram that fluctuates above and below a zero line. When the histogram bars are above the…

View On WordPress
0 notes
Text
KELTNER CHANNELS
Keltner Channels is a technical indicator that is used by traders and investors to identify potential price breakouts, trend changes and volatility in the market. The indicator is named after Chester Keltner, who introduced it in his 1960 book, “How to Make Money in Commodities.”Keltner Channels are plotted using three lines: a middle line that is typically a 20-period exponential moving average…

View On WordPress
1 note
·
View note
Text
DONCHAIN CHANNEL
Donchian Channels is a technical analysis indicator developed by Richard Donchian in the 1970s. The indicator is used to identify the current price range of a security or asset, and to determine the direction of the trend. The indicator is composed of two lines, known as the upper and lower channels, which represent the highest high and lowest low prices over a specified time period.The Donchian…

View On WordPress
1 note
·
View note
Text
ACCUMULATION/DISTRIBUTION LINE (A/D Line)
The Accumulation/Distribution Line (A/D Line) is a technical indicator used by traders and investors to analyze the flow of money into or out of a security. The A/D Line indicator was developed by Marc Chaikin and is based on the idea that volume precedes price movement.The A/D Line measures the amount of buying and selling pressure in a security by considering both the price and volume of…

View On WordPress
1 note
·
View note
Text
SUPERTREND
SuperTrend is a technical indicator used by traders to identify trend direction and potential entry and exit points. It is a popular indicator among traders who use trend-following strategies.The SuperTrend indicator is based on the Average True Range (ATR) and the price movement of the asset being traded. The ATR is used to determine the volatility of the asset, and this information is then used…

View On WordPress
1 note
·
View note
Text
AVERAGE TRUE RANGE (ATR)
The Average True Range (ATR) is a technical analysis indicator used to measure the volatility of an asset. Developed by J. Welles Wilder, ATR is a moving average of the true range over a certain period of time.The true range is the largest of the following three values: the distance between the high and low of the current period, the distance between the previous close and the current high and…

View On WordPress
1 note
·
View note