#Descending Triangle
Text
|ASCENDING AND DESCENDING TRIANGLES|CHART PATTERN|TECHNICAL ANALYSIS|
Ascending Triangle and Descending Triangle are two important chart patterns used in technical analysis to predict the future price movement of a stock. These patterns are formed by two trend lines that converge to a point, indicating a potential breakout in the price.An Ascending Triangle is formed by a horizontal resistance line and a rising trend line that connects a series of higher lows.
The…

View On WordPress
0 notes
Text

Throws him against a wall like a sopping wet plush
Commission for @verydeadwitch
#haHAH SEE THEY'RE NOT SQUARES THEY'RE TRIANGLES THIS TIME!!!!#← said in the voice of someone slowly descending into madness#my art#art#artists on tumblr#artwork#digital art#bowser fanart#peach x bowser#king bowser#Bowser#smb#smb fanart#nintendo
216 notes
·
View notes
Text
what's. what the fuck wrong with them. good grief. I need to put the three of them in a jar and study them
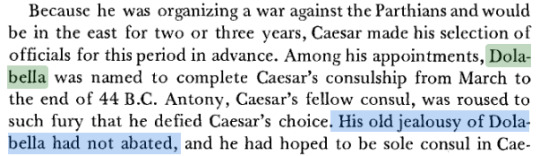
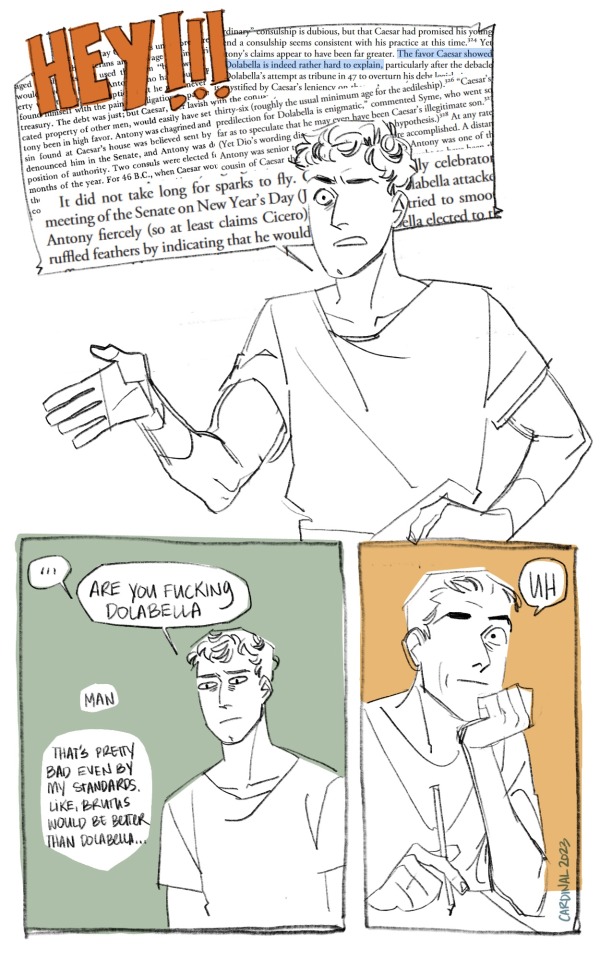
Mark Antony: A Biography, Eleanor Goltz Huzar
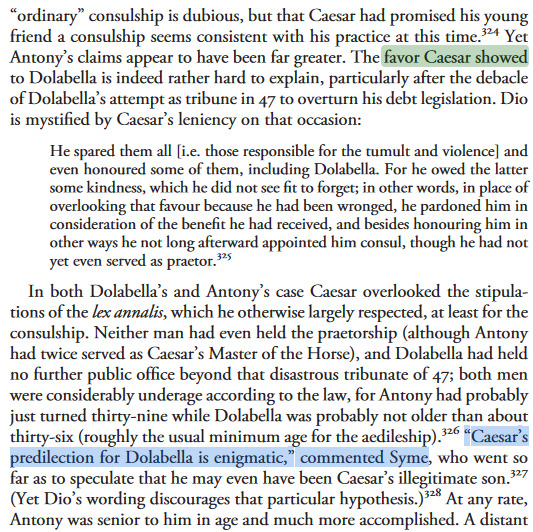
Julius Caesar and the Roman People, Robert Morstein-Marx
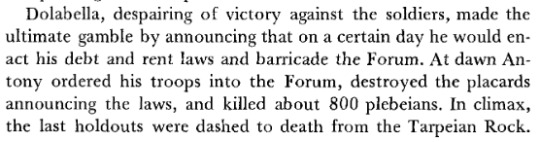
Mark Antony: A Biography, Eleanor Goltz Huzar
#if you follow me elsewhere you may have witnessed me descend into some kind of dolabella madness yesterday#which took an abrupt left turn when i got to the 11th philippic like YEAH ACTUALLY TEAR THE BITCH APART. GET HIM CASSIUS#justice for my man trebonius. cicero's letter to him got me feeling so emotional#this love triangle political clown show bullshit has a body count that makes the tris homines look moderate as a whole good GOD#gaius julius caesar#mark antony#roman republic tag#drawing tag#komiks tag
202 notes
·
View notes
Text
multishipping is a superpower you neeeeeeeeeeed to have when you love getting into shitty gay media with found family because OF course they're going to make an incest map of all the characters and your otp will almost definitely not be endgame. of course they're going to pair the main guy and girl together as endgame just because. and I mean you COULD be a hater about it and curse the writers and throw a four year long fit but it's so much more fun when you just make your peace with the fact that this was always going to happen and pretend everyone is in a happy little polycule as they go through 18575879 different pairings you know aren't going to last because fandom and just the experience of being a fan is so much more fun that way!!!
#like one thing about me is i almost NEVER get the ship i want in any show ever#but WE PERSIST WE ADAPT#every ship has their moments! romance is dumb anyway but it's nice to see different characters connecting#some of yall were clearly not raised on glee smh#like as long as the characters experience new things and grow you know. a show is more than one ship#hsmtmts#glee#jane the virgin#never have i ever#love victor#community#xo kitty#there are sooooooo many of these I've lost count lol#heartbreak high#we are lady parts#walp#htgawm#pretty little liars#descendants#doafp#don't worry on the flip side i also support being a hater. god knows i was the biggest hater of the main ship on SO many of these shows#at one point#but it's just...easier for you...when you learn to make peace with allos being gross lol#like god knows i would NAWT write jafael or rina endgame in any universe#but at the end of the day...sigh...im just glad the lomls jane and gina are happy ig#i love seeing them all cute and happy and even the men have their moments sometimes#the only love triangle i have ever won in my life is cazzie and im still gloating over it 3 years later. so.#oh and maybe benvi ig#ginny and georgia#girlblogging.pdf
43 notes
·
View notes
Text

OOGA BOOGA BILL CIPHER JUMPSCARE RAHAHAHAH
have this funky drawing of bill that actually didn’t take me that long
#bill cipher#gravity falls#bill ci the triangle guy#Billy Bob art#he’s so funky#did yall ever realize how much will wood fits him#because I did#anyway#descends
34 notes
·
View notes
Text

Den här månaden har jag sett om en massa film, framför allt en massa lättittade filmer.
Descendants (2015) [👍🔁]
Descendants 2 (2017) [👍🔁]
Descendants 3 (2019) [👍🔁]
Haunted by Murder: An Aurora Teagarden Mystery (2022) [👍🔁]
Honeymoon, Honeymurder: An Aurora Teagarden Mystery (2021) [👍🔁]
How to Con a Con: An Aurora Teagarden Mystery (2021) [👍🔁]
Journey to Promethea (2010) [👎🆓]
Sunkig fantasy med Billy Zane i ett mindre roll, är rätt säker på att Zanes scener filmades separat från övriga filmen.
Jurassic Triangle (2024) [👎🆓]
Om man tror att man får Bermuda Triangeln+Donosaurier så tror man helt fel. Muterade skorpionkentaurer däremot. Det serveras det friskt utav.
Mord och Inga Visor: Den siste frie mannen / Murder, She Wrote: The Last Free Man (2001) [👍]
Reunited and it Feels So Deadly: An Aurora Teagarden Mystery (2020) [👍]
Röde Falken / Magic Carpet, the (1951) [🆓]
Silk (1986) [👎]
Skrot Hopp & Kärlek (2024) [🎭]
Skränig och repetiv, känns som något som klippts ihop av saker som funkat i andra föreställningar. Okej, men ändå lite av en besvikelse.
Something New: An Aurora Teagarden Mystery (2023) [👍]
Prequel till originalserien med Candace Cameron Bure, inte fantastisk med visar att man mycket väl kan gå vidare på nya spår.
Til Death Do Us Part: An Aurora Teagarden Mystery (2021) [👍🔁]
Tja, gillar man Teagarden-filmerna kan man ge Something New chansen. Journey to Promethea och Jurassic triangle gör man dock bäst i att hoppa över.
#senast sedda filmer#Descendants#Descendants 2#Descendants 3#Haunted by Murder: An Aurora Teagarden Mystery#Honeymoon#Honeymurder: An Aurora Teagarden Mystery#How to Con a Con: An Aurora Teagarden Mystery#Journey to Promethea#Jurassic Triangle#Mord och Inga Visor: Den siste frie mannen#Murder She Wrote: The Last Free Man#Reunited and it Feels So Deadly: An Aurora Teagarden Mystery#Röde Falken#the Magic Carpet#Silk#Skrot Hopp & Kärlek#Something New: An Aurora Teagarden Mystery#Til Death Do Us Part: An Aurora Teagarden Mystery#aurora teagarden#vallarna#fridluftsteater#senast sedda film#film#filmlista
13 notes
·
View notes
Text

redesigned penny in celebration of all the new billposting recently
#gravity falls#sexyman descendants#art tag#bill cipher#well not much of a redesign#but i did want to give her more triangles#and take away her hair bows bc i felt they made their face too busy visually
11 notes
·
View notes
Text

739.
#FORBIDDEN JEREMIAH LORE AT LAST#oh?#oh???#oh??????????????????????????????????????????????#i am barking and snarling and laughing and biting and cackling and biting and biting and biting and ---#i have to pick one background character who was in twelve episodes to go bugfuck insane about. i have to.#you're telling me that laura married jeremiah in 1780ish. married edward in 1890ish. and then got in a love triangle/throuple gone wrong;#with jeremiah and edward's identical descendants (?) in 1956. okay. okay. cool cool cool cool cool. cool.#the news from collinsport#jeremiah collins
11 notes
·
View notes
Text
My fanfic drafts from 25 years ago: cishet nonsense with cheating, love triangles, and wack dynamics plus various bigotries.
Me now: But what if healthy queer????
#Notes by Nikki#one story unironically features a purity pledge#as well as some fun sex negativity#another features two love triangles#yet another features some casual homophobia#Baby Nikki was not well#thank God I didn't continue to descend#into tradcath vileness#as per my desperate desire to please my father#fanfic#fan fic#fanfiction#fan fiction#writing#my writing
10 notes
·
View notes
Text
Having my first actual Good Curse Day in uhhh seven months? Am trying my best not to do the thing where I immediately panic about it
#curseblogging#will it be a 'your baseline is back to where it was last summer' thing?#or a 'enjoy 2-3 really good days for no apparent reason before you descend back into the sludge' thing?#who knows! not me!#not quite at 'i can physically feel my mental illnesses switching back on' energy levels but probably close#anyway i sewed a bunch of triangles and also did *laundry*!!#wow!!
29 notes
·
View notes
Text
the only bad thing about dnd is that your mutuals don’t know what happened on the latest episode
#I’m playing a bisexual rabbit knight who’s been unwittingly dragged into a love triangle even though the only person he wants to fuck is#his god (and maybe the god’s descendant who happens to be his academic rival but he’s repressing that)
1 note
·
View note
Text
Attn: Quilting side of tumblr
I respect you and fear you. You are far stronger than any other textile craft I can think of. Please never use this power for evil.
#i got three bags of fabric from a quilter and i am descending into Eldritch madness#this last bag is just fucking ribbons amd triangles of flannel#also if anyone wants in i will fucking pay you to get this out of my house. please take the madness out of my hands
0 notes
Text
Unlock the Secrets of Trading with Top Chart Patterns! Explore the world of chart patterns with Funded Traders Global. From understanding the basics of technical analysis to recognizing common chart patterns like head and shoulders, double tops, and flags, our blog equips you with the knowledge to enhance your trading skills. Discover advanced patterns like pennants, wedges, and harmonic patterns, and gain practical tips for effective trading. Improve your risk management, pinpoint entry and exit points, and combine chart patterns with technical indicators. Start your journey towards trading success today with Funded Traders Global!
#Advanced Chart Pattern#and Descending Triangles#and mini trading#Ascending#Basics of Technical Analysis#Benefits of Recognizing in Chart Pattern#Bullish and Bearish Flags Pattern#candlestick#candlestick Pattern#career in forex trading#chart patterns#classic reversal pattern#common chart patterns#cup and handle pattern#Double top and double bottom patterns#drawdown#financial markets#Forex trading financial freedom#FTG#ftg prop firm#ftg trading#Funded Traders Global#Gaps#Harmonic Patterns#Head and Shoulders Pattern#how to scale into a forex trade#Macro#Master the Market with These Top Chart Patterns for Trading#mastering Forex trading#micro
0 notes
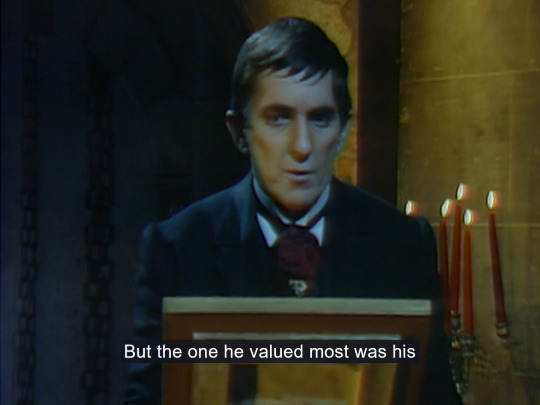
Text
#forexmarket#trader#forex#finance#stocks#chart patterns#bitcoin#cryptocurrency news#descending triangle pattern#ascending triangle pattern#symmetrical triangle#double top pattern#double botttom#triple top#triple bottom#rising wedge#falling wedge#flag patterns#head and shoulders pattern#forexeduline.blogspot.com
1 note
·
View note
Text
GETAWAY CAR
a social media au starring racer!suna and actress!reader

synopsis -> rintarou suna is the top formula one racer for scuderia ferrari, and he would be the top ranked in the world if not for the top driver for redbull racing aston martin: hajime iwaizumi. it’s no secret that suna has a silly celebrity crush on world famous actress [name] miya, and when it hits the tabloids that iwaizumi was seen out with her, it’s all interviewers will ask suna about. will this take their rivalry to a new level? or will suna befriend [name], and be the final match to the gasoline puddle of rumors?
warnings -> suggestive content (nothing explicit), alcohol mentions, swearing, etc.
rating -> PG13
tags/keywords -> smau, social media au, rintarou suna, rintarou suna smau, celebrity smau, racer suna, little bits of humor i hope, angst, racer au, celebrity crush, forced proximity, crush to friends to enemies to ??, love triangle, suna x f!reader
completed ! [07/09 - 08/09]

meet the characters
profile post
table of contents / masterlist
[chapters 6, 7, 8, 10, 11, 13, 14, 15, & 17 owe chapter title brainstorm credits to @itsdragonius]
1. rintarou “big fan” suna
2. boys & their expensive cars
3. a hundred boys in bars
4. is it cool that i said all that?
5. i'd give up everything to be close to you
6. loving him is like driving a new maserati down a dead end street
7. the empathetic hunger descends
8. seeing you tonight... it's a bad idea, right?
9. is she friends with your friends? is she good in bed?
10. i got this one boy, & he won't stop calling
11. clandestine meetings & longing stares
12. losing him was blue / but loving him [is] red
13. don't wanna keep secrets just to keep you
14. you crashed my party & your rental cars
15. he never thinks of me, except when i'm on tv
16. this is me swallowing my pride
17. to kiss in cars & downtown bars
18. touch me while your bros play grand theft auto
19. i feel something when i see you
20. swimming in a champagne sea
21. my heart, my hips, my body, my love
2024 seats…
ferrari: rintarou suna & kotarou bokuto
red bull racing: hajime iwaizumi & tobio kageyama
mercedes amg petronas: tooru oikawa & kiyoomi sakusa
mclaren: atsumu miya & yuuji terushima
alpine (renault): shinsuke kita & aran ojiro
aston martin: satori tendou & suguru daishou
kick sauber: shoyo hinata & tetsurou kuroo
haas: lev haiba & akira kunimi
williams: keiji akaashi & kenma kozume
visa rb (torro rosso): issei matsukawa & takahiro hanamaki
*some of these teams will be less relevant to the plot & won’t come up often
others…
*other characters are most likely either mechanics, not involved, or sponsors. (ex: osamu miya’s onigiri miya is the largest contributing sponsor for mclaren in 2024) + kei tsukishima is a mechanical engineer for scuderia ferrari
taglist - CLOSED
@satoruzlove @idlerin @akumakitsune21 @qualitygiantshoepsychic @dani-shitting-around @alienvarmint @reverie-starlight @tsukiran-blog @xbl00dy-r0s3x @universal-s1ut @koushisbabie @breakmyheartlater @phoenix-eclipses @ris-krispie @coyloves @2baddies-1porsche @girlkissersco @dontmindtheevie @yuzurins @reekapeeka @leave-rae-alone @usmell4 @noideawhothatis @moonlit-mizukage @thirtykiwis @highkey-fangirling @ast4rg1rl @razberrywrites @zamorazz @k0z3me
#haikyuu!!#hq imagines#hq x reader#hq#hq hcs#rintarou suna#haikyu x reader#haikyuu smut#suna rintaro haikyuu#hq smut#haikyuu angst#haikyuu fanfiction#haikyuu x reader#haikyuu x reader smut#iwaizumi hajime#haikyuu#haikyū!!#haikyu fluff#haikyu smut#suna rintaro#rintaro suna#rintarou x reader#rintarou suna smut#suna rintaro smut#suna rintaro x reader#suna rintarou smut#suna rintarou#iwaizumi x reader#haikyuu iwaizumi#hq iwaizumi
2K notes
·
View notes
Text
Descending Triangle
Decoding the Descending Triangle: A Technical Analysis Tool for Traders
Technical analysis is a vital tool for traders in the financial markets to make informed judgements. The descending triangle is a common chart pattern encountered by traders. This pattern has received a lot of attention because of its potential to provide useful insights about future price fluctuations. We will look at the descending triangle pattern, its properties, and how it may be used in trading techniques in this post.
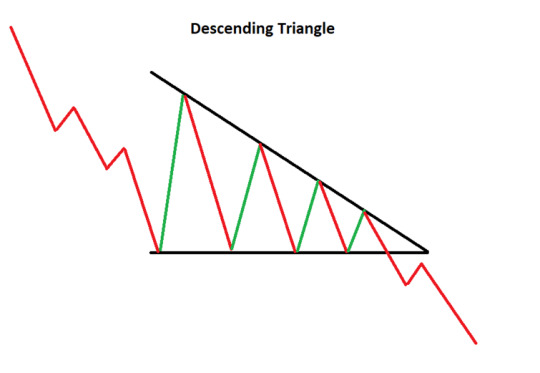
Understanding the Descending Triangle:
A descending triangle is a bearish chart pattern that appears during a downtrend. It has a succession of lower highs and a horizontal support level connecting the swing lows. The descending triangle looks like a right-angled triangle, with the descending upper trend-line intersecting the horizontal support line.
The pattern denotes a period of consolidation and a conflict between buyers and sellers. Buyers are unable to drive the price higher as it approaches the horizontal support level, resulting in lower swing highs. In the meantime, sellers gain confidence and become more aggressive, perhaps leading to a collapse below the support level.
What does it tell you?
The falling triangle pattern implies a conflict between buyers and sellers, with sellers gradually gaining an advantage. Lower highs suggest that buyers are less eager to drive the price up, whilst the horizontal support level indicates that sellers are putting pressure to keep the price from rising. This tug of war frequently results in a breakout, which provides traders with significant information about probable future price movements.
How to Spot a Descending Triangle?
Identifying a falling triangle necessitates a sharp eye for chart patterns. Here are the critical steps to identifying this formation:
Downtrend: Look for a definite downtrend in the price chart, which is characterised by a series of lower lows and lower highs.
Horizontal Support: Locate a horizontal support level generated by many touches at the same price point.
Descending Trend-line: Draw a trend-line linking the lower highs to form a downward-sloping line.
If the price frequently bounces off the support level while the descending trend-line remains intact, you've most certainly spotted a descending triangle pattern.
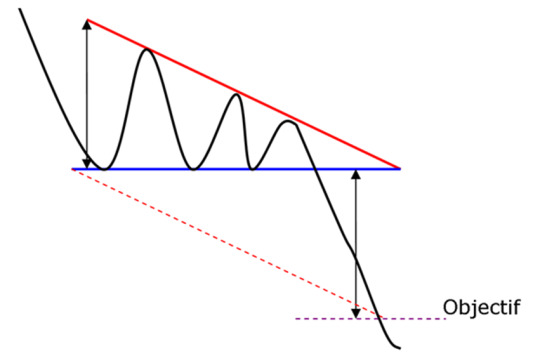
Descending Triangle Breakout Strategy:
Trading a descending triangle pattern requires persistence, close attention to detail, and prudent risk management. Here is a detailed instruction:
Confirm the Pattern: Wait for the price to at least twice contact the horizontal support level and the falling trend-line to hold with lower highs in order to confirm the pattern.
Entry Point: When the price dips below the horizontal support level, start a short position. This breakdown suggests that purchasing demand has been outweighed by selling pressure, which could result in a further downturn.
Stop Loss: To reduce potential losses in the event of a false breakout or an unexpected reversal, set a stop-loss order above the breakout point.
Profit Target: Calculate the price objective depending on the height of the pattern. Project the distance from the highest point of the triangle to the support level downward from the breakout point.
Risk Management: Before entering a trade, calculate your risk-reward ratio to ensure that prospective earnings outweigh potential losses. Consider altering the position sizes and leverage as needed.
Descending Triangles with Heikin-Ashi Charts:
Heikin-Ashi charts are a sort of candlestick charting technique that includes time and volume information to create a more seamless portrayal of price patterns. Using Heikin-Ashi charts to analyze a descending triangle, traders can acquire extra information into the pattern's power.
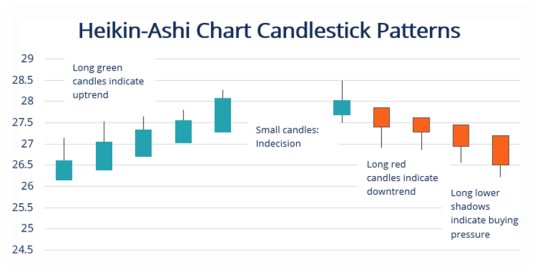
Using modified candlestick calculations, the Heikin-Ashi approach helps to filter out noise and determine the dominant trend. When applied to descending triangles, it can assist traders more accurately detect future breakouts. A convincing bearish breakthrough on a Heikin-Ashi descending triangle chart affirms the downtrend's continuation, providing a stronger signal to go short.
Descending Triangle with Moving Averages:
Moving averages are frequently employed as technical analysis indicators to smooth out price data, spot probable trend reversals, or confirm current trends. Trading professionals frequently use moving averages to further validate the bearish character of descending triangle patterns.
Traders can see how the price responds to these trend-following indicators by superimposing moving averages on a descending triangle chart. Using a 200-day moving average along with a shorter-term moving average, like the 50-day moving average, is a typical strategy. A bearish crossover, where the shorter-term moving average crosses below the longer-term moving average, strengthens the likelihood of a downward breakout and emphasizes the descending triangle's negative bias.
Advantages and limitations of the descending triangle:
The ability of the descending triangle to offer traders with a clear and specific signal to start a short position in the market is one of its primary advantages. This pattern often suggests that the asset's price is about to break down, which can be a rewarding chance for traders who can capitalize on this movement. Furthermore, the descending triangle pattern can be utilized to identify probable price goals for the asset, which can assist traders in more efficiently planning their transactions.
It is crucial to highlight, however, that the descending triangle is not without flaws. As with all chart patterns, it is susceptible to false signals and market volatility, which can result in unanticipated price moves that contradict the pattern's predicted consequences. As a result, traders should always use caution and not base their trading decisions only on this pattern.
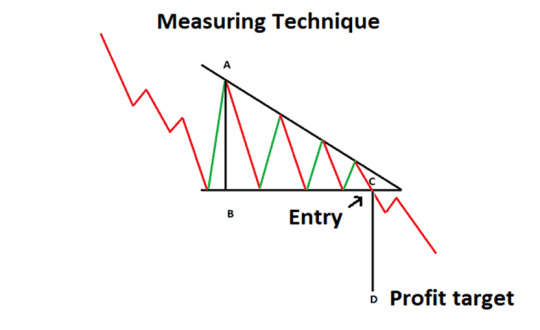
Descending triangle measuring technique:
To calculate the descending triangle pattern, traders often begin by locating the pattern's support level, which is the horizontal line connecting the asset's lowest price points. After establishing this line, traders can build a trend-line connecting the asset's declining highs. The pattern's "apex" is the point at which these two lines intersect.
Traders can compute the probable price target for the asset by measuring the distance between the support level and the apex and subtracting this number from the support level. This formula gives traders with a predicted price goal for the asset, which they can use to better plan their trades.
Conclusion:
In conclusion, the descending triangle is a negative chart pattern that can be used to forecast future price movements in financial markets. While this pattern has some positives, such as providing traders with unambiguous signals to begin short positions and identify potential price goals, it also has limitations and false signals. As a result, traders should exercise caution when making trading choices and use the descending triangle in conjunction with other technical indicators and fundamental analysis.
0 notes
Last Seen Blogs

alchemy-of-spirit
Merlyn The Dragon Alchemist

bdub1993
Brandon Thompson

rivenfowst
Rivenfowst

alcadnes
Alcadnes

quintinusrexblog
Rex's Massive Schlong