
Don't wanna be here? Send us removal request.
Statistics
We looked inside some of the posts by adorableparrot and here's what we found interesting.
Average Info
Notes Per Post
1
Likes Per Post
1
Reblog Per Post
0
Reply Per Post
0
Time Between Posts
5 days
Number of Posts By Type
Text
4
Last Seen Tumblr Blogs


Fun Fact
Tumblr has a low social media market share in South America.
Text
Plotting Graphs with Python
Code:

Outputs:
Diameter-Depth Relationship

Summary:
As you can see in the scatter plot, there is not a strong relationship between these two variables. First, we take a look at small diameters, the depth increases with larger diameters. However, if we take a look at the largest diameters, when the diameter rises, the depth doesn't increase as well; instead, the depths are pretty small.
Conclusion:
As there is not a strong relationship between diameter and depth, diameter might not be the only reason that affect the depth of a crater.
2. The Distribution of Craters

Summary: In order to see the distribution of the latitude of craters, I divided the latitude into 15-degree sections. As you can see in the bar chart, most of the craters are located in latitude from -30 to 0. Also, the latitude form -90 to -75 and 75 to 90 have the least number of craters.
Conclusions:
Overall, the craters are concentrated at the Equater of Mars, and the North and South poles are the least likely areas to be hit by a metroite, an astroid, etc.
0 notes
Text
Week 3 of DataViz with Python
Code:

Results:
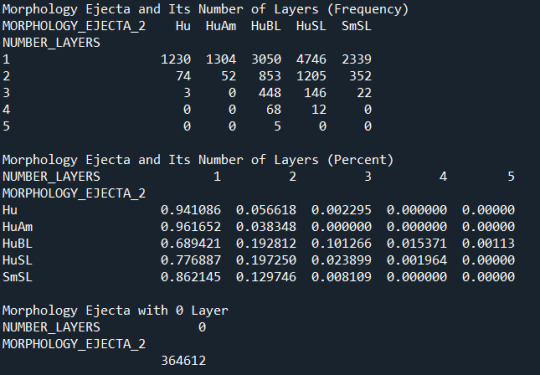
The relationship between the patterns of morphology ejecta and number of layers Description: In the analysis, I used the five patterns I selected in last assignment. By observation, I noticed that none of the pattern has 0 layer, so I also conduct the "Morphology Ejecta with 0 layer" to see if there exists a pattern with 0 layer.
2. The relationship between the diameter of craters and number of layers Description: So, in order to find out the relationship, I divided the dataset into 10 sections, each section has same number of data. By doing this, I can find out whether the number of layers increases as diameter rises.

Discussions:
the Morphology Ejecta-Layer Relationship So, from the chosen 5 patterns, we can say that most of them consist of 1 cohensive layer. Furthermore, the pattern "HuBL" can be a 5-layer craters, and "HuSL" have a maximum layers of 4. "Hu" and "SmSL" have a maximum 3 cohensive layers. "HuAm" has no larger than 2 layers.
Missing Data Those patterns with 0 layer are the missing data, so we can know that all mars craters have at least one cohensive layer.
the Diameter-Layer Relationship In this part, I divide the dataset of diameter evenly to see whether the overall change in the number of layers. So, we can see the result above, and the anwser is yes, when the diameters rise, the appearances of higher number of layers is increased.
Conclusions:
So now we can know that craters with larger diameters are more likely to have more maximum cohensive layers.
0 notes
Text
The First Data Analysis
Code:
import pandas as pd import numpy as np
data = pd.read_csv('marscrater_pds.csv', low_memory = False)
print("The diameter of craters that causes HuSL") sub1 = data[(data["MORPHOLOGY_EJECTA_2"].str.contains("HuSL"))] c1 = sub1["DIAM_CIRCLE_IMAGE"].value_counts(sort=True) print(c1.head(30))
print("\nThe diameter of craters that causes HuBL") sub2 = data[(data["MORPHOLOGY_EJECTA_2"].str.contains("HuBL"))] c2 = sub2["DIAM_CIRCLE_IMAGE"].value_counts(sort=True) print(c2.head(30))
print("\nThe diameter of craters that causes SmSL") sub3 = data[(data["MORPHOLOGY_EJECTA_2"].str.contains("SmSL"))] c3 = sub3["DIAM_CIRCLE_IMAGE"].value_counts(sort=True) print(c3.head(30))
print("\nThe diameter of craters that causes HuAm") sub4 = data[(data["MORPHOLOGY_EJECTA_2"].str.contains("HuAm"))] c4 = sub4["DIAM_CIRCLE_IMAGE"].value_counts(sort=True) print(c4.head(30))
print("\nThe diameter of craters that causes Hu") sub5 = data[(data["MORPHOLOGY_EJECTA_2"].str.contains("Hu"))] c5 = sub5["DIAM_CIRCLE_IMAGE"].value_counts(sort=True) print(c5.head(30))
print("\nNumber of Layer = 0") sub6 = data[(data["NUMBER_LAYERS"]==0)] c6 = sub6["DIAM_CIRCLE_IMAGE"].value_counts(sort=True) print(c6.head(30))
print("\nNumber of Layer = 1") sub7 = data[(data["NUMBER_LAYERS"]==1)] c7 = sub7["DIAM_CIRCLE_IMAGE"].value_counts(sort=True) print(c7.head(30))
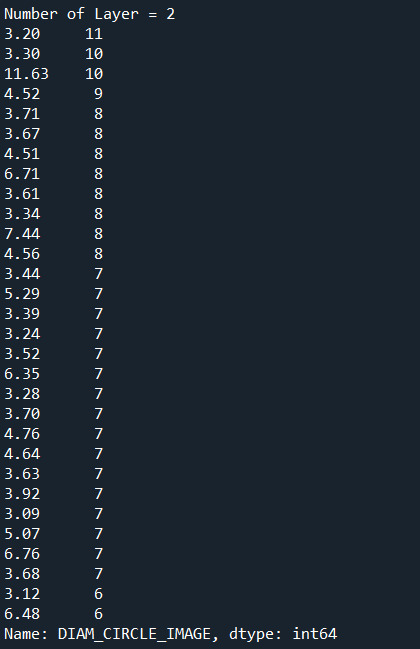
print("\nNumber of Layer = 2") sub8 = data[(data["NUMBER_LAYERS"]==2)] c8 = sub8["DIAM_CIRCLE_IMAGE"].value_counts(sort=True) print(c8.head(30))
print("\nNumber of Layer = 3") sub9 = data[(data["NUMBER_LAYERS"]==3)] c9 = sub9["DIAM_CIRCLE_IMAGE"].value_counts(sort=True) print(c9.head(30))
print("\nNumber of Layer = 4") sub10 = data[(data["NUMBER_LAYERS"]==4)] c10 = sub10["DIAM_CIRCLE_IMAGE"].value_counts(sort=True) print(c10.head(30))
print("\nNumber of Layer = 5") sub11 = data[(data["NUMBER_LAYERS"]==5)] c11 = sub11["DIAM_CIRCLE_IMAGE"].value_counts(sort=True) print(c11.head(30))
Outputs:
the relationships between diameter and morphology ejecta
First of all, as there are may types of morphology ejecta, I would choose the top 5, which are HuSL, HuBL, SmSL, HuAm, and Hu, to analyse their correlations. Also, I chose the top 30 diameters to find the result. Below are the optputs.


2. Does the diameter increase as the number of layers increases?
I think I should change my previous topic after coding with Python because I think it is improper. That is, I came up with this topic, which also relates to the analysis of diameter of craters. So, after checking the type of morphology ejectas, I want to know whether the maximum number of cohensive layers identified is related to the diameter of craters. Also, this time I chose the top 30 as my samples to determine the relationship between the variables. Here's the results.


Conclusions:
In the first result, diameters from 3.09 km to 7.57 km are the ones that are most likely to form a HuSL crater, diameters from 5.05 km to 7.77 km are the ones that are most likely to form a HuBL crater, diameters from 3.03 km to 4.82 km are the ones that are most likely to form a SmSL crater, diameters from 3.07 km to 7.18 km are the ones that are most likely to form a HuAm crater, diameters from 3.26 km to 6.76 km are the ones that are most likely to form a Hu crater.
In the second analysis, yes, the diameter increases as the number of layers increases. Although there are large diameters with less maximum cohensive layers, the overall data shows that the diameter of crater and the number of layers are correlate.
0 notes
Text
Get My Research Project Started
After viewing the codebook for the Mars Craters study, I am interested in crater formations on the surface of Mars.
The crater formation is a decent topic to start with, and the information which I am most interested in is the relationship between the depth of each crater and the diameter of its rim. I will add variables representing the diameter of rims and the depth of craters to my codebook.
Another topic I'm interested in is the ejecta morphology. There are different types of crater ejecta morphologies, so I am curious about whether different sizes of the crater rims lead to a specific type of crater ejecta morphology.
Also, I found research about the correlation of ejecta and interior morphologies with diameter. The researchers focus on seven ejecta and nine interior morphologies associated with 3819 craters >8 km in diameter across the entire Martian surface. The results of the analyses are that changes in ejecta and interior morphology correlate with the increase in carter diameter.
Overall, based on the literature review, I believe that the diameter of a crater will lead to a certain type of ejecta morphology.
1 note
·
View note