
Blog about building Arduino Pollution Sensor project based on Sharp Optical Dust Sensor GP2Y1010AU0F
Don't wanna be here? Send us removal request.
Statistics
We looked inside some of the posts by arduinosensor and here's what we found interesting.
Average Info
Notes Per Post
1
Likes Per Post
1
Reblog Per Post
0
Reply Per Post
0
Time Between Posts
3 months
Number of Posts By Type
Note
5
Text
12
Last Seen Tumblr Blogs


Fun Fact
Tumblr was named as a finalist in Lead411’s New York City Hot 125 in Aug 2010.
Note
I´m using this sensor and in all codes they used LOW (to turn on the led) and HIGH (to turn off the led), I supposed they all are incorrect, but I take some samples and sesnor records very well using this "inverted" command, What do you know about it?
You’re right. Because pure sensor uses inverted and waveshare adapter inverts it. So, I have this code:
//by default this program is configured for Waveshare Dust Sensor board//if you use GP2Y1010AU0F only then uncomment following line//#define PURE_SHARP_GP2Y1010AU0F // uncomment it if you use GP2Y1010AU0F#if defined (PURE_SHARP_GP2Y1010AU0F) #define IR_LED_ON LOW #define IR_LED_OFF HIGH #define DIV_CORRECTION 1.0#else //in case if you use http://www.waveshare.com/wiki/Dust_Sensor #define IR_LED_ON HIGH #define IR_LED_OFF LOW #define DIV_CORRECTION 11.0 //Waveshare uses volt divider 1k/10k, so corection is needed#endif
0 notes
Note
Cześć, Wlasnie przegladnalem calego Twojego bloga :) nie jest tego wiele, ale na pewno tutaj jeszcze wroce. Wlasnie planuje stworzenie czujnika w oparciu o GP2Y1010AU0F i WeMos D1 Mini. To co mnie martwi to kalibracja i to co dokladnie ten czujnik mierzy. Nie jest dokladnie powiedziane czy mierzy PM2.5 czy PM10. Na innych stronach widzialem ze ludzie mieli 2 czujniki i pokazywaly rozne wyniki. Czy masz pomysl jak kalibrowac ten czujnik? Z tego co widze masz 2 czujnik. Mozesz wiec porownac wyniki
GP2Y1010AU0F to masakra. Nie nadaje się do skutecznego pomiaru.
Tutaj nie kalibrowałem. Musi mierzyć PM2.5 https://github.com/vlytsus/arduinosensor/blob/master/arduino_sensor_main.ino
0 notes
Note
Dear sir, I am trying use pms5003 on NodeMcu just the same you do. I upload the arduino code via Arduino IDE but fail. The error messages show "espcomm_upload_mem failed". Did I do something wrong? I am appreciated for your help. Thanks.
Try this: https://community.blynk.cc/t/espcomm-upload-mem-failed/29517/4
0 notes
Text
Matlab Euro CAQI levels converter for Thingspeak service
I decided to move all calculations & aproximations from arduino code to Thingspeak service. Sensor will be only responsible of uploading raw data to Thingspeak service. This significantly reduces my efforts to upoad new software to sensor module.
Here are functions written in Matlab language that is used by Thingspeak to perform data processing and converting PM2.5 levels to CAQI Euro standard.
%// Euro AQI Standard %// AQI formula: https://en.wikipedia.org/wiki/Air_Quality_Index function output = toAQI(I_high, I_low, C_high, C_low, C) aqiResult = (I_high - I_low) * (C - C_low) / (C_high - C_low) + I_low end function output = calculateAQI25(density) d10 = density * 10; if d10 <= 150 output = toAQI(25, 0, 150, 0, d10); elseif d10 <= 300 output = toAQI(50, 26, 300, 151, d10); elseif d10 <= 500 output = toAQI(75, 51, 500, 301, d10); elseif d10 <= 1000 output = toAQI(100, 76, 1000, 501, d10); elseif d10 <= 3000 output = toAQI(300, 101, 3000, 1001, d10); else output = 1001; end end %// Polution levels function output = aqi25captions(density) if density <= 25 output = 'Perfect =)'; elseif density <= 50 output = 'Good :)'; elseif density <= 75 output = 'Moderate :|'; elseif density <= 100 output = 'Unhealthy :('; elseif density <= 200 output = 'Bad :O'; else output = 'Hazardous X('; end end
0 notes
Text
Formula to calculate CAQI Index
Formula to calculate CAQI is described on Wikipedia. https://en.wikipedia.org/wiki/Air_quality_index#Europe
Unfortunately there are only few examples realized in code on the internet.
// AQI formula: https://en.wikipedia.org/wiki/Air_Quality_Index#United_States int toAQI(int I_high, int I_low, int C_high, int C_low, int C) { return (I_high - I_low) * (C - C_low) / (C_high - C_low) I_low; } //thanks to https://gist.github.com/nfjinjing/8d63012c18feea3ed04e int calculateAQI25(float density) { int d10 = (int)(density * 10); if (d10 <= 0) { return 0; } else if(d10 <= 120) { return toAQI(50, 0, 120, 0, d10); } else if (d10 <= 354) { return toAQI(100, 51, 354, 121, d10); } else if (d10 <= 554) { return toAQI(150, 101, 554, 355, d10); } else if (d10 <= 1504) { return toAQI(200, 151, 1504, 555, d10); } else if (d10 <= 2504) { return toAQI(300, 201, 2504, 1505, d10); } else if (d10 <= 3504) { return toAQI(400, 301, 3504, 2505, d10); } else if (d10 <= 5004) { return toAQI(500, 401, 5004, 3505, d10); } else if (d10 <= 10000) { return toAQI(1000, 501, 10000, 5005, d10); } else { return 1001; } }
0 notes
Text
Calibrated data
I succed to calibrate my sensor using nearest official sensors. Sensor real time data is published on my open Thingspeak channel.
https://thingspeak.com/channels/229635
0 notes
Text
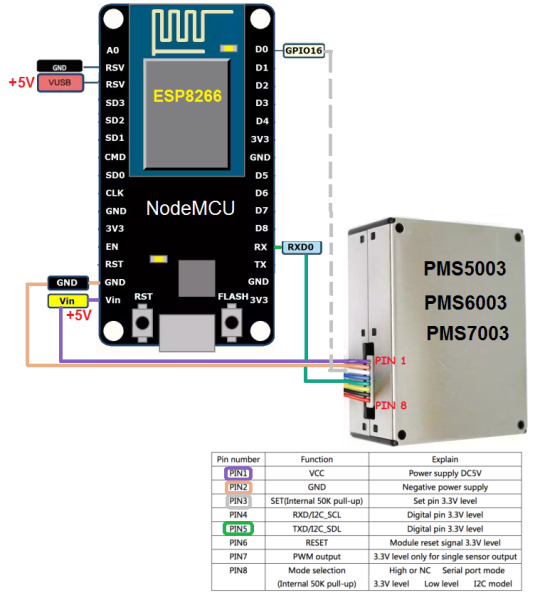
PMS5003 sensor in action
I suceed to build my second sensor. This time it is more expensive. PMS5003 is not analog sensor like Sharp GP2Y1010AU0F. PMS5003 is laser-based sensor with built in microcontroller that performs all required calculations and sends digital data messages to its TXD pin5. You could use other sensors like PMS6003, PMS7003 and even older ones like PMS1003 or PMS3003. They all could be connected in the same way, just pay attention at message length in the source code (If I am not wrong PMS5003/6003/7003 uses 32byte long messages but PMS3003 uses 24bit).
My first workingh prototype was connected to NodeMCU by only 3 wires: +5V, GND and RX. It was enough to activate sensor and start receiving some data on RX line.
PMS5003 requres +5V but data lines should be connected to 3.3V levels which is used by NodeMCU
* Be aware if you would like to connect PMS5003 to Arduino you should use 5<=>3.3v logic level converter.
Also please note that some NodeMCU versions dont support 5V on Vin pin. In my case I have chinese clone LoLin NodeMCU V3 board that has 5V on reserved pins. The simpliest test is to connect power to PMS5003 PIN1 and PIN2 and you should hear a fan noise immediately.
I’ve built my 1st prototype and succesfully programmed using article from DFRobot: https://www.dfrobot.com/wiki/index.php/PM2.5_laser_dust_sensor_SKU:SEN0177
Although their sample code is for Arduino it works fine on NodeMCU too.
Following diagram has some additional pin connected to digital output but it is not requred for prototype. I used it to force PMS5003 to sleep and save a bit power between measurements. I will describe ti in my next post, together with my source code.
Usefull links:
https://www.dfrobot.com/wiki/index.php/PM2.5_laser_dust_sensor_SKU:SEN0177
http://aqicn.org/sensor/pms5003-7003/
https://github.com/vlytsus/demcusensor/blob/master/dust_wifi.ino
1 note
·
View note
Text
ESP8266 NodeMCU
I have been looking for a simple solution to connect pollution sensor to the network and push data to colud for aggregation & visualisation. Arduino is good if you have USB connection to some PC that is connected to internet. But unfortunately there are no simple (and inexpensive) solutions for Arduino if you like to have autonomous device and sporadicaly connect to internet by WIFI to post sensor data. My first solution was ESP8266 WIFI chipset connected to Arduino:

Trying to connect Arduino to WIFI using ESP8266 I accidently found better solution. NodeMCU board - Arduino like microcontroller based on ESP8266 chipset.

Great advantage of NodeMCU is that you could program it with onboard USB bridge using Arduino IDE and there are several frameworks that allow you to control chipset from your Android or iOS device and push data directly from microcontroller to the cloud services using HTTP protocol.
For example you can easily create Android application using Blynk IoT service: http://www.blynk.cc/


Here are several resources about how to program NodeMCU using Arduino IDE:
http://henrysbench.capnfatz.com/henrys-bench/arduino-projects-tips-and-more/arduino-esp8266-lolin-nodemcu-getting-started/
https://www.youtube.com/watch?v=tMRpYmDgkL0
http://www.instructables.com/id/Quick-Start-to-Nodemcu-ESP8266-on-Arduino-IDE/
I have bought cheap chinise NodeMCU clone for 3$ and succesfully programmed it using those tutorials. It is able to enumerate all nearby WIFI routers and connect one with WPA2 authentication & provided password.
0 notes
Text
Plantower PMS 5003
I’ve bought more precise (and 5x-times expensive) sensor - Plantower PMS 5003. Soon I will make a post about how to connect it to arduino and some comparisons with sharp sensor.

0 notes
Text
How optical particle sensors work
Interresting article about subject: https://publiclab.org/wiki/optical-pm
A sensor and a focused light (sometimes a laser) sit at an angle to each other. As a particle passes in front of the light, some light is reflected towards the sensor. The sensor registers a pulse for as long as the particle reflects light to the sensor. If the air is moving at a consistent speed, the length of this pulse can be used to estimate the particle’s diameter...


0 notes
Note
Hi, Thanks for your great articles. I'm trying to do the same PM2.5 measurement by using Arduino Nano + GP2Y1010AU0F, too(without additional Dust Sensor board). But what I'm going to do is using 3.3v as power supply. Because I want to use 3.7v lithium battery for mobile purpose. My question is: By using 3.3v, I found the output voltage isn't reflect to the factor as 3.3/5. Do I need to note anything else? Thank you very much in advance. --Jasper Chen
Hard to say, because GP2Y1010AU0F specification said that sensor power should be 5V. You could try to calibrate it using 5V and then switch to 3.7V to check if it still works well.
0 notes
Text
Read serial data from USB
I would like to read data about PM2.5 levels from Arduino and proceed on my home PC. Then it will be possible to generate charts, send notifications and calculate pollution statistic.
As you know it is not a problem to read serial data from Arduino IDE. But how to proceed it?
I decided to try one of modern popular and simple to use technologies - Node JS. It is JavaScript based framework that dones’t require Web Browser to execute Javascript on computer and it has a lot of libraries to work with web serices as well as communication with local peripheral devices connected to USB or serial ports.

It took me 20 minutes to download & install Node JS software from https://nodejs.org/ and run my first program. It is able to read and print serial data from Arduino.
1: var SerialPort = require('serialport'); 2: var serialport = new SerialPort('COM3'); 3: 4: serialport.on('open', function(){ 5: console.log('Serial Port Opend'); 6: serialport.on('data', function(data){ 7: console.log(data.toString('utf8')); 8: }); 9: });

First of all you need to install “serialport” library that is not included to Node JS package.
Run Node.js command prompt and run
npm install serialport
After that you could call your application. I stored scipt to ardu_serial.js file. So, to call it as application just run it from Node.js console:
1: node ardu_serial.js
In next posts I am going to show how to proceed data in node.js and upload real time data samples to some online pollution analytics service or post messages to popular channels.
0 notes
Text
Calibration
If take to consideration, that sensor uses reflected IR light from dust particles to measure air quality. We can make automatic calibration for cleanest air if sample data without flashing IR LED. No light/reflection means cleanest air.

But unfortunately when I tried to measure dust level without IR, I’ve got maximum dust value, like I have by putting some stick inside the hole :(
Now I don’t understand why is that...
0 notes
Text
New fixed application available
Finally I found and fixed my mistake in formulas. I’ve used incorrect axes in linear equation y = ax + b
or: voltage = a*dust + b
Fixed: dust = (voltage - b) / a
Please download new version from: https://github.com/vlytsus/arduinosensor/blob/master/arduino_sensor_main.ino
0 notes
Note
Hi, I'm the one who just asked about 3.3v power input for Arduino Nano problem. I just registered an account here. My name is Jasper. Thank you.
Hi, sorry for late response. It might work fine, but anyway you need to calibrate it for your voltage. Try to use this article: http://www.pocketmagic.net/sharp-gp2y1010-dust-sensor/
especially: adcVoltage = adcValue * (3.3 / 1024);
0 notes
Text
Arduino PM2.5 / PM10 Pollution Sensor based on Sharp Optical Dust Sensor GP2Y1010AU0F Part #6
I’ve performed some measurements of output signan to ILED and found that all Arduino programs that I’ve found on internet have incorrect sample timing.
Typical code is:
digitalWrite(PIN_LED, HIGH); // power on the LED
delayMicroseconds(280);
int analogData = analogRead(SENSOR_PIN);
delayMicroseconds(40);
digitalWrite(PIN_LED, LOW); // power off the LED
delayMicroseconds(9680);
280 + 40 + 9680 = 10000
Excelent according to sensor specification

But no one takes to consideration that analogRead is slow operation, that lasts for about 10 microseconds. Other operations also takes some time.
So, I’ve decided to check real pulse timings.
I’ve had Salae Logic usb digital osciloscope, that can measure impulse lenght, and I’ve performed several tests.

That code above gives following picture in analyzer program window:

Total period T = 10.28ms
ILED light time = 0.4391ms instead 0.32
As you see it is more than expected. If we calculate how much takes analogRead = 10280 - 10000 = 280 microseconds.
So I’ve decided to remove 40 microseconds delay befor switch-off
digitalWrite(PIN_LED, HIGH); // power on the LED
delayMicroseconds(280);
int analogData = analogRead(SENSOR_PIN);
delayMicroseconds(40);
digitalWrite(PIN_LED, LOW); // power off the LED
delayMicroseconds(9680);

New walues are slightly better
Total period T = 10.19ms
ILED light time = 0.398 ms instead 0.32
Finaly, to calculate how much time is needed to switch-on/off ILED I’ve calculated following code:
digitalWrite(PIN_LED, LOW); // power off the LED
digitalWrite(PIN_LED, HIGH); // power on the LED
digitalWrite(PIN_LED, LW); // power off the LED

So, each operation takes 0.05ms
After all I’ve decreased samples sleep delay time to 9500 to have period time close to 10ms.
https://github.com/vlytsus/arduinosensor
0 notes
Text
Arduino PM2.5 / PM10 Pollution Sensor based on Sharp Optical Dust Sensor GP2Y1010AU0F Part #5
I’ve decided to add LCD dispaly to the project to show calculated value. In this case dust sensor will be autonomous. I've used 16x2 LCD display HD44780. To handle display printing I've used LiquidCrystal library. By default enabled only serial printing: #define SERIAL_PRINT true. If you would like to enable LCD printing please set #define LCD_PRINT true.
Since I've got a lot of noise during measurements, I decided to filter it out from final results. It is performed by calculating median over 5 samples, and from that value is removed maximum & minimum results (avgDust - maxDust - minDust) / (SAMPLES_PER_COMP - 2). But this is not the end. To display data more smoothly I've added one more filter - stack[100] to store already filtered data and calculate median once more, over 100 samples.
I still was not happy with result's that I've achieved. My sensor was able to show hazardous concentrations of dust, but calculated dust veight values ug/m3 was far from data that I've got from official sensors, published in internet. I've found very usefull article about similar project, performed by Matthias Budde, Mathias Busse, and Michael Beigl from Karlsruhe Institute of Technology http://www.teco.edu/~budde/publications/MUM2013_budde.pdf
I was on the right direction. Now I need to perform additional calibration and include ambient temperature to calculations.
I've fixed several bugs and improved dust calculation formulas. All code sources and last chnages please check at: https://github.com/vlytsus/arduinosensor
/* *************************************************************** * ************* GP2Y1010AU0F Scharp Dust Sensor ***************** * *************************************************************** * Dust sensor calculates dust density based on reflected * infrared light from IR diode. Light brightness coresponds * to amount of dust in the air. Following program is responsible * to light-up IR diode, perform dust sampling and swith-off diode, * according to GP2Y1010AU0F specification. * Arduino program performs sequence of several measurements, * filters input data by mid point calulation based on several * measurements, to avoid voltage spikes. Then it performs dust * values transformation to ug/m2. Finaly calculated data could * be printed to Arduino serial output or to LCD display. * *************************************************************** * AQI Index could be calculated as * -------------------------------- * PM2.5 ug | AQI | Pollution * =========|=========|============ * 0-35 | 0-50 | Excelent * ---------|---------|------------ * 35-75 | 51-100 | Average * ---------|---------|------------ * 75-115 | 101-150 | Light * ---------|---------|------------ * 115-150 | 151-200 | Modrate * ---------|---------|------------ * 150-250 | 201-300 | Heavy * ---------|---------|------------ * 250-500 | > 300 | Serious * ---------|---------|------------ */ #include <LiquidCrystal.h> #include <stdlib.h> // initialize the library with the numbers of the interface pins LiquidCrystal lcd(12, 11, 5, 4, 3, 2); #define ADC_BASE_V 1100.0 //5000 //mv 4500 - real USB voltage #define MICROGR_2_MLVOLT_RATIO 0.2 //ug/m3 / mv #define ADC_RESOLUTION 1023.0 #define PIN_LED 7 #define PIN_ANALOG_OUT 0 #define POWER_ON_LED_DELAY 280 //#define POWER_ON_LED_SLEEP 40 // not used, digital read takes about 100 microseconds #define POWER_OFF_LED_DELAY 9500 #define SENSOR_PIN 0 #define DISPLAY_REFRESH_INTERVAL 30 #define SAMPLES_PER_COMP 5 #define STACK_SIZE 100 #define MAX_UNSIGNED_INT 65535 #define LCD_PRINT true #define SERIAL_PRINT true #define RAW_OUTPUT_MODE false // if true then raw analog data 0-1023 will be printed // Additional correction after calibration // to calculate dust as ug/m3 // by minimum & maximum values. // According to specification: min=600mv; max=3600mv // using linear function: y = a*x + b; // here x is voltage = ADC_val * V_adc_base / ADC_resolution #define A_CORRECTION 2.36 #define B_CORRECTION -76 float a_correction = A_CORRECTION * (ADC_BASE_V / ADC_RESOLUTION); unsigned int stack[STACK_SIZE+1];// stack is used to calculate middle value for display output unsigned int stackIter; // current stack iteration unsigned int refresh; // current display counter, used to not print data too frequently char str_temp[6]; void setup() { if(LCD_PRINT){ // set up the LCD's number of columns and rows: lcd.begin(16, 2); // Print a message to the LCD. lcd.print("-=Dust+Sensor=-"); } if(ADC_BASE_V < 4000) analogReference(INTERNAL); pinMode(PIN_LED, OUTPUT); pinMode(PIN_ANALOG_OUT, INPUT); digitalWrite(PIN_LED, LOW); stackIter = 0; refresh = 0; for(int i = 0; i < STACK_SIZE ; i++){ stack[i] = 0; } if(SERIAL_PRINT) Serial.begin(9600); } void loop(void){ if(stackIter >= STACK_SIZE) stackIter = 0; stack[stackIter] = computeSensorSequence(); if(refresh < DISPLAY_REFRESH_INTERVAL){ refresh++; }else{ refresh = 0; //calculate midpoint value and print int yResult = a_correction * calculateStackMidVal() + B_CORRECTION; if(yResult > 0){ print(yResult); } } stackIter++; } unsigned int computeSensorSequence(){ //perform several measurements and store to stack //for later midpoint calculations unsigned int maxDust = 0; unsigned int minDust = MAX_UNSIGNED_INT; unsigned long avgDust = 0; unsigned int dustVal = 0; //perform several sensor reads and calculate midpoint for(int i = 0; i< SAMPLES_PER_COMP; i++){ dustVal = readRawSensorData(); if (dustVal > 0){ //find max dust per sample if(dustVal > maxDust) maxDust = dustVal; //find min dust per sample if(dustVal < minDust) minDust = dustVal; avgDust += dustVal; } } //filter input data //don't take to consideration max & min values per sample //and save average to stack return (avgDust - maxDust - minDust) / (SAMPLES_PER_COMP - 2); } unsigned int calculateStackMidVal(){ int midVal = 0; for(int i = 0; i < STACK_SIZE ; i++){ midVal += stack[i]; } return midVal / STACK_SIZE; } unsigned int readRawSensorData(){ unsigned int analogData; //ADC value 0-1023 digitalWrite(PIN_LED, HIGH); // power on the LED delayMicroseconds(POWER_ON_LED_DELAY); analogData = analogRead(SENSOR_PIN); //delayMicroseconds(POWER_ON_LED_SLEEP);//not used, digital read takes about 100 microseconds digitalWrite(PIN_LED, LOW); // power off the LED delayMicroseconds(POWER_OFF_LED_DELAY);//9500 return analogData; } void print(int val){ print(String(val)); } void print(String msg){ if(SERIAL_PRINT) Serial.println(msg); if(LCD_PRINT){ lcd.setCursor(0, 1); lcd.print(msg); } }
0 notes