
Brian Hill is a consulting professional with over 20 years of experience on Oracle database, development, and cloud technologies. Currently focused on APEX and performance tuning with Oracle Exadata.
Don't wanna be here? Send us removal request.
Statistics
We looked inside some of the posts by brian-hill and here's what we found interesting.
Average Info
Notes Per Post
2
Likes Per Post
1
Reblog Per Post
1
Reply Per Post
0
Time Between Posts
11 months
Number of Posts By Type
Text
8
Last Seen Tumblr Blogs


Fun Fact
Tumblr was named as a finalist in Lead411’s New York City Hot 125 in Aug 2010.
Text
DBRM and its effect on I/O on Exadata
A client expressed concern that limiting a user via DBRM might still let that user consume lots of I/O, especially if they got a smart scan. I decided to test this in our lab with a couple of queries. The first query is very simple:
SELECT /*+ FULL(b) OPT_PARAM('_kcfis_storageidx_disabled', 'TRUE') */ COUNT(*) FROM big_table b;
The optimizer hints are to make sure it gets a smart scan without using a storage index (storage index would prevent I/O). I disabled any DBRM and IORM plans then ran the query - it ran for 14.6 seconds. Then, I enabled a DBRM plan where my user was limited to 5% of the CPU and ran the query again. It ran in the same amount of time - 14.6 seconds. So the DBRM didn't affect the execution time, but let's see what it did with regards to I/O. Here's a query that I can use to see I/O Utilization on the storage cells for the past 60 minutes:
SELECT DISTINCT cell_name, begin_time, end_time, metric_name, metric_value FROM gv$cell_global_history WHERE metric_name = 'Utilization' ORDER BY begin_time, cell_name;
And here's the output from it relating to those 2 query executions:
Cell Name Begin Time End Time Metric Name Value 192.168.10.9 2017/12/22 08:56:14 2017/12/22 08:57:14 Utilization 0 192.168.10.7 2017/12/22 08:56:42 2017/12/22 08:57:42 Utilization 3 192.168.10.5 2017/12/22 08:56:46 2017/12/22 08:57:46 Utilization 6 192.168.10.9 2017/12/22 08:57:14 2017/12/22 08:58:14 Utilization 15 192.168.10.7 2017/12/22 08:57:42 2017/12/22 08:58:42 Utilization 12 192.168.10.5 2017/12/22 08:57:46 2017/12/22 08:58:46 Utilization 9 192.168.10.9 2017/12/22 08:58:14 2017/12/22 08:59:14 Utilization 0 ... 192.168.10.9 2017/12/22 09:02:14 2017/12/22 09:03:14 Utilization 0 192.168.10.7 2017/12/22 09:02:42 2017/12/22 09:03:42 Utilization 12 192.168.10.5 2017/12/22 09:02:46 2017/12/22 09:03:46 Utilization 15 192.168.10.9 2017/12/22 09:03:14 2017/12/22 09:04:14 Utilization 15 192.168.10.7 2017/12/22 09:03:42 2017/12/22 09:04:42 Utilization 3 192.168.10.5 2017/12/22 09:03:46 2017/12/22 09:04:46 Utilization 0
The output is shown by storage cell. The "Value" column shows the I/O Utilization % (percentage of the I/O capacity of the storage cells). The values are very similar between the two executions, suggesting the DBRM had no effect on the storage cells. Any difference between the two is likely due to the timing of when I executed the query vs when IORM collected its metrics. Nothing surprising here so far - we just executed a query that did a lot of work on the storage cells to get the total COUNT of rows in 1 table and then return that value to the DB server.
BUT, what if we give the DB server more work to do?
I modified the original query to make it do a join, which has to be performed on the DB server (i.e. compute node). I just added an inline view with 4 rows that will be cartesian-joined to the table:
SELECT /*+ FULL(b) OPT_PARAM('_kcfis_storageidx_disabled', 'TRUE') */ COUNT(*) FROM big_table b, (SELECT 1 FROM dba_tables WHERE ROWNUM <= 4);
The query does get an Exadata Smart Scan, doing most of the work on the storage cells. With no IORM or DBRM plans in place, it took 288 seconds to execute. I then enabled a DBRM plan (still no IORM plan) that limited my user to 5% of DB CPU, and then ran the query again. This time, it took 405 seconds. Obviously, the DBRM plan had some effect. And here's what the I/O looked like:
Cell Name Begin Time End Time Metric Name Value 192.168.10.9 2017/12/21 14:57:36 2017/12/21 14:58:36 Utilization 0 192.168.10.7 2017/12/21 14:58:06 2017/12/21 14:59:06 Utilization 4 192.168.10.5 2017/12/21 14:58:10 2017/12/21 14:59:10 Utilization 5 192.168.10.9 2017/12/21 14:58:36 2017/12/21 14:59:36 Utilization 12 192.168.10.7 2017/12/21 14:59:06 2017/12/21 15:00:06 Utilization 0 ... 192.168.10.5 2017/12/21 15:04:10 2017/12/21 15:05:10 Utilization 0 192.168.10.9 2017/12/21 15:04:36 2017/12/21 15:05:36 Utilization 1 192.168.10.7 2017/12/21 15:05:06 2017/12/21 15:06:06 Utilization 4 192.168.10.5 2017/12/21 15:05:10 2017/12/21 15:06:10 Utilization 5 192.168.10.9 2017/12/21 15:05:36 2017/12/21 15:06:36 Utilization 7 192.168.10.7 2017/12/21 15:06:06 2017/12/21 15:07:06 Utilization 6 192.168.10.5 2017/12/21 15:06:10 2017/12/21 15:07:10 Utilization 6 192.168.10.9 2017/12/21 15:06:36 2017/12/21 15:07:36 Utilization 5 192.168.10.7 2017/12/21 15:07:06 2017/12/21 15:08:06 Utilization 2 192.168.10.5 2017/12/21 15:07:10 2017/12/21 15:08:10 Utilization 2 192.168.10.9 2017/12/21 15:07:36 2017/12/21 15:08:36 Utilization 0
The first execution peaked at 12% I/O Utilization and the 2nd execution peaked at 7%. The I/O Utilization wasn't capped to 5% (there's no IORM plan after all), but we can see that I/O Utilization did not climb to the same values as without a DBRM plan. And, clearly, the 2nd execution used I/O for a longer duration than the first. The DBRM limit on CPU on the DB Server limited the pace at which it could consume I/O from the storage cells, thus reducing the peak I/O utilization, but spreading it over a longer period of time.
In conclusion, I would say that in many cases, DBRM limits on users will also have an effect on the amount of I/O the users can consume. My first example is a case where DBRM didn't impact I/O, but I think you'll find that most of your queries involve joins, or functions that require work to be done on the compute nodes, where DBRM will have an impact.
0 notes
Text
Solved - JasperReportsIntegration unable to connect to 19.2 Database
We recently migrated an APEX environment to the “Always Free” Oracle cloud. On our web server VM, we use Tomcat 9.0 to run ORDS and the JasperReportsIntegration utility (version 2.4), which uses JDBC to connect to our DB. After checking the JDBC connect string and authentication info, and being certain it was correct, we were still getting this error when trying to run a Jasper report:
java.sql.SQLException: ORA-01017: invalid username/password; logon denied
The problem turned out to be an old OJDBC Jar file that comes with JRI. It includes ojdbc6.jar. Replaced that with a recently-downloaded ojdbc8.jar, restarted Tomcat, and voila! It works!
0 notes
Text
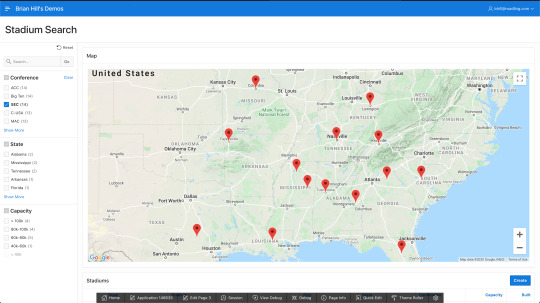
Oracle APEX: Making Google Maps respond to Faceted Search
“One of my work projects elicited the need to have a map that responded to changing search criteria. I thought it would be a great opportunity to mix APEX’s new Faceted Search feature with Google Maps. I’ll try to walk you through how I accomplished it. [Disclaimer: you’ll need an API Key from Google in order to render the maps.]
The APEX Faceted Search feature was introduced with version 19.2. Out-of-the-box, you can have a region for your search criteria (i.e. facets) and another region, a report, that refreshes automatically to reflect the new search filters. Carsten Czarski wrote a blog post showing how you can have multiple regions (charts, reports, etc.) react to changes to the faceted search. I used his approach, with some tweaks, in combination with the Google Maps JavaScript APIs.
The simplified (silly) use-case here is a list of NCAA (FBS) college football stadiums. With the faceted search, you can filter a report region by conference, state, and seating capacity. There is also a Google Map with a marker for each matching stadium. You can try it out here:
https://apex.oracle.com/pls/apex/bhill_roadling/r/blog3/blog-stadiums-search
I am limiting the number of times the Google Map can be rendered because there is a cost associated with it. Here are some screen shots in case we’ve hit our quota or the page doesn’t work for some other reason:

First, you’ll need a data set - I got mine from here. I loaded it into a table called BLOG_STADIUMS, which is defined as:
CREATE TABLE "BLOG_STADIUMS" ( "ID" NUMBER GENERATED ALWAYS AS IDENTITY MINVALUE 1 MAXVALUE 9999999999999999999999999999 INCREMENT BY 1 START WITH 1 CACHE 20 NOORDER NOCYCLE NOKEEP NOSCALE NOT NULL ENABLE, "STADIUM" VARCHAR2(255), "CITY" VARCHAR2(50), "STATE" VARCHAR2(50), "TEAM" VARCHAR2(255), "CONFERENCE" VARCHAR2(50), "BUILT" NUMBER, "DIV" VARCHAR2(50), "LATITUDE" NUMBER, "LONGITUDE" NUMBER, "CAPACITY" NUMBER, "EXPANDED" NUMBER, PRIMARY KEY ("ID") USING INDEX ENABLE ) /
Then I created a new APEX app which automatically built the Faceted Search page. For more info on how to build one from scratch, see this post by Carsten Czarski. I tweaked the facets a bit to match the screen shots above. At this point, I have everything but the Google Map, and it was very easy to get this far.
Here’s the outline for getting the filtered data into Google Maps:
Retrieve the filtered data set
Format it with JSON
Use an an Ajax Callback process to retrieve the JSON data
Use JavaScript to parse the JSON and call the Google APIs to render the map
Use a Dynamic Action to refresh the map when the facets change
Retrieve the Filtered Data Set:
Per Carsten’s blog post (the one I referenced first), we create a new type in the database for a single row of the result set:
CREATE OR REPLACE EDITIONABLE TYPE "TYP_STADIUM_ROW" as object (id NUMBER, stadium VARCHAR2(255), city VARCHAR2(50), state VARCHAR2(50), team VARCHAR2(255), conference VARCHAR2(50), built NUMBER, div VARCHAR2(50), latitude NUMBER, longitude NUMBER, capacity NUMBER, expanded NUMBER ) /
Then we create another new type as a table of that object:
CREATE OR REPLACE EDITIONABLE TYPE "TYP_STADIUM_TABLE" as table of typ_stadium_row /
Then we create a pipelined function to get the filtered result set from our search results report region:
create or replace FUNCTION fn_get_stadium_search_data(p_page_id IN NUMBER, p_region_static_id IN VARCHAR2) RETURN typ_stadium_table PIPELINED IS l_region_id NUMBER; l_context apex_exec.t_context; TYPE t_col_index IS TABLE OF PLS_INTEGER INDEX BY VARCHAR2(255); l_col_index t_col_index; --------------------------------------------------------------------------- PROCEDURE get_column_indexes(p_columns wwv_flow_t_varchar2 ) IS BEGIN FOR i IN 1 .. p_columns.COUNT LOOP l_col_index(p_columns(i)) := apex_exec.get_column_position(p_context => l_context, p_column_name => p_columns(i)); END LOOP; END get_column_indexes; --------------------------------------------------------------------------- BEGIN -- 1. get the region ID of the Faceted Search region SELECT region_id INTO l_region_id FROM apex_application_page_regions WHERE application_id = v('APP_ID') AND page_id = p_page_id AND static_id = p_region_static_id; -- 2. Get a cursor (apex_exec.t_context) for the current region data l_context := apex_region.open_query_context(p_page_id => p_page_id, p_region_id => l_region_id ); get_column_indexes(wwv_flow_t_varchar2('ID', 'STADIUM', 'CITY', 'STATE', 'TEAM', 'CONFERENCE', 'BUILT', 'DIV', 'LATITUDE', 'LONGITUDE', 'CAPACITY', 'EXPANDED')); WHILE apex_exec.next_row(p_context => l_context) LOOP PIPE ROW(typ_stadium_row(apex_exec.get_number (p_context => l_context, p_column_idx => l_col_index('ID' )), apex_exec.get_varchar2(p_context => l_context, p_column_idx => l_col_index('STADIUM' )), apex_exec.get_varchar2(p_context => l_context, p_column_idx => l_col_index('CITY' )), apex_exec.get_varchar2(p_context => l_context, p_column_idx => l_col_index('STATE' )), apex_exec.get_varchar2(p_context => l_context, p_column_idx => l_col_index('TEAM' )), apex_exec.get_varchar2(p_context => l_context, p_column_idx => l_col_index('CONFERENCE')), apex_exec.get_number (p_context => l_context, p_column_idx => l_col_index('BUILT' )), apex_exec.get_varchar2(p_context => l_context, p_column_idx => l_col_index('DIV' )), apex_exec.get_number (p_context => l_context, p_column_idx => l_col_index('LATITUDE' )), apex_exec.get_number (p_context => l_context, p_column_idx => l_col_index('LONGITUDE' )), apex_exec.get_number (p_context => l_context, p_column_idx => l_col_index('CAPACITY' )), apex_exec.get_number (p_context => l_context, p_column_idx => l_col_index('EXPANDED' )) ) ); END LOOP; apex_exec.close(l_context); RETURN; EXCEPTION WHEN NO_DATA_FOUND THEN apex_exec.close(l_context); RETURN; WHEN OTHERS THEN apex_exec.close( l_context ); RAISE; END fn_get_stadium_search_data; /
The function has 2 parameters: 1 for the APEX page number and 1 for the region’s static ID. My faceted search is page 3, and I set the static ID of my search results region to “searchResults”. The function uses APEX_REGION and APEX_EXEC to get the individual values from the report region, then assembles them into a collection of the type we built above.
At this point, we could create a new chart region in our APEX page that queries this pipelined function instead of our BLOG_STADIUMS table. A query would look something like this:
SELECT id, stadium, city, state, team, conference, built, div, latitude, longitude, capacity, expanded FROM table(fn_get_stadium_search_data('3', 'searchResults'))
Format it with JSON:
In order to use the data with Google Maps, we need to format it with JSON. Something like this will work:
{"map_boundaries": {"center_latitude": 30.61009758, "center_longitude": -96.34072923, "east_longitude": -96.34072923, "north_latitude": 30.61009758, "south_latitude": 30.61009758, "west_longitude": -96.34072923 }, "stadium_data": [{"built": "1927", "capacity": "102,733", "city": "College Station", "color": null, "conference": "SEC", "div": "fbs", "expanded": "2015", "id": "00004", "latitude": 30.61009758, "longitude": -96.34072923, "stadium": "Kyle Field", "state": "Texas", "team": "Texas A&M" }, {"built": "1924", "capacity": "100,119", "city": "Austin", "color": null, "conference": "Big 12", "div": "fbs", "expanded": "2009", "id": "00008", "latitude": 30.2836034, "longitude": -97.73233652, "stadium": "Darrell K Royal–Texas Memorial Stadium", "state": "Texas", "team": "Texas" } ] }
Notice that the JSON contains “map_boundaries” data. We’ll use that data to (1) determine where to center the map, and (2) calculate a zoom level.
Here’s the code for a function that will build that:
create or replace FUNCTION fn_get_stadium_data_json RETURN CLOB IS l_json_data CLOB; CURSOR c_stadiums IS WITH stadiums_cte AS (SELECT id, stadium, city, state, team, conference, built, div, latitude, longitude, capacity, expanded FROM table(fn_get_stadium_search_data('3', 'searchResults')) ) SELECT JSON_OBJECT('map_boundaries' VALUE (SELECT JSON_OBJECT('west_longitude' VALUE min_lon, 'east_longitude' VALUE max_lon, 'south_latitude' VALUE min_lat, 'north_latitude' VALUE max_lat, 'center_latitude' VALUE NVL((min_lat + max_lat) / 2, 39.8333), 'center_longitude' VALUE NVL((min_lon + max_lon) / 2, -98.5833) RETURNING CLOB) FROM (SELECT LEAST( MIN(latitude), 90) AS min_lat, LEAST( MIN(longitude), 180) AS min_lon, GREATEST(MAX(latitude), 0) AS max_lat, GREATEST(MAX(longitude), -180) AS max_lon FROM stadiums_cte ) ), 'stadium_data' VALUE (SELECT JSON_ARRAYAGG(JSON_OBJECT('id' VALUE TO_CHAR(id, 'FM00000'), 'stadium' VALUE stadium, 'city' VALUE city, 'state' VALUE state, 'team' VALUE team, 'conference' VALUE conference, 'built' VALUE TO_CHAR(built, 'FM0000'), 'div' VALUE div, 'latitude' VALUE latitude, 'longitude' VALUE longitude, 'capacity' VALUE TO_CHAR(capacity, 'FM999G990'), 'expanded' VALUE TO_CHAR(expanded, 'FM9990'), 'color' VALUE CAST(NULL AS VARCHAR2(12)) RETURNING CLOB) RETURNING CLOB) FROM stadiums_cte ) RETURNING CLOB) AS json_stadium_data FROM dual; BEGIN --============================================================================================================================ -- Get all of the stadium data and put it in a PL/SQL collection. --============================================================================================================================ OPEN c_stadiums; FETCH c_stadiums INTO l_json_data; CLOSE c_stadiums; RETURN(l_json_data); END fn_get_stadium_data_json; /
Notice that it calls the other function we built. I’m sure the SQL could be simpler, but it works.
Ajax Callback Process to Retrieve JSON:
On page 3 of my APEX app, I created an Ajax Callback process with these properties:

The name is “refreshMap” and it wraps our previous function with “htp.p”.
Use JS to Parse the JSON and Call the Google Map APIs:
Now that we have the data formatted with JSON, and we have a way to retrieve it via JS, we just need to do that and use the APIs to render the Google Map. We’ll declare a JS function called “initMap” that will use the APEX JS API “apex.server.process” to execute the Ajax Callback Process we created above. When the callback is successful, we’ll execute some JS to calculate an appropriate zoom level for the map, and then we’ll call google.maps.Map to render it. Finally, we’ll loop through the JSON data and create a marker for each stadium. I added some code to display a little info window when the mouse hovers over a marker. [The info window works pretty well on Safari, but seems real twitchy in Chrome. I’ll post any fixes I come up with.]
Here’s the code for the “Function and Global Variable Declaration” page property:
function initMap() { apex.server.process('refreshMap', // Process or AJAX Callback name {}, // No page items to pass/set {success: function (pData) {// Success Javascript var data = pData; //.substring(1, pData.length - 3); var json_data = JSON.parse(data); var GLOBE_WIDTH = 256; // a constant in Google's map projection // Calculate Zoom level based upon longitudes var pixelWidth = $("#map").width(); var west = json_data.map_boundaries.west_longitude; var east = json_data.map_boundaries.east_longitude; var angle1 = east - west; if (angle1 < 0) {angle1 += 360;} var zoom1 = Math.floor(Math.log(pixelWidth * 360 / angle1 / GLOBE_WIDTH) / Math.LN2); // Calculate Zoom level based upon latitudes var pixelHeight = $("#map").height(); var south = json_data.map_boundaries.south_latitude; var north = json_data.map_boundaries.north_latitude; var angle2 = north - south + 3; var zoom2 = Math.floor(Math.log(pixelHeight * 360 / angle2 / GLOBE_WIDTH) / Math.LN2); // Choose the lower of the 2 Zoom levels var zoom = Math.min(zoom1, zoom2); // If the zoom is calculated to infinity, then set it to 4. This will occur when no stadiums are found. if (zoom === Infinity) {zoom = 4;} var map = new google.maps.Map(document.getElementById('map'), { zoom: zoom, center: {lat: json_data.map_boundaries.center_latitude, lng: json_data.map_boundaries.center_longitude }, mapTypeId: 'terrain', mapTypeControl: false, streetViewControl: false } ); var myLatLng; var marker; var infoWindow = new google.maps.InfoWindow(); $.each(json_data.stadium_data, function(index, element) { myLatLng = {lat: element.latitude, lng: element.longitude}; marker = new google.maps.Marker( {position: myLatLng, map: map, title: element.stadium }); // Open the InfoWindow on mouseover: google.maps.event.addListener(marker, 'mouseover', function(e) { infoWindow.setPosition(e.latLng); infoWindow.setContent("<table class=\"infoContent\"><tr>" + "<td class=\"infoContentLabel\">Team: </td>" + "<td class=\"infoContentData\">" + element.team + "</td>" + "</tr><tr>" + "<td class=\"infoContentLabel\">Stadium: </td>" + "<td class=\"infoContentData\">" + element.stadium + "</td>"+ "</tr><tr>"+ "<td class=\"infoContentLabel\">Location: </td>"+ "<td class=\"infoContentData\">" + element.city + ", " + element.state + "</td>" + "</tr><tr>"+ "<td class=\"infoContentLabel\">Capacity: </td>"+ "<td class=\"infoContentData\">" + element.capacity + "</td>" + "</tr><tr>"+ "<td class=\"infoContentLabel\">Built: </td>"+ "<td class=\"infoContentData\">" + element.built + "</td>" + "</tr></table>"); infoWindow.open(map); }); // Close the InfoWindow on mouseout: google.maps.event.addListener(marker, 'mouseout', function() { infoWindow.close(); }); }); }, dataType: "text" // Response type (here: plain text) } ); }
Now we need to load the Google Maps API JS and provide them with an API key. To do this, we add this JS code to the “Execute When Page Loads” page property:
(function(d, script) { script = d.createElement('script'); script.type = 'text/javascript'; script.async = true; script.onload = function(){ // remote script has loaded }; script.src = 'https://maps.googleapis.com/maps/api/js?key=<yourKeyHere>&callback=initMap'; d.getElementsByTagName('body')[0].appendChild(script); }(document));
And finally, I added this to the “Inline” CSS page property:
/* Always set the map height explicitly to define the size of the div * element that contains the map. */ #map { height: 600px; } .infoContentLabel { font-weight: bold; }
Dynamic Action to Refresh the Map
The last step is to get the map to refresh dynamically when the facets change. Create a new Dynamic Action named “When Search Changes” that fires on the “After Refresh” event for the search results region (the name is “Stadiums”, the static ID is “searchResults”). It has one TRUE action - Execute JavaScript Code with the following code:
initMap(); //setTimeout(function(){ initMap(); }, 750);
Note: The “Facets Change” event seemed to cause a race condition between the map region and the search results region. Sometimes it would show the latest info, sometimes it wouldn’t. I was able to use a JS timeout of about .75 seconds to work-around that, but I found that just refreshing the map after the refresh of the search results worked better.
0 notes
Text
Determining the beginning of the Week - Utilizing the "IW" Date Format Model
On my current project, I need to find the beginning of the week for a specified date. Pretty easy right:
TRUNC(p_date, 'D')
One catch... the company is European-owned, and their weeks start on Monday, not Sunday. I could add 1 to the date to get Monday, but that doesn't work if my original date is a Sunday - the result will be off by one week.
I started down the path of coding some conditional logic and date arithmetic, but I stopped and figured there had to be a better way. Oracle provides the "IW" format model which represents the ISO Week (weeks beginning on Monday):
TRUNC(p_date, 'IW')
That gets me the value I need - the date of the Monday preceding my input date. Also, TO_CHAR(p_date, 'IW') will return the number of the ISO week, 1-53.
0 notes
Text
Undocumented Number Format Model: PT
A client has a requirement to show negative numbers in parentheses (standard finance/accounting format here). E.g. "($123,456.78)"
The Oracle 11.2 documentation shows a format model that includes "PR" to show negative numbers inside angle brackets. E.g. "<$123,456.78>"
My Oracle Support document #780782.1 states that I can use "PT" instead of "PR" to get the desired result.
Here's a simple query showing it in use:
SELECT -123456.78 AS num, TO_CHAR(-123456.78, 'L999G999G999D00PR') AS chr1, TO_CHAR(-123456.78, 'L999G999G999D00PT') AS chr2 FROM dual;
And here are the results:
NUM CHR1 CHR2 -123456.78 <$123,456.78> ($123,456.78)
This "PT" format model element also works in Apex.
2 notes
·
View notes
Text
Tweaking the Colors of a Calendar Region in Oracle Apex 4.2.3
A recent project required the use of a calendar region for some data input. It was easy enough to set up, but I wasn't happy with the colors and the lack of controls to change them.
The calendar region type provides the ability to change the background and foreground colors of dates that are within the date range of the calendar (i.e. between PXX_CALENDAR_DATE and PXX_CALENDAR_END_DATE). But, those colors only affect portion of the rectangle (really a <td> within a table) representing the date, not the entire rectangle. I also wanted to alter the colors of the current date, dates outside of the calendar range, and dates in the current month view that are not in the current month (e.g. when looking at February, I might see January 31st and March 1st - I can't seem to click on these dates to navigate to the entry form).
Using CSS and JavaScript (jQuery), I was able to achieve the desired results.
As an example, let's say the range of my calendar is February 4, 2014 through February 20, 2014. The calendar will show January 26, 2014 through March 1, 2014. The current date is Feb 6. For the sake of demonstrating the capabilities, let's say I want the following colors (I know they're ugly):
Jan 26-Jan 31, Mar 1: black, indicating that data cannot be entered
Feb 1-Feb 3, Feb 21-Feb 28: grey, indicating the dates are outside the range
Feb 4-Feb 20: light green, indicating the dates are in range
Feb 6: light yellow, indicating the current date
In the page containing the calendar region, I added the following JavaScript function to the page:
function adjustCalendarColors() { //Days not in the current month (ex: the current month is February, March 1st is a "NonDay" $("td[class='NonDay']").each(function() { $(this).css("background-color", "#000"); }); //Days and Weekend Days in the current month $("td[class='Day'], td[class='WeekendDay']").each(function() { $(this).css("background-color", "#eee"); }); //Days and Weekend Days between PXX_CALENDAR_DATE and PXX_CALENDAR_END_DATE $("td[class='Day'] div[class='apex_cal_data_grid_src'], td[class='WeekendDay'] div[class='apex_cal_data_grid_src']").each(function() { $(this).parent("td").css("background-color", "#A4EBA4"); }); //Today $("td[class='Today']").each(function() { $(this).css("background-color", "#ffc"); }); }
The first section will black-out dates that cannot be entered. The second section makes all other days grey. The third section changes dates in range to light green, and the fourth section makes the current date yellow.
To make these changes take effect, this function needs to be called on Page Load - add the function call to the "Execute When Page Loads" page property.
The last trick is to execute this function when the calendar region is refreshed (partial page refresh). Apex uses Ajax calls to refresh the region when using the "Previous", "Next", and "Today" buttons (among other things). Since it's Ajax, my new function needs to be executed after the callback. I added one additional piece of JavaScript to the end of the page's JavaScript "Function and Global Variable Declaration" property:
$(document).ajaxSuccess(function(event, xhr, settings) { adjustCalendarColors(); });
Looks like the Calendar Region has changed for 4.2.4 and thus the JavaScript would need to be adjusted.
0 notes
Text
Using OWA_UTIL.WHO_CALLED_ME
I found a cool PL/SQL built-in, OWA_UTIL.WHO_CALLED_ME, that returns the object type, owner, object name, and line number of a calling PL/SQL program unit from within another program unit. Looks like it was initially written by Tom Kyte and published on his blog before being adopted by Oracle. The documentation is here.
This was very useful in a recent project. There were hundreds of packages that called a common procedure to insert log/error messages into a table. With this built-in, I was able to better track an error's source without having to modify all of the calls to the common proc.
Here's a simple stored procedure that illustrates how to call it:
CREATE OR REPLACE PROCEDURE pr_whocalledme IS v_owner VARCHAR2(100); v_name VARCHAR2(100); v_lineno NUMBER; v_caller_t VARCHAR2(100); BEGIN OWA_UTIL.WHO_CALLED_ME(v_owner, v_name, v_lineno, v_caller_t); DBMS_OUTPUT.PUT_LINE(CHR(10) || 'OWA.WHO_CALLED_ME:'); DBMS_OUTPUT.PUT_LINE(' Owner: ' || v_owner); DBMS_OUTPUT.PUT_LINE(' Name: ' || v_name); DBMS_OUTPUT.PUT_LINE(' Line#: ' || TO_CHAR(v_lineno)); DBMS_OUTPUT.PUT_LINE(' Type: ' || v_caller_t); END;
If I call that from another stored proc (inside a package), I will see output like this:
OWA.WHO_CALLED_ME: Owner: MYSCHEMA Name: PKG_TEST Line#: 31 Type: PACKAGE BODY
0 notes
Text
Get More Detailed Error Info via FORMAT_ERROR_BACKTRACE
On a recent project, I was debugging a multi-step batch job that was executed via a custom scheduler. One of the steps was throwing an error, but the message in the error log table wasn't enough to locate the cause of the problem. I needed a way to find the line number of the package on which the error was occurring. SQLERRM was only providing the error number and text, but not the line number. A little searching of the PL/SQL Packages and Types Reference turned up "DBMS_UTILITY.FORMAT_ERROR_BACKTRACE". Adding this to the error logging in the package made it much easier to find the line number of the root cause of my problem.
Here's an example I put together to show the difference between SQLERRM, DBMS_UTILITY.FORMAT_ERROR_STACK, and DBMS_UTILITY.FORMAT_ERROR_BACKTRACE. The package has several nested subroutines, the inner-most of which throws an error (putting a 3-digit number into a 2-digit numeric variable).
Package spec:
create or replace PACKAGE pkg_errm AS PROCEDURE pr_main; END pkg_errm;
Package body:
create or replace PACKAGE BODY pkg_errm AS n NUMBER(2); PROCEDURE pr_sub3 IS BEGIN n := 123; END pr_sub3; PROCEDURE pr_sub2 IS BEGIN pr_sub3; END pr_sub2; PROCEDURE pr_sub1 IS BEGIN pr_sub2; END pr_sub1; PROCEDURE pr_main IS BEGIN pr_sub1; EXCEPTION WHEN OTHERS THEN DBMS_OUTPUT.PUT_LINE('SQLERRM:' || CHR(10) || SQLERRM); DBMS_OUTPUT.PUT_LINE(CHR(10) || 'DBMS_UTILITY.FORMAT_ERROR_STACK:' || CHR(10) || DBMS_UTILITY.FORMAT_ERROR_STACK); DBMS_OUTPUT.PUT_LINE(CHR(10) || 'DBMS_UTILITY.FORMAT_ERROR_BACKTRACE:' || CHR(10) || DBMS_UTILITY.FORMAT_ERROR_BACKTRACE); RAISE; END pr_main; END pkg_errm;
And here's a screen shot of what you see when you execute the "pr_main" routine in SQL Developer:

You can see that SQLERRM and DBMS_UTILITY.FORMAT_ERROR_STACK both show the ORA-06502 error and message, while DBMS_UTILITY.FORMAT_ERROR_BACKTRACE shows the line numbers (inner-most on top). Line 7 of the package body is indeed where I attempt to assign the value to my number variable.
(Side note: the line numbers are accurate if "create or replace PACKAGE BODY pkg_errm AS" appears all on one line in the package body. If "PACKAGE BODY pkg_errm AS" gets moved to the second line, as often happens when compiling packages in SQL Developer, then the line numbers will be off by 1.)
My solution was to use a combination of SQLERRM and DBMS_UTILITY.FORMAT_ERROR_BACKTRACE to log the errors.
0 notes