Don't wanna be here? Send us removal request.
Statistics
We looked inside some of the posts by naivelocus and here's what we found interesting.
Average Info
Notes Per Post
0
Likes Per Post
0
Reblog Per Post
0
Reply Per Post
0
Time Between Posts
2 hours
Number of Posts By Type
Text
17
Last Seen Tumblr Blogs


Fun Fact
Hackers stole 65M passwords from Tumblr in 2013.
Text
Low-Depth Optical Neural Networks. (arXiv:1904.02165v1 [physics.optics])
Optical neural network (ONN) is emerging as an attractive proposal for machine-learning applications, enabling high-speed computation with low-energy consumption. However, there are several challenges in applying ONN for industrial applications, including the realization of activation functions and maintaining stability. In particular, the stability of ONNs decrease with the circuit depth, limiting the scalability of the ONNs for practical uses. Here we demonstrate how to compress the circuit depth of ONN to scale only logarithmically, leading to an exponential gain in terms of noise robustness. Our low-depth (LD) ONN is based on an architecture, called Optical CompuTing Of dot-Product UnitS (OCTOPUS), which can also be applied individually as a linear perceptron for solving classification problems. Using the standard data set of Letter Recognition, we present numerical evidence showing that LD-ONN can exhibit a significant gain in noise robustness, compared with a previous ONN proposal based on singular-value decomposition [Nature Photonics 11, 441 (2017)].
— cs.LG updates on arXiv.org
#cs.LG updates on arXiv.org#Low-Depth Optical Neural Networks. (arXiv:1904.02165v1 [physics.optics])
0 notes
Text
Resource Efficient 3D Convolutional Neural Networks. (arXiv:1904.02422v1 [cs.CV])
Recently, convolutional neural networks with 3D kernels (3D CNNs) have been very popular in computer vision community as a result of their superior ability of extracting spatio-temporal features within video frames compared to 2D CNNs. Although, there has been great advances recently to build resource efficient 2D CNN architectures considering memory and power budget, there is hardly any similar resource efficient architectures for 3D CNNs. In this paper, we have converted various well-known resource efficient 2D CNNs to 3D CNNs and evaluated their performance on three major benchmarks in terms of classification accuracy for different complexity levels. We have experimented on (1) Kinetics-600 dataset to inspect their capacity to learn, (2) Jester dataset to inspect their ability to capture hand motion patterns, and (3) UCF-101 to inspect the applicability of transfer learning. We have evaluated the run-time performance of each model on a single GPU and an embedded GPU. The results of this study show that these models can be utilized for different types of real-world applications since they provide real-time performance with considerable accuracies and memory usage. Our analysis on different complexity levels shows that the resource efficient 3D CNNs should not be designed too shallow or narrow in order to save complexity. The codes and pretrained models used in this work are publicly available.
— cs.CV updates on arXiv.org
#cs.CV updates on arXiv.org#Resource Efficient 3D Convolutional Neural Networks. (arXiv:1904.02422v1
0 notes
Text
A Learned Representation for Scalable Vector Graphics. (arXiv:1904.02632v1 [cs.CV])
Dramatic advances in generative models have resulted in near photographic quality for artificially rendered faces, animals and other objects in the natural world. In spite of such advances, a higher level understanding of vision and imagery does not arise from exhaustively modeling an object, but instead identifying higher-level attributes that best summarize the aspects of an object. In this work we attempt to model the drawing process of fonts by building sequential generative models of vector graphics. This model has the benefit of providing a scale-invariant representation for imagery whose latent representation may be systematically manipulated and exploited to perform style propagation. We demonstrate these results on a large dataset of fonts and highlight how such a model captures the statistical dependencies and richness of this dataset. We envision that our model can find use as a tool for graphic designers to facilitate font design.
— stat updates on arXiv.org
#stat updates on arXiv.org#A Learned Representation for Scalable Vector Graphics. (arXiv:1904.02632v
0 notes
Text
SMURFF: a High-Performance Framework for Matrix Factorization. (arXiv:1904.02514v1 [cs.LG])
Bayesian Matrix Factorization (BMF) is a powerful technique for recommender systems because it produces good results and is relatively robust against overfitting. Yet BMF is more computationally intensive and thus more challenging to implement for large datasets. In this work we present SMURFF a high-performance feature-rich framework to compose and construct different Bayesian matrix-factorization methods. The framework has been successfully used in to do large scale runs of compound-activity prediction. SMURFF is available as open-source and can be used both on a supercomputer and on a desktop or laptop machine. Documentation and several examples are provided as Jupyter notebooks using SMURFF's high-level Python API.
— stat updates on arXiv.org
#stat updates on arXiv.org#SMURFF: a High-Performance Framework for Matrix Factorization. (arXiv:190
0 notes
Text
Cross-Validation for Correlated Data. (arXiv:1904.02438v1 [stat.ME])
K-fold cross-validation (CV) with squared error loss is widely used for evaluating predictive models, especially when strong distributional data assumptions cannot be taken. However, CV with squared error loss is not free from distributional assumptions, in particular in cases involving non-i.i.d data. This paper analyzes CV for correlated data. We present a criterion for suitability of CV, and introduce a bias corrected cross-validation prediction error estimator, $CV_c$, which is suitable in many settings involving correlated data, where CV is invalid. Our theoretical results are also demonstrated numerically.
— stat updates on arXiv.org
0 notes
Text
Robust Deep Gaussian Processes. (arXiv:1904.02303v1 [stat.ML])
This report provides an in-depth overview over the implications and novelty Generalized Variational Inference (GVI) (Knoblauch et al., 2019) brings to Deep Gaussian Processes (DGPs) (Damianou & Lawrence, 2013). Specifically, robustness to model misspecification as well as principled alternatives for uncertainty quantification are motivated with an information-geometric view. These modifications have clear interpretations and can be implemented in less than 100 lines of Python code. Most importantly, the corresponding empirical results show that DGPs can greatly benefit from the presented enhancements.
— stat updates on arXiv.org
0 notes
Text
Optimized Preprocessing and Machine Learning for Quantitative Raman Spectroscopy in Biology. (arXiv:1904.02243v1 [eess.SP])
Raman spectroscopy's capability to provide meaningful composition predictions is heavily reliant on a pre-processing step to remove insignificant spectral variation. This is crucial in biofluid analysis. Widespread adoption of diagnostics using Raman requires a robust model which can withstand routine spectra discrepancies due to unavoidable variations such as age, diet, and medical background. A wealth of pre-processing methods are available, and it is often up to trial-and-error or user experience to select the method which gives the best results. This process can be incredibly time consuming and inconsistent for multiple operators.
In this study we detail a method to analyze the statistical variability within a set of training spectra and determine suitability to form a robust model. This allows us to selectively qualify or exclude a pre-processing method, predetermine robustness, and simultaneously identify the number of components which will form the best predictive model. We demonstrate the ability of this technique to improve predictive models of two artificial biological fluids.
Raman spectroscopy is ideal for noninvasive, nondestructive analysis. Routine health monitoring which maximizes comfort is increasingly crucial, particularly in epidemic-level diabetes diagnoses. High variability in spectra of biological samples can hinder Raman's adoption for these methods. Our technique allows the decision of optimal pre-treatment method to be determined for the operator; model performance is no longer a function of user experience. We foresee this statistical technique being an instrumental element to widening the adoption of Raman as a monitoring tool in a field of biofluid analysis.
— stat updates on arXiv.org
#stat updates on arXiv.org#Optimized Preprocessing and Machine Learning for Quantitative Raman Spect
0 notes
Text
Eternal sunshine of the spotless cycle
Understanding the quantitative principles underlying the durations of each of the four cell cycle phases has remained a challenge, despite the extensive knowledge on the molecular components and mechanisms related to cell cycle control. In their recent study, Purvis and colleagues (Chao et al, ) quantify cell cycle phase durations in human cells and propose a model whereby cell cycle progression in single cells is a succession of uncoupled, memoryless phases, each composed of a characteristic rate and number of steps.
— Molecular Systems Biology current issue
0 notes
Text
Nano-GLADIATOR: real-time detection of copy number alterations from nanopore sequencing data
Abstract
Motivation
The past few years have seen the emergence of nanopore-based sequencing technologies which interrogate single molecule of DNA and generate reads sequentially.
Results
In this paper we demonstrate that, thanks to the sequentiality of the nanopore process, the data generated in the first tens of minutes of a typical MinION/GridION run can be exploited to resolve the alterations of a human genome at a karyotype level with a resolution in the order of tens of Mb, while the data produced in the first 6-12 hours allow to obtain a resolution comparable to currently available arraybased technologies, and thanks to a novel probabilistic approach are capable to predict the allelic fraction of genomic alteration with high accuracy. To exploit the unique characteristics of nanopore sequencing data we developed a novel software tool, Nano-GLADIATOR, that is capable to perform CNVs/CNAs detection and allelic fraction prediction during the sequencing run ("On-line" mode) and after experiment completion ("Off-line" mode). We tested Nano-GLADIATOR on publicly available ("Off-line" mode) and on novel WGS dataset generated with MinION device ("On-line" mode) showing that our tool is capable to perform realtime CNAs detection obtaining good results with respect to other state of the art tools.
Availability
Nano-GLADIATOR is freely available at https://sourceforge.net/projects/nanogladiator/.
Supplementary information
Supplementary dataSupplementary data are available at Bioinformatics online. — Bioinformatics
#Bioinformatics#Nano-GLADIATOR: real-time detection of copy number alterations from nanopore sequenc
0 notes
Text
IntronDB: a database for eukaryotic intron features
Abstract
Summary
The rate and extent of unbalanced eukaryotic intron changes exhibit dynamic patterns for different lineages of species or certain functional groups of genes with varied spatio-temporal expression modes affected by selective pressure. To date, only a few key conserved splicing signals or regulatory elements have been identified in introns and little is known about the remaining intronic regions. To trace the evolutionary trajectory of spliceosomal introns from available genomes under a unified framework, we present IntronDB, which catalogues approximately 50000000 introns from over 1000 genomes spanning the major eukaryotic clades in the tree of life. Based on the position of introns relative to coding regions, it categorizes introns into three groups such as 5’UTR, CDS and 3’UTR and subsequently divides CDS introns into three categories such as phase 0, phase 1 and phase 2. It provides the quality evaluation for each sequence entry and characterizes the intronic parameters including number, size, sequence composition and positioning information as well as the features for exons and genes, making possible the comparisons between introns and exons. It reports the dinucleotides around the intron boundary and displays the consensus sequence features for all introns, small introns and large introns for each genome. By incorporating the taxonomic assignment of genomes, it performs high-level or genome-wide statistical analysis for single feature and coupled features both in a single genome and across multiple genomes. It offers functionalities to browse the data from representative protein-coding transcripts and download the data from all transcripts from protein-coding genes.
Availability
http://www.nextgenbioinformatics.org/IntronDB
Supplementary information
Supplementary dataSupplementary data are available at Bioinformatics online. — Bioinformatics
0 notes
Text
From me 2U: Quantum's joined the NVMe fabric array party
Quantum, like IBM Storwize, will be using a classic 2U, 24-bay chassis for its excursion into end-to-end NVMe array land, The Reg can reveal.
This F2000 array, the first in an F-Series product line, lowers latency through NVMe-oF, as well boosting data access speed – and should give its StorNext file management customers radically faster file access, it said.
An NVMe move was heralded when Quantum demonstrated an NVMESH partnership with Excelero in September last year.
Here we are, six months later, and the F2000 supports both NVMe flash drives and NVMe over Fabrics access.

Quantum's F2000 box
There are three capacity points: 46TB using dual-port 1.92TB SSDs, 92TB using ones twice as big, and 184TB using 7.68TB SSDs. The drives are accessed by either of two Xeon 6140 CPU-driven hot-swap controllers, configured in an active:active setup.
The system supports dual 100GbitE or quad 32Gbit/s FC port access. As well as NVMe-oF, customers can use Fibre Channel, iSCSI, iSER and RDMA to access the array.
Its software is Quantum's Cloud Storage Platform.
Inside the multi-tiered and multi-protocol StorNext file management environment, Quantum's customers can use the F2000 for real-time editing of 4K and 8K content, recording and streaming of hundreds of video cameras, as well as rendering and simulation.
El Reg gently suggests that the F-Series could eventually replace Quantum's Xcellis scale-out arrays.
The firm's CEO also spoke about coming moves into a software-defined, hyperconverged architecture and promised more products coming this year. ®
Sponsored: Becoming a Pragmatic Security Leader
— The Register
0 notes
Text
Scientists develop methods to validate gene regulation networks
A team of biologists and computer scientists has mapped out a network of interactions for how plant genes coordinate their response to nitrogen, a crucial nutrient and the main component of fertilizer. The work, published in the journal Nature Communications, offers a potential framework and more efficient methods that can be used to investigate a wide-range of vital pathways in any organism. — Phys.org: Biotechnology
0 notes
Text
Catalysis: Energy is the measure of all things
Chem. Commun., 2019, Accepted Manuscript DOI: 10.1039/C9CC00754G, Feature Article
Sebastian Kozuch, Ephrath Solel, Naziha Tarannam Is there any place in the extremely well-established field of catalytic kinetics for new interpretations or novel models that can change the basic doctrines and viewpoints of catalytic cycles? Since... The content of this RSS Feed (c) The Royal Society of Chemistry
— Chem. Commun.
0 notes
Text
Superexchange on the Fast Lane – Intramolecular electron transfer in a molecular triad occurs by conformationally-gated superexchange
Chem. Commun., 2019, Accepted Manuscript DOI: 10.1039/C9CC01886G, Communication
Yusen Luo, Maria Wächtler, Kevin Barthelmes, Andreas Winter, Ulrich Sigmar Schubert, Benjamin Dietzek Photoinduced electron transfer via hopping is generally considered to have a stronger temperature dependence than electron transfer via superexchange. However, we show that the rate of electron transfer via superexchange,... The content of this RSS Feed (c) The Royal Society of Chemistry
— Chem. Commun.
#Chem. Commun.#Superexchange on the Fast Lane – Intramolecular electron transfer in a molecular tria
0 notes
Text
High-Throughput, Time-Resolved Mechanical Phenotyping of Prostate Cancer Cells

Abstract
Worldwide, prostate cancer sits only behind lung cancer as the most commonly diagnosed form of the disease in men. Even the best diagnostic standards lack precision, presenting issues with false positives and unneeded surgical intervention for patients. This lack of clear cut early diagnostic tools is a significant problem. We present a microfluidic platform, the Time-Resolved Hydrodynamic Stretcher (TR-HS), which allows the investigation of the dynamic mechanical response of thousands of cells per second to a non-destructive stress. The TR-HS integrates high-speed imaging and computer vision to automatically detect and track single cells suspended in a fluid and enables cell classification based on their mechanical properties. We demonstrate the discrimination of healthy and cancerous prostate cell lines based on the whole-cell, time-resolved mechanical response to a hydrodynamic load. Additionally, we implement a finite element method (FEM) model to characterise the forces responsible for the cell deformation in our device. Finally, we report the classification of the two different cell groups based on their time-resolved roundness using a decision tree classifier. This approach introduces a modality for high-throughput assessments of cellular suspensions and may represent a viable application for the development of innovative diagnostic devices.
Introduction
Prostate cancer (PCa) is one of the most prevalent forms of male cancer throughout the world1,2, and is the fifth largest cause of cancer-related deaths in men. In part, due to higher life expectancy rates, these figures increase in countries such as the USA and those in Western Europe3. In the UK, for instance, PCa is the most widespread cancer in men4; its incidence rates have increased by 155% since the late 1970s, with 46,690 new cases registered in 2014 alone5. The current diagnostic tests lack sensitivity and specificity sufficient to distinguish between a benign enlarging gland and cancerous changes, typically leading to overdiagnosis6. To prevent just one death in the United States alone, it has been estimated that the cost of screening with prostate specific antigen (PSA) and lifetime treatment costs of identified prostate cancer is approximately US$5 million7. Diagnostic and therapeutic decisions are commonly driven by anomalous levels of PSA in patients’ blood while, on the other hand, this antigen is known to be prostate-specific but not cancer-specific8. The standard screening threshold of 4.1 ng/mL has recently been challenged and accurate cut off values indicative of obtaining a biopsy remain controversial9, since raised levels can be a consequence of an enlarged or inflamed prostate3. Hence, reliable biomarkers for the early-stage detection and characterisation of prostate cancer are not available, and this results in unnecessary and extremely invasive treatment. New methods are required to improve diagnostic and prognostic care pathways.
Various diagnostic techniques have been developed over the last decades, where biochemical markers were investigated to assess the presence and stage of the disease. However, biophysical properties could also represent a viable alternative. For instance, it has been shown that measuring cellular elasticity not only allows one to discriminate between cancerous and healthy cells, but also to determine their metastatic potential: more aggressive cells can, for example, have a different stiffness compared with less aggressive ones8,10. There is now significant evidence that the examination of the a cell’s response to external mechanical stress offers meaningful data about the cytoskeleton11. In turn, changes in the cytoskeleton can be considered to have resulted from disease12,13,14,15 and so are able to act as a label-free biomarker for cell-cycle stage16, differentiation state of stem cells17 and the metastatic state of cancer cells10,12.
Various techniques have been recently developed with the goal of investigating cellular mechanical properties10,12,17,18,19,20. Dudani et al.21 discriminated between Jurkat leukemia cells, MCF7 breast cancer cells, and HeLa cervical cancer cells based on their cellular deformability, using a microfluidic hydrodynamic stretcher. An earlier work by Faria et al.8 showed how prostate cells of different stages in the disease progression can be discriminated based on their elastic properties. Using atomic force microscopy (AFM) they could discriminate between primary benign prostate hyperplasia (BPH) and two well-characterised and widely used prostate cancer cell lines, LNCaP and PC-3. Notably, they were not able to find any mechanical difference between normal PNT2 and PC-3 cell lines which are known to have the highest metastatic potential22.
Here we describe a microfluidic device capable of characterising the time-resolved deformability of single cells subjected to hydrodynamic stress. We report the results of the mechanical characterisation and phenotyping of prostate cell lines: PNT2, commonly used as healthy control cells and DU145, known to possess a moderate metastatic potential22. High-speed imaging was used to monitor the highly dynamic interaction between single cells and a pinching flow. A contour tracking algorithm was developed to quantify cellular deformation over time as a consequence of the applied hydrodynamic load. Furthermore, we implemented a finite element method (FEM) computational model to characterise the spatio-temporal profile of the forces responsible for the cell deformation in our device. Finally, we classified the two cell groups as a result of their different temporal mechanical response using a decision tree classifier.
Results
Time-resolved single cell deformation
To explore the cell mechanics we made use of our microfluidic platform (Fig. 1a,b), which exploits hydrodynamic effects to order and deform single cells at high throughput, based on extending, by modifying the device design, previous work by Dudani et al.21. In our device, the cell suspension and cell-free medium are loaded into the microfluidic chip (Fig. 1b) through two separate inlets. The cell suspension first flows through a filtering region that prevents large clusters or unwanted particulates from clogging the downstream microchannels. The flow rate transporting the cells is controlled by a digital syringe pump. Cells flow through an inertial focuser (as shown in Fig. 1b), which comprises a series of bends of different width and radii of curvature and23. This microfluidic element focuses the cell suspension to a single, evenly spaced, line of cells at the centre of the microchannel24. The main channel intersects two perpendicular and symmetric side arms that are connected to the second inlet from which pure culture medium is constantly loaded into the chip. The flow rate in these arms is controlled independently to that of the cell flow by a separate module of the syringe pump. As the side flows pinch the main flow, each cell becomes subjected to a space-dependent stress as it flows through the pinching region. Therefore, in the cell’s frame of reference, a time-dependent stress, dependent on position along the axis of the channel is observed. Figure S2 describes the shear stress and the net absolute pressure experienced by a cell as it travels across the various regions of the chip in proximity of the pinching region. To impart a measurable cellular deformation, flow velocities in the order of 6 m/s are required; therefore, a high-speed imaging system capable of recording at 300,000 frames per second (fps) was needed to accurately acquire these fast dynamics. High-speed image sequences were analysed using our automated cell tracking algorithm. The perimeter and the area of each cell are automatically extracted in each frame and the time-dependent roundness profiles can be computed and used as a biomarker. Importantly, using a fully coupled fluid-structure interaction simulation we found that the size of the cell greatly affects its interaction with the surrounding fluid; specifically, larger cells are subjected to greater stresses and hence exhibit greater deformations (Figs S3–S6). This is similar to what was previously shown by Otto et al.25. Simulations were run for cells sizes over a range covering what was typically seen in our experimental measurements (radii of 5–10 µm). In addition, three different shear moduli were chosen to represent “compliant”, “medium” and “stiff” cells which extended over the range of maximum deformations as seen in our experimental data. When normalised for initial radius size, each cell shear moduli group displayed a similar trend with changing radii. An exponential fit was made to these normalised values (Fig. S5b).
Figure 1
Experimental set-up and mechanical phenotyping. (a) Schematic diagram of the hydrodynamic stretching platform. The microfluidic chip is on a standard inverted microscope (1). A high-speed camera (2) is used to record the cell deformation and a syringe pump (3) is used to independently control the flow rate that transports the cell suspension and the pure medium used to create the pinching flow. (b) Schematic diagram of the microfluidic chip. The inertial focuser focuses the cell suspension down to a single streak of evenly spaced cells towards the centre of the channel, which are then deformed by the pinching flow. The output of the chip is simply routed and collected into a container. After the mechanical stretching, cells are still viable (survival rate of 94.7 ± 2.2%, averaged over three independent experiments) and therefore the output suspension could potentially be subjected to further analyses. (c) Simulated fluid velocity profile at the mid-plane of the channel at the junction where the pinching streams join the main channel, in the case of an unperturbed cell and a cell at the position of maximum deformation, respectively. The von Mises stress profile in the cell is represented by brightness (grey scale). (d) A DU145 cell deforms as a result of the pinching flow. Before entering the pinching region, the cell is unperturbed and hence its shape is almost spherical. In the second frame the cell starts to experience the effect of the pinched flow and it is slightly deformed. The deformation reaches its maximum in the third frame and it relaxes to a residual deformation.
Full size image
To test the feasibility of using this exponential function fit as a correction factor it was applied to time resolved roundness profiles (from FEM model solutions) of cells with various radii and a shear modulus of 45 kPa (Fig. S6).
The robustness of this correction was established by application to the peak deformation values obtained from simulations of cells with shear moduli of 40 kPa (compliant), 50 kPa (medium) and 60 kPa (stiff), and initial radii ranging from 5 µm to 10 µm (Fig. S7).
Mechanical phenotyping of prostate cells via TR-HS
The control cell line PNT2 and the metastatic prostate cancer cell line DU145 were characterised using our microfluidic platform. Twelve independent experiments, over three consecutive passages (four technical repeats for each biological repeat) were performed. In total, 2108 DU145 and 2438 PNT2 cells were individually analysed.
In Fig. 2a two distinct spatial profiles determined via TR-HS are shown. They represent the evolution of the median \({E}_{corrected}=1-{R}_{corrected}\) (i.e. the deviation from perfect roundness) along the microchannel, for each cell group. The size-corrected roundness, defined as \({R}_{corrected}=1-(1-R){e}^{-0.138r}\) (Fig. S6), where R is the cell roundness and r is the cell radius, became necessary as a statistically significant difference in cell diameter between the two groups was observed, as shown in Fig. 2b,c. In fact, the diameter of the unperturbed cells of DU145 (15.1 ± 0.1, mean ± s.e.m.) was significantly different (p < 0.0001, Z = −7.38, Mann-Whitney U test) from the diameter of PNT2 (15.6 ± 0.1, mean ± s.e.m.). To estimate the differences between the Ecorrected spatial profiles we performed a Mann-Whitney U test at three representative position: initial, maximum and final, corresponding to the spatial position 5 µm, 150 µm, 250 µm along the microchannel. The Ecorrected was highly significantly different at all positions (p < 0.0001, Z = −6.726, −11.398, −10.872, respectively). The control group PNT2 exhibited higher deformability, corresponding to a softer phenotype. Moreover, the profiles exhibit a residual deformation after the maximum Ecorrected peak. This is indicative of a viscoelastic response to the applied stress, information which could potentially allow identification of a specific cell type or sub-populations. Figure 2b,c show the maximum deviation from perfect roundness \({E}_{max}=1-{R}_{min}\), where Rmin is the minimum of the roundness profile for each cell. The Emax of DU145 (0.03 ± 0.0008, mean ± standard error in the mean (s.e.m)) was significantly different (p < 0.0001, Z = −15.3, Mann-Whitney U test) from that of PNT2 (0.06 ± 0.0015, mean ± s.e.m.).
Figure 2
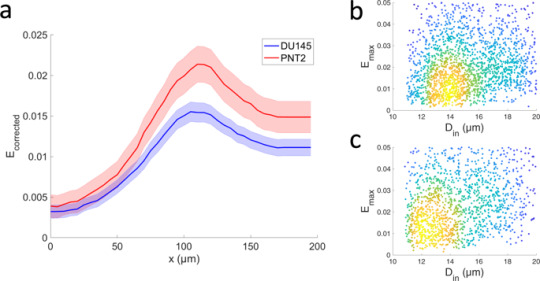
Mechanical characterisation of metastatic and healthy prostate cell lines. (a) Temporal profiles of the cellular mechanical response estimated as median deviation from the perfect roundness \(\,{E}_{corrected}=1-{R}_{corrected}\) for DU145 (n = 2199) and PNT2 (n = 2852) cells. The error bars represent the 95% confidence intervals. Data collected over 12 independent experiments. The two profiles were significantly different at all positions (p < 0.0001, Mann-Whitney U test). (b,c) Density scatterplots of the Ecorrected (maximum deviation from perfect roundness) versus the initial diameter Din of each of the DU145 and PNT2 cells analysed in (a). The density of the data points in (b,c) is given by colour, with blue corresponding to the lowest density and yellow to the highest.
Full size image
Finally, we tested whether the mechanical properties of these cell lines were affected by the number of cell passages during culture and no statistically significant effect was found (p > 0.05, Z = −18.6, Mann-Whitney U test).
Using a decision tree classification we were able to classify DU145 and PNT2 cell lines by considering their temporal corrected roundness profiles. Due to the noisy outcome of the automatic segmentation and tracking (as shown for five cells in Fig. S9), we decided to obtain smoother temporal profiles by averaging the roundness profiles of each group of five consecutive cells passing through the pinching flow. Using the values of the corrected roundness averaged over five consecutive cells, we were able to successfully classify the two cell groups. Specifically, taking values of their corrected roundness profiles at the position of initial, maximum and final deformation resulting classification, we obtained a classification accuracy of 71.4%, with a specificity of 67% and a sensitivity (or True Positive Rate, TPR) of 75%, respectively (Fig. 3b). The use of these three representative values instead of the entire temporal profiles reduced the time of the classification process consistently without affecting its accuracy. Classification of individual cells based on their noisy roundness features resulted in a lower accuracy of 61.5% (83% sensitivity and 31% specificity) (Fig. 3a).
Figure 3
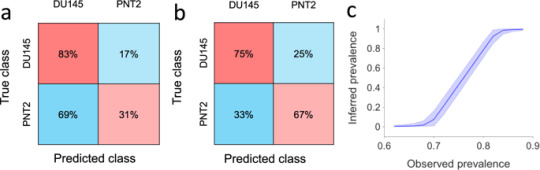
Cellular classification. Classification test results obtained by decision tree classification using as features the size-corrected roundness at the initial position, the final position, and at the point of the maximum deformation. (a) Confusion matrix for classification of individual cells (AUC = 0.58). (b) Confusion matrix for classification of groups of five consecutive cells (from the same class) based on features obtained from their average corrected roundness profile (AUC = 0.72). (c) Cell line prevalence in a mixed sample (n = 5000) obtained using Bayesian inference based on the specificity and sensitivity reported in (a). Plotted are posterior densities (means and 95% posterior probability intervals) for the inferred prevalence of ‘positive’ cells. Densities were computed for observed prevalence values that corresponded to the cell classifier classifying k cells as positive where k ∈ {3100, 3200, …, 4300, 4400}.
Full size image
Furthermore, we sought to understand whether our single cell classifier could be used to infer the relative prevalence of a cell line in a sample containing a mixture of the two cell lines. For illustrative purposes, consider using it to analyse a mixed sample of two populations in which the cells are mixed in 50:50 proportion. Specifically, consider a sample of 5000 cells of which 2500 are ‘positive’ and 2500 are ‘negative’. The cell classifier’s low specificity means that it will certainly classify the majority of cells as positive. The number of positive classifications that would be obtained in such a setting follows a binomial distribution and has mean 3800 with 95% posterior probability interval (3740, 3860). Conversely, given an experiment in which the cell classifier was applied to a mixed cell sample resulting in a certain number of positive cell classifications, we could use Bayesian inference to infer the true prevalence of positive cells in the sample (see Methods). For example, if 3800 cells were classified as positive by the classifier, a run of the inference algorithm gives an inferred prevalence of 49.9% with 95% posterior interval (41.4%, 58.4%). Figure 3c shows prevalence distributions inferred in this manner across the entire range of feasible observed prevalence. It suggests that even a weak cell classifier, such as the one considered here, might be used to infer prevalence in large mixed samples.
FEM modelling of the cell-fluid interaction
To understand how cells and the surrounding stream are mutually influenced during the cellular deformation, we implemented a fully coupled, time dependent fluid-structure interaction finite element model (FEM) of the TR-HS (see Methods).
Figure S2 shows the time evolution of shear stress and net pressure acting on a cell passing through the pinched flow region in the TR-HS. The flow rate around the cell and the von Mises stress in the cell are also depicted in Fig. S2. The simulation also allowed us to estimate the relationship between the cell size, cell speed and the hydrodynamic forces, as shown in Figs S3–S5.
Based on the magnitudes of the cell deformation observed during the experiments, our model suggests a cellular shear modulus (G) in the order of 50 kPa. If we consider cells to be isotropic, and assuming the Poisson ratio (ν) being 0.512, we can then estimate that the elastic modulus (E = 2G(1 + v)), would be in the range of 150 kPa. On the other hand, by performing AFM force spectroscopy on a sample of DU145 cells (N = 72), Young’s modulus of 799 ± 545 Pa (mean ± s.d.) was recorded. The obtained Young’s moduli were corrected with a double-contact model which accounts for compression due to contact between the bottom of the cell and the hard substrate of the measuring dish26.
Discussion
We developed a microfluidic platform for investigating the dynamic mechanical response of cells in suspension. The working principle is based on hydrodynamic stretching introduced by Dudani et al.21, where cell deformation is imparted by a pinching flow. In our implementation of the system an additional inlet has been added to allow for an independent control over the flow rates of the pinching flow with respect to the flow rate of the cell solution. This configuration, despite the additional inlet, allowed us to eliminate the region of the chip where the cell-free fluid is siphoned off from the main flow described by Dudani et al.21. This helps to reduce clogging in this area of the system and therefore increases the reliability of the single measurement as well as improving the usability of a device over repeated measurements. In fact, even a partial obstruction of the channels could lead to big changes in the hydrodynamic forces acting on the cells, and therefore affect the reproducibility of the outputs. Therefore, the absence of obstructions needs to be guaranteed. Furthermore, the additional inlet allows for a fine-tuning of the forces acting on the cells, by changing the flow rate ratio between the main and side arm flows. In addition, different fluids can potentially be loaded through each inlet. The use of our Time-Resolved Hydrodynamic Stretcher (TR-HS) enabled us to discriminate two different prostatic cell lines, DU145 (cancerous) and PNT2 (healthy), based on their time-resolved roundness profiles.
Various studies have shown that cancer cells are softer than healthy cells and that the negative correlation can be found between cell stiffness and aggressiveness8,10. It is believed that the decreased stiffness confers aggressive cancer cells the ability to more easily invade neighbouring tissues27. Based on this hypothesis it was expected that the moderate metastatic potential DU145 cells would be softer than the PNT2 cells. However, our results show the opposite. One possible reason for this is that these cells lines have different origins (PNT2 cells are derived are normal adult prostatic epithelial cells, while the DU145 are derived from brain metastatic cells) and hence it is not possible to draw any mechanistic connection between their mechanical phenotype and physiology. Another explanation would be that our technique measures the stiffness at very short time-scale (µs). In this case it is not possible to compare our results with those of techniques such as AFM which allows for assessing cellular mechanical properties dominated by steady-state viscosity.
In addition to previous methods13,21,25, where a static mechanical measurement is commonly used to generate flow cytometry-like density scatterplots, to characterise mechanical fingerprints of individual cellular group, we introduce an alternative measurement modality that is based on spatial profiles where the time-dependent mechanical response of large number of cells can be assessed and used as a biomarker for discriminating among different cellular groups. A roundness profile represents the mechanical response of the cell to the hydrodynamic load experienced, at each position, while travelling along the channel. The TR-HS bridges the gap between microfluidic-based single-cell assays, and measurements previously demonstrated only through optical-based technologies, such as the optical stretcher28,29,30,31, by which changes in cellular viscoelasticity of whole cells in suspension could be assessed. Our method has the capability of the latter technology of capturing time-resolved mechanical information, combined with the high-throughput of the former.
Additionally, we sought to characterise how cells interact with the surrounding flow. We implemented a fully coupled, time dependent, fluid-structure interaction finite element model (FEM) of the TR-HS. As cells never reach a steady-state deformation in this channel configuration, this enabled us to better describe the two-way interaction between the pinching flow and a deforming cell, which would prove challenging using analytical methods. Furthermore, this simulation allowed us to investigate the effect of the cell size and relative elasticity on the resulting measurement of cell roundness. Hence, a corrective factor for the cell roundness in this TR-HS geometry was determined to account for the size-dependent cell deformability.
The model also allowed us to investigate the scale of the shear stress acting on a cell flowing through the pinching flow. The estimated cellular elasticity appears to contrast our AFM spectroscopy data, ~150 kPa and ~370 Pa respectively. A similar observation was made by Mietke et al.32 in their microfluidic based real-time deformability cytometry study, where it was suggested that such a discrepancy may be explained by the frequency dependence of cellular elasticity. Evidence has been published in the literature which suggests that the elastic response of cells follows a weak power law in time, typically with exponents of 0.1 to 0.5 (Kollmannsberger et al.33). Using this relation and a timescale of the order of ~ms, Meike et al.32 drew some validity to their high estimated elasticity values, where they noted AFM derived values of the order of 0.17 kPa compared to ~1.5 kPa from their RT-DC experiments on HL60 cells. Following a similar reasoning, we can use the following relation to extrapolate from our AFM measured values of ~370 Pa,
$${K}_{i}={K}_{0}{({t}_{0}/{t}_{i})}^{\alpha }$$
where, Ki is the expected modulus, K0 is the experimentally measured modulus (i.e. AFM), t0 and ti are the respective strain rates (i.e. ~1 s−1 for AFM and ~1 μs−1 for TR-HS), and α is the power law exponent. Figure S8 shows a plot of this power law relation where, considering the short timescales involved in our hydrodynamic cell stretching, estimated elastic moduli in the range 1–300 kPa may be expected depending on the exponent chosen; this fits well with the FEM simulation results.
It has been suggested that materials, such as biological cells, which exhibit power-law like responses may be more accurately described by a distribution of characteristic relaxation times and corresponding shear moduli34,35. Additionally, it has recently been proposed that an incomplete deformation recovery, such as that seen in our experimental deformation profiles (Fig. 2a), is due to an additive plastic deformation process that follows a similar power-law response36. In the future, a more complete treatment of the physical properties of the cells in our FEM model would include appropriate treatments to account for these more complex behaviours.
One important aspect to consider is that our AFM measurements were done in PBS while the microfluidic measurements were done in culture medium. This might contribute to a different mechanical behaviour as culture medium contains growth factors which are known to activate Rho/Rac pathways37,38.
Biological samples have an extremely heterogeneous nature and cellular physiological properties change with time and experimental conditions. Therefore, a key requirement for a robust diagnostic tool is the capability to acquire measurements from large populations, in a short period of time, at constant environmental conditions, without excessive sample handling.
A disease might involve a small sub-population of cells, and therefore the capability of detecting subtle cellular anomalies is a key requirement. Our method represents a novel solution to these diagnostic requirements (also demonstrated in other diseases using similar technologies13,21,25). Only small volumes of cell solutions are required, and several thousands of cells can be analysed in a few seconds. Additionally, no labelling or molecular probes are required, reducing reagent batch variability as well as preparation time, labour and costs21.
Utilising machine learning, classification of samples of five cells into the two cellular populations based solely on mechanophenotypic information with a 71.4% accuracy (75% sensitivity and 67% specificity) was achieved. This value, which is reasonably high for such a small difference in roundness between the two cell lines, could be improved substantially in the case of greater differences in mechanical properties between different sample groups. Tests will be carried out with prostate primary cells to understand whether differences in stiffness can be used as a biomarker of the disease. The single-cell roundness profiles produced by the automatic segmentation and tracking were noisy; classification accuracy could be improved by reducing the noise associated with the cell segmentation through a further refined algorithm. However, even a weak cell classifier could be used to infer the relative prevalence of a cell line in a sample containing a mixture of two cell lines. Figure 3c shows this for an illustrative case in which 5000 cells are classified using a classifier with the specificity and sensitivity reported in Fig. 3a. Shown are the mean posterior probability (with 95% posterior probability intervals) of the true prevalence of a cell line given the observed prevalence, i.e. given the proportion of the cells classified as belonging to that cell line by the cell classifier. These posterior densities were computed using Bayesian inference (see Methods).
The aggressiveness of a prostate tumour is currently assessed using the Gleason scoring system that evaluates the morphological architecture of histologic samples39. The arrangement of the cells within the prostatic tissue sections is visually inspected and a score is assigned based on their pattern. However, this method is characterised by a high degree of subjectivity, as well as intra-observer and inter-observer variability39,40. Moreover, because of the heterogeneous and multifocal nature of this disease, the likelihood of missing the lesion during the biopsy is high, with a high morbidity associated with invasive biopsy procedure41. Using our method, cells shed from the prostate into urine could be analysed instead; this would allow for an additional non-invasive guidance for treatment decisions, enabling a personalised medicine approach13. Although high-speed imaging is still an expensive technology, its increasing adoption in many areas of science and technology should lead to the release of faster, as well as cheaper devices in the near future. Our high-speed camera allows the user to store a video containing several hundred thousand frames, that can be transferred to a PC for further analysis with a delay of a few minutes. However, our image analysis algorithm requires a few hours to analyse the content of the images. These delays prevent our method from direct adoption into medical settings. On the other hand, the combination of real-time acquisition methods (similar to that shown by Otto et al.25) and quicker image segmentation algorithms, will help to improve our technique substantially.
Cell mechanics is an important alternative method to quantify differences among cell types. The label-free biomarker reported in this work could be exploited to develop screening devices capable of achieving, alone or in combination with existing screening modalities, better early-stage diagnostics based on the analysis of bodily fluids.
Methods
Device fabrication
Standard photolithographic techniques were employed to develop the moulds of the microfluidic chip. Replicas were obtained by soft lithography using polydimethylsiloxane (PDMS) (Sylgard 184 Silicone Elastomer Kit; Dow Corning Corporation). A 1 mm biopsy puncher (Harris Uni-Core) was used to open ports punched through the inlet and outlet. The complete microfluidic devices were sealed using a glow discharge system (Agar Scientific) where the micropatterned PDMS layers were bonded to standard microscope glass slides (VWR) and successively annealed at a temperature of 80 °C for 1 hour.
Hydrodynamic manipulation
Cell suspensions are introduced into the device through the cell loading inlet (Figs 1b and S1), and the pinching flow is loaded through a second inlet (Figs 1b and S1). The two fluxes are independently controlled using a syringe pump (neMESYS, Cetoni) and introduced into the chip via 1/16 inches PTFE tubing (Sigma-Aldrich). The cell solution moves through a filtering region (Figs 1b and S1) which helps to avoid unwanted objects obstructing the channels downstream of it. An inertial focuser is located downstream of the filtering region. This component comprises alternating bends with different radii of curvature and widths and has two essential roles: (1) focusing cells into a linear array at the centre of the straight channel upstream of the pinching region; (2) introducing even spacing between consecutive cells so that cells can reach the imaging region and be analysed one by one23. The focusing effect results from a specific ratio between the secondary Dean flow and inertial lift. The latter is a function of the flow rate, cell diameter, and channel’s aspect ratio and radius42,43. The longitudinal spacing between consecutive cells depends on the concentration of the cell suspension, the Reynolds number Rec of the microchannel, and the Reynolds number Rep of the particle in suspension24. The ordered train of cells is then intersected by the side branches where two symmetric fluxes of pure cell-free medium form a pinching flow. Each cell entering this region is subjected to a mechanical deformation resulting from the dynamic interaction with the pinching flow. All measurements were carried out at room temperature 1 hour after cell detachment. The hydrodynamic load was generated by setting a flow rate of 200 μL/min in the cell inlet and 400 μL/min in the pinching flow inlet, respectively.
Cellular viability at the outlet of the microfluidic device was assessed by the exclusion of 0.1% trypan blue dye.
Cell culture
Healthy cell line PNT2 was purchased from Sigma-Aldrich, while the metastatic prostate cancer cell line DU145 was obtained from ATCC-LGC Standards. Both suppliers ensure authenticated, validated and mycoplasma free cell lines. Cells were cultured in a lab with no history of mycoplasma infection after no longer than 3 months of purchase. DU145 cells were cultured in Corning T-75 flasks (VWR) in Dulbecco’s Modified Eagle Medium/DMEM containing 10% Fetal Bovine Serum and 1% Penicillin-Streptomycin (all Sigma-Aldrich)43. PNT2 cells were cultured in Corning T-75 flasks using RPMI-1640 medium (Sigma-Aldrich)43. Flasks were kept in a CO2 controlled incubator at 37 °C. Samples were prepared for analysis once 70% confluent by removing supernatant media, washing each flask with 5 mL Trypsin-EDTA (Sigma-Aldrich) and incubating with 3 mL Trypsin-EDTA until cells had detached. Trypsin was neutralized adding 7 mL pre-warmed complete RPMI or DMEM43. After detachment, cells were spun for five minutes at 1500 RPM and the resulting pellet gently resuspended in 2 mL pre-warmed complete DMEM or RPM. Cells were passaged every third day.
Imaging
A Nikon Eclipse TE2000-U equipped with a 20x objective was used (Nikon CFI TU Plan Epi ELWD 20×, NA = 0.40, WD = 19.0 mm). A high-speed camera (Fastcam SA-X2, Photron) was employed to image the fast flow-cell interaction. A frame rate of 300,000 fps, a resolution of 256 × 80 pixels and an exposure time of 0.29 μs were set using the proprietary software. The microscope built-in halogen lamp illumination was used.
Image analysis
An ad hoc automated contour tracking algorithm was implemented combining Matlab and C++ and used to quantify the evolution of the cellular deformation over time. The image sequences were analysed by adapting the method reported by Huang et al.44. Each cell was detected based on its approximate radial symmetry and segmented using a radial active contour model43. The cell tracker was initialised once cells first appeared within the field of view. The cell velocity was estimated in each frame and its value used to generate a search region for the cell in the following frame. The cell shape was recorded until exiting the field of view. Short training sequences containing ten randomly selected cells were used to tune the parameters of the algorithm. At each frame the area and perimeter of the cells were determined and the roundness calculated as 4πArea/Perimeter2. The code is available upon request.
AFM Force Spectroscopy
A JPK Nanowizard scanning force microscope (JPK Instruments) positioned on a Zeiss Axiovert inverted microscope (Carl Zeiss AG) was used to perform indentation experiments to gather quantitative measurements of cell stiffness. Well-defined nano-indenters were constructed by adhering 10 μm diameter silica micro-spheres to tipless cantilevers (Arrow TL2, Nanosensors) with a biocompatible two-part epoxy (Araldite). Poly-L-lysine coated coverslips were placed in a custom microscope slide chamber which was subsequently filled with 2 mL of sterile PBS. 20 μL of the cell suspension (~1,000 cells) was pipetted over the immersed coverslip and left motionless for 5 minutes to allow adequate time for all cells to settle into contact with the coverslip. Probe approach speed (1 μm/s) and max indentation force (1 nN) were kept constant for all measurements. Young’s Moduli were determined by fitting the Hertz model to force-indentation curves using a dedicated software package (JPK SPM Data Processing, JPK Instruments).
Numerical simulation
A fully coupled time dependent fluid-structure interaction finite element model (FEM) of the hydrodynamic stretcher (HS) was created using COMSOL Multiphysics (Comsol Inc.). The model uses an arbitrary Langrangian-Eulerian (ALE) formulation with a deformed mesh to capture the two-way interaction of a deforming cell in the fluid flow. An 800 μm long by 250 μm wide section of the HS, centred on the pinching flow region, was used for the model domain with laminar inflows of 200 μL/min defined at each inlet and a 0 Pa relative pressure boundary condition set at the outlet. Fluid physical properties were set to that of water at room temperature and the cell was defined as a homogeneous linear viscoelastic material.
Values of shear modulus used in the simulation were selected due to the resulting deformation magnitudes approximating the range seen in our experimental observations.
Statistical analysis
Microsoft Excel, IBM SPSS Statistics 20 (SPSS Inc) and MATLAB 2018b (MathWorks, Inc.) were utilised for the statistical analysis. The functions dscatter and mseb (MathWorks File Exchange) were used to generate the plots in Fig. 2.
Considering that data were not normally distributed the Mann-Whitney U test was performed to assess differences in roundness between DU145 and PNT2 cells analysed using the TR-HS, at three representative points along the profile: initial, maximum and final roundness. The Mann-Whitney U test results are reported indicating the ‘p-value’ and ‘Z’.
All data are available from the authors.
Cell classification using machine learning
We used machine learning to classify cells as belonging to the two cell lines DU145 or PNT2 based on the cellular feature ‘corrected roundness‘. Specifically, the dependent variable was categorical (DU145 or PNT2) and the independent variables, or predictors, were the different values of the cellular roundness taken at three positions along the temporal profile: initial, final, and maximum. A decision tree classifier was used with cross-validation, specifically the Simple Tree implementation in the MATLAB 2016b (MathWorks, Inc.) Statistics and Machine Learning Toolbox. Since the single-cell roundness profiles were noisy (due to the outcome of our automatic tracking algorithm), we also trained and validated decision tree classification of groups of five cells known to be from the same class, based on size-corrected roundness features extracted from their average roundness profile.
Bayesian inference of cell line prevalence
Bayesian inference of prevalence was performed using OpenBUGS (version 3.2.3 rev. 1012). The model used followed that of Speybroeck et al.45 and assumed that the specificity and specificity reported for the cell classifier in Fig. 3a were correct. Computation of each prevalence posterior density involved running a Markov chain Monte Carlo (MCMC) sampling algorithm. Specifically, a single chain of 20,000 samples was generated.
Additional information
Publisher’s note: Springer Nature remains neutral with regard to jurisdictional claims in published maps and institutional affiliations.
References
1.
Brody, H., Michelle, G., Hodson, R. & Jenny, R. Prostate cancer. Nature 528, S117 (2015).
CAS
Article
Google Scholar
2.
Siegel, R. L., Miller, K. D. & Jemal, A. Cancer Statistics, 2015. CA. Cancer J. Clin. 65, 5–29 (2015).
Article
Google Scholar
3.
Weir, K. Inflammatory evidence. Nature 528, 130–131 (2015).
ADS
Article
Google Scholar
4.
Prostate cancer|World Cancer Research Fund UK. Available at, http://www.wcrf-uk.org/uk/preventing-cancer/cancer-preventability-statistics/prostate-cancer. [Accessed February 2019].
5.
Prostate cancer incidence statistics|Cancer Research UK. Available at, http://www.cancerresearchuk.org/health-professional/cancer-statistics/statistics-by-cancer-type/prostate-cancer/incidence. [Accessed February 2019].
6.
Sohn, E. Diagnostic dilemma. Nature 528, 120–122 (2015).
ADS
Article
Google Scholar
7.
Shteynshlyuger, A. & Andriole, G. L. Cost-effectiveness of prostate specific antigen screening in the United States: extrapolating from the European study of screening for prostate cancer. J. Urol. 185, 828–832 (2011).
Article
Google Scholar
8.
Faria, E. C. et al. Measurement of elastic properties of prostate cancer cells using AFM. Analyst 133, 1498–1500 (2008).
ADS
CAS
Article
Google Scholar
9.
Morote, J. et al. Comparison of percent free prostate specific antigen and prostate specific antigen density as methods to enhance prostate specific antigen specificity in early prostate cancer detection in men with normal rectal examination and prostate specific antigen b. J. Urol. 158, 502–504 (1997).
CAS
Article
Google Scholar
10.
Guck, J., Schinkinger, S., Lincoln, B. & Wottawah, F. Optical deformability as an inherent cell marker for testing malignant transformation and metastatic competence. Biophys. J. 88, 3689–3698 (2005).
CAS
Article
Google Scholar
11.
Elson, E. L. Cellular mechanics as an indicator of cytoskeletal structure and function. Annu. Rev. Biophys. Biophys. Chem. 17, 397–430 (1988).
CAS
Article
Google Scholar
12.
Cross, S. E., Jin, Y.-S., Rao, J. & Gimzewski, J. K. Nanomechanical analysis of cells from cancer patients. Nat. Nanotechnol. 2, 780–783 (2007).
ADS
CAS
Article
Google Scholar
13.
Gossett, D. R. et al. Hydrodynamic stretching of single cells for large population mechanical phenotyping. Proc. Natl. Acad. Sci. 109, 7630–7635 (2012).
ADS
CAS
Article
Google Scholar
14.
Lee, L. M. & Liu, A. P. A microfluidic pipette array for mechanophenotyping of cancer cells and mechanical gating of mechanosensitive channels. Lab Chip 15, 264–273 (2015).
CAS
Article
Google Scholar
15.
Lange, J. R. et al. Microconstriction Arrays for High-Throughput Quantitative Measurements of Cell Mechanical Properties. Biophys. J. 109, 26–34 (2015).
ADS
CAS
Article
Google Scholar
16.
Théry, M. & Bornens, M. Get round and stiff for mitosis. HFSP J. 2, 65–71 (2008).
Article
Google Scholar
17.
Pajerowski, J. D., Dahl, K. N., Zhong, F. L., Sammak, P. J. & Discher, D. E. Physical plasticity of the nucleus in stem cell differentiation. Proc. Natl. Acad. Sci. USA 104, 15619–15624 (2007).
ADS
CAS
Article
Google Scholar
18.
Pelling, A. E. & Horton, M. A. An historical perspective on cell mechanics. Pflugers Arch. Eur. J. Physiol. 456, 3–12 (2008).
CAS
Article
Google Scholar
19.
Guck, J. & Chilvers, E. R. Mechanics meets medicine. Sci. Transl. Med. 5, 212fs41 (2013).
Article
Google Scholar
20.
Di Carlo, D. A mechanical biomarker of cell state in medicine. J. Lab. Autom. 17, 32–42 (2012).
Article
Google Scholar
21.
Dudani, J. S., Gossett, D. R., Tse, H. T. K. & Di Carlo, D. Pinched-flow hydrodynamic stretching of single-cells. Lab Chip 13, 3728–3734 (2013).
CAS
Article
Google Scholar
22.
MuraliKrishna, P. S. et al. RNA Interference-Directed Knockdown of Urokinase Plasminogen Activator and Urokinase Plasminogen Activator Receptor Inhibits Prostate Cancer Cell Invasion, Survival and Tumorigenicity In vivo. J. Biol. Chem. 280, 36529–36540 (2005).
Article
Google Scholar
23.
Di Carlo, D., Irimia, D., Tompkins, R. G. & Toner, M. Continuous inertial focusing, ordering, and separation of particles in microchannels. Proc. Natl. Acad. Sci. USA 104, 18892–18897 (2007).
ADS
Article
Google Scholar
24.
Kahkeshani, S., Haddadi, H. & Di Carlo, D. Preferred interparticle spacings in trains of particles in inertial microchannel flows. J. Fluid Mech. 786, R3 (2016).
Article
Google Scholar
25.
Otto, O. et al. Real-time deformability cytometry: on-the-fly cell mechanical phenotyping. Nat. Methods 12, 199–202 (2015).
CAS
Article
Google Scholar
26.
Glaubitz, M. et al. A novel contact model for AFM indentation experiments on soft spherical cell-like particles. Soft Matter 10, 6732 (2014).
ADS
CAS
Article
Google Scholar
27.
Vile, R. G. Cancer metastasis: from mechanisms to therapies. Molecular medical science series (J. Wiley, 1995).
28.
Wottawah, F., Schinkinger, S. & Lincoln, B. Characterizing single suspended cells by optorheology. Acta Biomater. 1, 263–271 (2005).
Article
Google Scholar
29.
Wottawah, F. et al. Optical Rheology of Biological Cells. Phys. Rev. Lett. 94, 098103 (2005).
ADS
Article
Google Scholar
30.
Remmerbach, T. W. et al. Oral cancer diagnosis by mechanical phenotyping. Cancer Res. 69, 1728–1732 (2009).
CAS
Article
Google Scholar
31.
Ekpenyong, A. E. et al. Viscoelastic Properties of Differentiating Blood Cells Are Fate- and Function-Dependent. PLoS One 7, e45237 (2012).
ADS
CAS
Article
Google Scholar
32.
Mietke, A. et al. Extracting Cell Stiffness from Real-Time Deformability Cytometry: Theory and Experiment. Biophys. J. 109, 2023–2036 (2015).
ADS
CAS
Article
Google Scholar
33.
Kollmannsberger, P. & Fabry, B. Linear and Nonlinear Rheology of Living Cells, https://doi.org/10.1146/annurev-matsci-062910-100351
34.
Balland, M. et al. Power laws in microrheology experiments on living cells: Comparative analysis and modeling. Phys. Rev. E - Stat. Nonlinear, Soft Matter Phys. 74 (2006).
35.
Dailey, H. L. & Ghadiali, S. N. Influence of power-law rheology on cell injury during microbubble flows. Biomech. Model. Mechanobiol. 9, 263–279 (2010).
CAS
Article
Google Scholar
36.
Bonakdar, N. et al. Mechanical plasticity of cells. Nat. Mater. 15, 1090–1094 (2016).
ADS
CAS
Article
Google Scholar
37.
Liu, B. P. & Burridge, K. Vav2 activates Rac1, Cdc42, and RhoA downstream from growth factor receptors but not beta1 integrins. Mol Cell Biol 20, 7160–9 (2000).
38.
Ridley, A. J. & Hall, A. The small GTP-binding protein rho regulates the assembly of focal adhesions and actin stress fibers in response to growth factors. Cell 70, 389–399 (1992).
CAS
Article
Google Scholar
39.
Humphrey, P. A. Gleason grading and prognostic factors in carcinoma of the prostate. Mod. Pathol. 17, 292–306 (2004).
Article
Google Scholar
40.
Allsbrook, W. C. et al. Interobserver reproducibility of Gleason grading of prostatic carcinoma: Urologic pathologists. Hum. Pathol. 32, 74–80 (2001).
Article
Google Scholar
41.
Brewster, D. H. et al. Risk of hospitalization and death following prostate biopsy in Scotland. Public Health 142, 102–110 (2017).
CAS
Article
Google Scholar
42.
Amini, H., Lee, W. & Di Carlo, D. Inertial microfluidic physics. Lab Chip 14, 2739–2761 (2014).
CAS
Article
Google Scholar
43.
Belotti, Y. et al. Hydrodynamic stretching for prostate cancer detection. in SPIE 9518, Bio-MEMS and Medical Microdevices II 95180H (2015).
44.
Huang, T., Hacker, C., Lucocq, J. & McKenna, S. J. Detecting and Segmenting Nanodiscs in Immuno-Electron Micrographs. Med. Image Underst. Anal. 53–58 (2014).
45.
Speybroeck, N., Devleesschauwer, B., Joseph, L. & Berkvens, D. Misclassification errors in prevalence estimation: Bayesian handling with care. Int. J. Public Health 58, 791–795 (2013).
Article
Google Scholar
Download references
Acknowledgements
We are grateful to Prof. J. Douglas Steele, Prof. Jochen Guck and Dr. Steven Neale for helpful discussions. We acknowledge the Scottish Universities Physics Alliance (SUPA) for support, as well as Tenovus Scotland and the Hugh Fraser Trust. Y.B. thanks EPSRC for support through a DTP studentship (EP/K503010/1). We thank Lara van Leeuwen for critical reading of the manuscript.
Author information
Author notes
Serenella Tolomeo, Michael J. Conneely and Tianjun Huang contributed equally.
Affiliations
University of Dundee, SUPA, School of Science and Engineering, Dundee, Scotland, UK
Yuri Belotti
, Tianjun Huang
, Stephen J. McKenna
& David McGloin
University of Dundee, School of Life Sciences, Dundee, Scotland, UK
Michael J. Conneely
University of Dundee, School of Medicine, Dundee, Scotland, UK
Serenella Tolomeo
& Ghulam Nabi
University of Technology Sydney, School of Electrical and Data Engineering, Sydney, Australia
David McGloin
Authors
Search for Yuri Belotti in:
Nature Research journals •
PubMed •
Google Scholar
Search for Serenella Tolomeo in:
Nature Research journals •
PubMed •
Google Scholar
Search for Michael J. Conneely in:
Nature Research journals •
PubMed •
Google Scholar
Search for Tianjun Huang in:
Nature Research journals •
PubMed •
Google Scholar
Search for Stephen J. McKenna in:
Nature Research journals •
PubMed •
Google Scholar
Search for Ghulam Nabi in:
Nature Research journals •
PubMed •
Google Scholar
Search for David McGloin in:
Nature Research journals •
PubMed •
Google Scholar
Contributions
Y.B. designed and developed the device. Y.B. cultured cells and ran the cell stretching experiments. G.N. provided cell lines. M.C. designed and performed the AFM experiments, and developed the FEM computational simulations, related analyses and cell size correction factor. T.H. and S.M. developed the automatic segmentation and tracking software. Y.B. and S.T. conducted the data analysis and classification. Y.B. designed the study and wrote the manuscript. All the authors discussed the results and commented on the manuscript. D.M., G.N. and S.M. supervised the work. D.M. conceived and led the project.
Competing Interests
The authors declare no competing interests.
Corresponding authors
Correspondence to Yuri Belotti or David McGloin.
Supplementary information
TRHS Supplementary Information
2a
2bc
3a
3b
3c
Rights and permissions
Open Access This article is licensed under a Creative Commons Attribution 4.0 International License, which permits use, sharing, adaptation, distribution and reproduction in any medium or format, as long as you give appropriate credit to the original author(s) and the source, provide a link to the Creative Commons license, and indicate if changes were made. The images or other third party material in this article are included in the article’s Creative Commons license, unless indicated otherwise in a credit line to the material. If material is not included in the article’s Creative Commons license and your intended use is not permitted by statutory regulation or exceeds the permitted use, you will need to obtain permission directly from the copyright holder. To view a copy of this license, visit http://creativecommons.org/licenses/by/4.0/.
About this article
Publication history
Received
22 May 2017
Accepted
08 March 2019
Published
05 April 2019
Issue Date
December 2019
DOI
https://doi.org/10.1038/s41598-019-42008-0
Comments
By submitting a comment you agree to abide by our Terms and Community Guidelines. If you find something abusive or that does not comply with our terms or guidelines please flag it as inappropriate.
— Nature Scientific Reports
0 notes
Text
How to Read a Microcontroller Datasheet: Exploring the Hardware
This article provides some tips on making efficient use of the peripheral sections in your microcontroller’s datasheet (or reference manual, or user guide).
In the previous article, I pointed out some of the difficulties associated with microcontroller documentation and then discussed the first three steps in my recommended procedure for avoiding datasheet burnout. Those first three steps apply to MCU documentation in general, and in this article we will focus on information related to the peripherals.
Previous articles in the Introduction to Microcontrollers series:
Step 4: Ignore the Peripherals That You Do Not Need
The peripheral modules within a microcontroller are largely independent of one another. Make sure that you understand this point, because it’s an important concept in the context of MCU-based system design. The following diagram emphasizes this point.

The elements of the processor are closely interconnected, but the peripherals are depicted as separate blocks that have an independent connection to the processor. This accurately reflects real microcontroller operation: if a given peripheral is not needed, it is placed in an inactive state and can be ignored.
However, microcontrollers are not designed to prevent interaction between separate peripheral modules, because in some cases this interaction is desirable, and that’s why I said that the peripheral modules are “largely independent.” For example, a periodic signal generated by a timer module might be used to establish the baud rate for a UART module or initiate conversions performed by an ADC module.
Nevertheless, the general principle is sound: unused peripherals will not affect the overall functionality of the device, and consequently you do not need to read the sections of the datasheet that explain all the details of these unused peripherals. This step alone can eliminate a large portion of the documentation burden, because many applications require only a small fraction of the generous peripheral functionality provided by modern microcontrollers.
Step 5: Investigate Your Configuration Software
Hardware configuration can be one of the most demanding and tiresome aspects of microcontroller development. Performing extensive register-level configuration of peripheral modules requires attention to detail, careful scrutiny of the datasheet, and lots of awkward bit manipulation.
Fortunately, people realized that this was not a good use of an engineer’s time, and manufacturers decided to create software tools that greatly simplify the task of hardware configuration. For example, Microchip provides MPLAB Code Configurator, which allows the designer to generate peripheral-configuration code using a graphical interface. The Config2 application from Silicon Labs (see screenshot below) does the same thing.

If you approach a datasheet with the assumption that you will need to manually configure all of the MCU’s hardware, you may find that a growing sense of desperation is making it impossible for you to concentrate. Believe me, hardware-configuration tools can greatly reduce the amount of datasheet material that you need to absorb.
The difficulty here is identifying the unnecessary information. Unfortunately, I’ve never come across a datasheet that has a section entitled “Things That You Actually Need to Know If You Plan to Use the Configuration Tool.” I recommend that you review the documentation for the configuration software before you dive into the datasheet, and when you are reading a section that covers a given peripheral, ignore the configuration-specific details until after you have gained some experience with the software.

Texas Instruments provides an entire software tool just for its MSP430 capacitive-touch-sense functionality. The graphical interface allows you to both configure and optimize cap-sense buttons, wheels, sliders, and proximity sensors.
The bottom line is that you shouldn’t waste your life poring over datasheet minutiae that have already been incorporated into free, user-friendly software.
Step 6: Investigate Your API
Hardware-configuration tools come with a major limitation: they cannot be used during program execution. Configuration software is something that you use to create code; it cannot modify a microcontroller’s operation in real time.
Fortunately, a large portion of the required hardware configuration typically takes place only once, namely, during the initial sequence of instructions that are executed after a reset. But there certainly are times when you want to make precise modifications during program execution, perhaps in response to an external event. This is where the application programming interface (API) comes into play.
“API” may not be the best terminology here, but I’m not familiar with any other words or abbreviations that are more appropriate. What I’m referring to is the collection of programming “shortcuts” provided by a manufacturer. Atmel calls this the Advanced Software Framework (you can read more about the ASF in this article), and I think that Silicon Labs uses the term Software Development Kit (SDK). In any case, the name is far less important than the content—i.e., library functions, example code, macros, preprocessor definitions, and anything else that helps the programmer to directly interact with the device’s hardware without becoming an expert in complex configuration settings.

The Advanced Software Framework has individual modules corresponding to the microcontroller’s peripherals.
I think that it’s important to be familiar with your microcontroller’s hardware, and I’m not recommending a “flyover” approach in which you rely completely on library functions, prepackaged drivers, sample code, and graphical configuration tools. This is a recipe for trouble, in my opinion, and it diminishes the benefits of using a processing device that provides efficient, direct access to the low-level hardware.
Thus, the goal is to find the proper balance. You need to study your microcontroller’s hardware and understand various aspects of its internal functionality, but when it comes to highly specific details, you don’t want to waste time reinventing the wheel. Your device’s datasheet probably contains a lot of information that has already been incorporated into the API, and much of this information can be skimmed or even ignored.
Conclusion
The title of this article is “How to Read a Microcontroller Datasheet,” though perhaps a more appropriate title would be “How to Not Read a Microcontroller Datasheet.” The fact is, documentation overload is a serious problem with modern microcontrollers, and an essential technique for quickly absorbing the important information is learning to avoid the unnecessary information.
If you have any tips for making the most of microcontroller datasheets, feel free to share your thoughts in the comments section below.
— All About Circuits Technical Articles
#All About Circuits Technical Articles#How to Read a Microcontroller Datasheet: Exploring the Hardwa
0 notes
Text
Global translation inhibition yields condition-dependent de-repression of ribosome biogenesis mRNAs
Abstract
Ribosome biogenesis (RiBi) is an extremely energy intensive process that is critical for gene expression. It is thus highly regulated, including through the tightly coordinated expression of over 200 RiBi genes by positive and negative transcriptional regulators. We investigated RiBi regulation as cells initiated meiosis in budding yeast and noted early transcriptional activation of RiBi genes, followed by their apparent translational repression 1 hour (h) after stimulation to enter meiosis. Surprisingly, in the representative genes examined, measured translational repression depended on their promoters rather than mRNA regions. Further investigation revealed that the signature of this regulation in our data depended on pre-treating cells with the translation inhibitor, cycloheximide (CHX). This treatment, at 1 h in meiosis, but not earlier, rapidly resulted in accumulation of RiBi mRNAs that were not translated. This effect was also seen in with CHX pre-treatment of cells grown in media lacking amino acids. For NSR1, this effect depended on the –150 to –101 region of the promoter, as well as the RiBi transcriptional repressors Dot6 and Tod6. Condition-specific RiBi mRNA accumulation was also seen with translation inhibitors that are dissimilar from CHX, suggesting that this phenomenon might represent a feedback response to global translation inhibition. — Nucleic Acids Research AOP
#Nucleic Acids Research AOP#Global translation inhibition yields condition-dependent de-repression o
0 notes