
All of my thoughts, questions and favorite links from the Squared Online course. I want to be able to look back on this like a class notebook.
Don't wanna be here? Send us removal request.
Statistics
We looked inside some of the posts by rgmdigital and here's what we found interesting.
Average Info
Notes Per Post
2
Likes Per Post
2
Reblog Per Post
0
Reply Per Post
0
Time Between Posts
10 days
Number of Posts By Type
Text
7
Link
3
Photo
3
Quote
2
Video
2
Last Seen Tumblr Blogs


Fun Fact
The total number of visits Tumblr.com received during January 2021 is 327 million.
Text
10 Most Common Questions for an SEO Specialist.
Taken from Orchard. (A Northern recruitment website specialising in marketing roles)
1. What tools do you use to evaluate and manage your SEO campaigns? 2. Tell me about the impact Penguin has had on one of your campaigns?
3. Can you talk me through how you planned a 12 month campaign, what challenges you faced and how you overcame them?
4. Please rate your knowledge of HTML and CSS on a scale from 1 to 10 with 1 being poor and 10 being excellent?
5. What tools do you use to audit a website and what do you use each one for?
6. Can you describe a canonical tab? How would you use it in a campaign? 7. What do you feel is the most important factor in an SEO campaign? 8. What do you feel are the most important factors in SEO going forward?
9. What are your three favourite excel functions when working with a clients data? 10. How did you manage your daily tasks and campaign budgets in your last role?
1 note
·
View note
Link
I just found this, and wanted to make a note of it for the keywords described. There's some Ajax I'm not totally familiar with, but it's useful nonetheless!
1 note
·
View note
Text
Squared: Honest Final Thoughts
So, I started Squared in January, and here we are 6 months down the line. Hopefully(!) I pass, but there are some final thoughts on the course over all:
1. It is all consuming.
Because it's only 6 months, they condense a lot of information into a short amount of time. Your evenings will be taken up by research into content marketing theory, and every time you see a good (or bad) ad, you'll want to share it with someone. Occasionally I would have the lectures playing at 4.30AM in Australia - as that's when they were streamed live.
It's all consuming, I guess.
2. You work internationally.
Actually, this can't be said for all groups. But as one of the few (3) based in APAC at the start of the course, I can say this has helped my working communication & project management skills on an international level. I was working across continents with people in Australia and the UK, co-ordinating our efforts into marketing proposals and insights reports for 6 months. I don't know whether you have tried working as a team without an office internationally, but it's hard! That said, we did it.
3. You develop time management skills like a mother pucker.
Trying to balance freelance work, a degree and a digital marketing course whist attempting some semblance at a social life in a different country was an interesting challenge at times*. My calendar and I now have a special relationship.
*see also: forgoing sleep, forgetting relatives birthdays, strong reliance on caffeine/sugar
4. You meet such a variety of people.
As someone starting out in the industry, I got to meet people I never would have met otherwise, and I guess these are the "connections" they gesture toward in the prospectus. I haven't even graduated yet, so you can imagine what an eye opener this was - I'm 21, and I was often in classes with people trying to "get their heads round social media".
It's really shocking how the marketing industry isn't actually prepared for the digital turnover at all, or the way that it's changed the B2C relationship. This is why we have Squared.
5. It does "translate" into real life.
And this is the most important part for students - we studied this course to enrich our own digital marketing acumen. This week I have a marketing proposal for a job interview (probably not great mentioning that on here!), but I know I'll be able to pull resources from Squared for it.
I can now say I've learned from the best, literally from Google's HQ & with IPA affiliated tutors. How many people can say that?!
6. It's not for everyone.
From the live classes, I've been able to see that not everyone has taken as much as they would have liked from the course, so if you are considering it my best advice would be to research it as much as possible first. Ask previous Squares, ask the tutors, ask your employer.
Heck, even ask me.
Twitter: @theunilass.
0 notes
Text
Module 5: The Ongoing Revolution Reflections
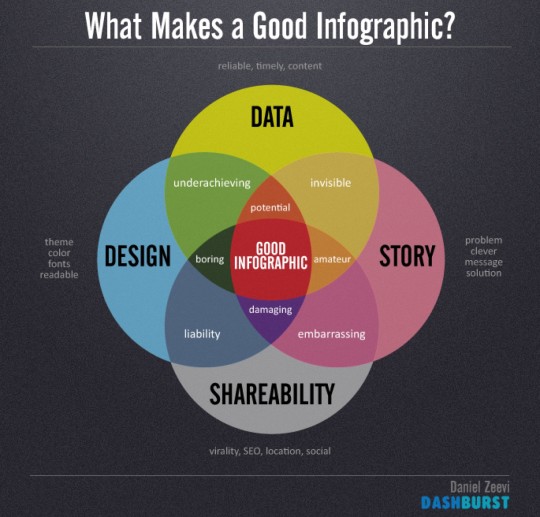
This Module was comprised of two parts, an Ethical Debate & An Infographic.
The ethical debate was separate, and for this task we were given a statement to argue for, or against. Ours was: arguing against the motion of 'Facebook’s Privacy and Data Use Policy is an unnecessary restriction upon its users rights'.
Er, what?
Don't worry, that was our reaction too. We actually had to clarify this with Squared, but our debate was for Facebook's use of our data - and we only realised this just before the deadline. I wasn't present at the time - during this two week period I had finished my degree, travelled to the centre of Australia and moved back to the UK, so I definitely wasn't the best help when it came down to realising all of our docs and data had been arguing for the wrong case.. We thought our argument was against Facebook's use of our privacy policy.
And if I was to do the debate alone, this would still be the stand I would take.
<iframe width="560" height="315" src="//www.youtube.com/embed/yzyafieRcWE" frameborder="0" allowfullscreen></iframe>
That said - I felt like Reggie and Rhoda worked well together here, and put together a good argument for the use of the data policy.
The Assignment:
The assignment here was well linked to our last project regarding data, as it lead straight on into how to present your findings. Harry Thuiller actually discussed Mod 4's work with us, and it was great to see 'behind the scenes' as such - how these findings directly translate into marketing plans. I found this really interesting - just because I have always seen infographics and assumed they were complicated works of art. This assignment dissolved those presumptions, and now I feel confident enough to do one on my own.
0 notes
Text
Top 3 Squared Blogs
These are the 3 blogs I have found myself clicking back to throughout the Squared journey...
Shaf Mansour: http://microbiter.com
Shaf doesn't just talk digital; he occasionally integrates it into other current affairs & topics.
Jacqui Wallis: http://jacquiswallis.wordpress.com
Jacqui regularly posts her reflections on the course - but the reason she's made it in here is for being a regular content curator & sharer on the Google+ groups pages.
Dave Chaffey: http://blog.davechaffey.com
Ok, so Dave isn't a Square...but he's a damn good digital marketer, and I've constantly clicked back to his work for projects. He's responsible for many of the graphics used throughout our Squared lectures (Smart Insights!), and he posts regular updates on his Google+ too.
0 notes
Text
Module 4 Reflections
Just as in mod 3, Module 4 really hit home for me.
I had always clicked through my blogs G analytics, and wondered why on Earth I had readers in Russia. In Circul8, I focused on the social media reach (it didn't heavily involve Google Analytics) and at Time Out I watched their live clicks race across the table when the EDM went out - there I got to see live, raw data, but what did they do with it?
From this... to this.
Well, not much. Certainly not anywhere near as much as the reports we did in the assignment. I was in charge of the Conversion Report, and before the Bytes I had very little idea on what they were..through further research and asking others in the industry, I got to know the ins & out of the Google Analytics Report all together.
Now, I might not be a data journalist, but I certainly felt like this module was a big leg up in becoming one. The visuals are always beautiful, and I actually think we over estimate the amount of work that goes into them (don't shoot me for saying that). After mining data behind the Squared website, I found it easy to see how to turn the data into infographics - I asked my group whether we could do this, to which I got a resounding 'hold your horses! that's module 5'.
The best thing I have taken from this module is the ability to compile one of these reports, as that opens so many more doors for me. As a content writer, it's key to understanding how my audience are engaging with my material. You can effectively see whether their eyes are being drawn elsewhere (thankyou, heatmapping). Maybe it sounds presumptuous, but I believe setting KPIs to do with your bounce rate rather than your revenue might be the way forward for businesses starting out..no? What do you think?
0 notes
Text
Visualising Obesity Stats..
Data is big. But it's definitely not beautiful, unless you have a few handy tools and a data journalist. Since learning about 'data journalism', the Guardian's Data Blog has been a book marked page for me. It represents an extremely effective form of communication, as represented here: http://vizhub.healthdata.org/obesity/
0 notes
Link
Excellent talk by Simon Rogers of the Guardian, who are doing some great work in data journalism and letting their readers participate. Rogers talks about the hidden stories within data and how to tell these stories using visualization.
0 notes
Text
Module 3 Reflections: You Take The Good With The Bad
"Think Like A Brand"
Module 3 focused on all the different experiences consumers undergo prior to making their purchase decision, and how marketers can integrate the customer journey into each of these platforms. The assignment was a great idea, and I felt like I could really get my hands dirty with it.
One of the reasons I wanted to start Squared Online was my YouTube habits - I can easily flick through YouTube videos and watch it for longer than I would TV. The traditional TV ads didn't have any influence on me anymore - I know the most effective advertising I was susceptible to was product placements in my favourite YouTube channels.
Understanding how brands choose to place their products in these videos with select YouTubers allowed me understand how it was part of the bigger picture - the customer journey. Digital has completely changed the traditional methods, we have come from a 'sales funnel' to a circuit.
The different "moments of truth" (Zero Moment of Truth, First Moment of Truth, Second Moment of Truth & Universal Moment of Truth), build this circuit. I have other notes on these within my blog, but back to my original point, it was interesting to see how sponsors are used, and how the material is part of this huge circle - so the shared experiences at the end come back to the social discovery at the beginning.
As well as this, I felt like Sir John Hegarty (Ogilvy) hit the nail on the head with his video - I've felt like this about advertising for ages, and he voiced it very well. We have been given all of these platforms we can facilitate for campaigns, and it's no longer a one way street - we can talk to consumers. There's a conversation going on, which can only lead to better marketing and happier customers.
(I'm also on the graduate job hunt, so that's the other reason I loved listening to it!)
Even though I really felt like I related to the material, the assignment didn't go so well. It was a digital marketing proposal, and our group collaborated really well in regards to illustrating how we could use each platform to talk to our customers. We came up with great ideas and felt like we'd nailed it. However, we failed.
I'm not ashamed to put that on here, because this is meant to be a learning experience. And this certainly proves it. Although we had all the material, we hadn't stuck to the structures outlined in the slides, and our plans were text heavy. We were sent back to redo it, and we passed, but it was pretty hectic - it was due in on the same day my final year University work was due in. I definitely pulled out some hair that week...
Since then, we have been moved into a bigger group. Prior to Mod 4, we had been working as a 3. Other members of the group had pulled out, so we were left alone, whilst other groups worked in larger numbers, 5, 6, 7, 8...and since being moved into this group we have found it easier, just because we have more varied input. That's one of my favourite things about Squared. I'm meeting people in so many different sectors that I'd never get to meet in real life.
Here's to Module 3's results, and our new group. I can't believe we're already at the end of Module 4!
0 notes
Quote
Moore's law is the observation that, over the history of computing hardware, the number of transistors on integrated circuits doubles approximately every two years.
0 notes
Link
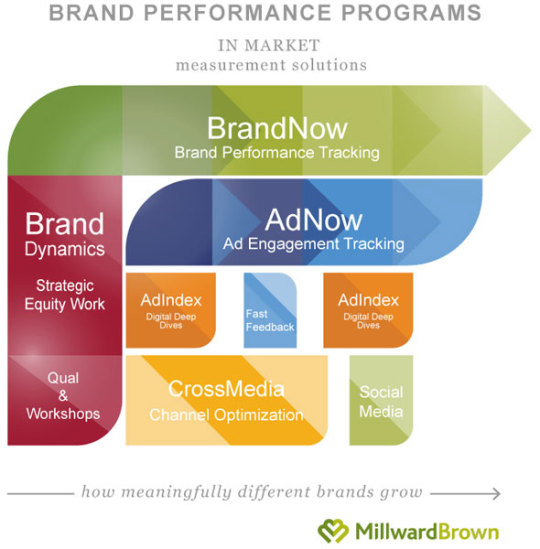
TNS market research develops precise plans that identify growth opportunities for our client to grow their business.
0 notes
Video
youtube
Excellent example of video marketing gone wrong. Why did no one veto this idea? It's a blunt claim that women need to be hairless in order to be deemed attractive or even feminine. Unbelievable.
They have released this statement, claiming it was 'funny and simple'.
Funny, no. But simple, yep. I'm betting a lot of people are calling the US Marketing Team simple right now...
"Hi…this is the Veet marketing team in the US. We just wanted to let everyone know, we get it – we’re women too. This idea came from women who told us that at the first hint of stubble, they felt like “dudes.” It was really simple and funny, we thought. To be honest, the 3 of us could really relate to these real-life moments and they made us laugh. Not everyone appreciated our sense of humor. We know that women define femininity in different ways. Veet helps those who choose to stay smooth. Our intention was never, ever, to offend anyone, so we decided to rethink our campaign and remove those clips. Thank you for letting us know how you feel." - Veet's Facebook Page
0 notes
Quote
"Viral is a thing that happens. Not a thing that is."
Faris Yakob
0 notes
Photo
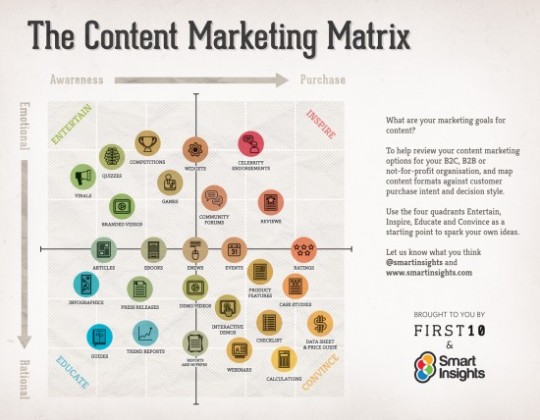
A content marketing matrix showing you how you can facilitate different platforms for your brand. Smart Insights
0 notes
Video
youtube
This video tells the story of storytelling - from the Coca Cola 2020 initiative. It's 20 minutes, but explains content marketing well if you're a little stuck.
0 notes