
Don't wanna be here? Send us removal request.
Statistics
We looked inside some of the posts by subhasbarma-blog and here's what we found interesting.
Average Info
Notes Per Post
18K
Likes Per Post
12K
Reblog Per Post
5K
Reply Per Post
34
Time Between Posts
1 month
Number of Posts By Type
Text
6
Photo
10
Link
1
Last Seen Tumblr Blogs


Fun Fact
Tumblr is available in 18 languages.
Text

Betelgeuse Imagined
Why is Betelgeuse fading? No one knows. Betelgeuse, one of the brightest and most recognized stars in the night sky, is only half as bright as it used to be only five months ago. Such variability is likely just normal behavior for this famously variable supergiant, but the recent dimming has rekindled discussion on how long it may be before Betelgeuse does go supernova. Known for its red color, Betelgeuse is one of the few stars to be resolved by modern telescopes, although only barely. The featured artist's illustration imagines how Betelgeuse might look up close. Betelgeuse is thought to have a complex and tumultuous surface that frequently throws impressive flares. Were it to replace the Sun (not recommended), its surface would extend out near the orbit of Jupiter, while gas plumes would bubble out past Neptune. Since Betelgeuse is about 700 light years away, its eventual supernova will not endanger life on Earth even though its brightness may rival that of a full Moon. Astronomers -- both amateur and professional -- will surely continue to monitor Betelgeuse as this new decade unfolds.
For image credit and copyright guidance, please visit the image website https://apod.nasa.gov/apod/ap200101.html
Time And Space
230 notes
·
View notes
Text
Human Activities Are Drying Out the Amazon: NASA Study
NASA - EOS Aqua Mission logo / EOS - AIRS Mission patch. Nov. 5, 2019 A new NASA study shows that over the last 20 years, the atmosphere above the Amazon rainforest has been drying out, increasing the demand for water and leaving ecosystems vulnerable to fires and drought. It also shows that this increase in dryness is primarily the result of human activities.
The Amazon rainforest. Image Credits: Marcio Isensee e Sa / Adobe Stock
Scientists at NASA’s Jet Propulsion Laboratory in Pasadena, California, analyzed decades of ground and satellite data over the Amazon rainforest to track both how much moisture was in the atmosphere and how much moisture was needed to maintain the rainforest system. “We observed that in the last two decades, there has been a significant increase in dryness in the atmosphere as well as in the atmospheric demand for water above the rainforest,” said JPL’s Armineh Barkhordarian, lead author of the study. “In comparing this trend to data from models that estimate climate variability over thousands of years, we determined that the change in atmospheric aridity is well beyond what would be expected from natural climate variability.”
Image above: The image shows the decline of moisture in the air over the Amazon rainforest, particularly across the south and southeastern Amazon, during the dry season months — August through October — from 1987 to 2016. The measurements are shown in millibars. Image Credits: NASA/JPL-Caltech, NASA Earth Observatory. So if it’s not natural, what’s causing it? Barkhordarian said that elevated greenhouse gas levels are responsible for approximately half of the increased aridity. The rest is the result of ongoing human activity, most significantly, the burning of forests to clear land for agriculture and grazing. The combination of these activities is causing the Amazon’s climate to warm. When a forest burns, it releases particles called aerosols into the atmosphere — among them, black carbon, commonly referred to as soot. While bright-colored or translucent aerosols reflect radiation, darker aerosols absorb it. When the black carbon absorbs heat from the sun, it causes the atmosphere to warm; it can also interfere with cloud formation and, consequently, rainfall. Why It Matters The Amazon is the largest rainforest on Earth. When healthy, it absorbs billions of tons of carbon dioxide (CO2) a year through photosynthesis — the process plants use to convert CO2, energy and water into food. By removing CO2 from the atmosphere, the Amazon helps to keep temperatures down and regulate climate. But it’s a delicate system that’s highly sensitive to drying and warming trends. Trees and plants need water for photosynthesis and to cool themselves down when they get too warm. They pull in water from the soil through their roots and release water vapor through pores on their leaves into the atmosphere, where it cools the air and eventually rises to form clouds. The clouds produce rain that replenishes the water in the soil, allowing the cycle to continue. Rainforests generate as much as 80% of their own rain, especially during the dry season. But when this cycle is disrupted by an increase in dry air, for instance, a new cycle is set into motion — one with significant implications, particularly in the southeastern Amazon, where trees can experience more than four to five months of dry season.
Aqua Satellite. Image Credit: NASA
“It’s a matter of supply and demand. With the increase in temperature and drying of the air above the trees, the trees need to transpire to cool themselves and to add more water vapor into the atmosphere. But the soil doesn’t have extra water for the trees to pull in,” said JPL’s Sassan Saatchi, co-author of the study. “Our study shows that the demand is increasing, the supply is decreasing and if this continues, the forest may no longer be able to sustain itself.” Scientists observed that the most significant and systematic drying of the atmosphere is in the southeast region, where the bulk of deforestation and agricultural expansion is happening. But they also found episodic drying in the northwest Amazon, an area that typically has no dry season. Normally always wet, the northwest has suffered severe droughts over the past two decades, a further indication of the entire forest’s vulnerability to increasing temperatures and dry air. If this trend continues over the long term and the rainforest reaches the point where it can no longer function properly, many of the trees and the species that live within the rainforest ecosystem may not be able to survive. As the trees die, particularly the larger and older ones, they release CO2 into the atmosphere; and the fewer trees there are, the less CO2 the Amazon region would be able to absorb — meaning we’d essentially lose an important element of climate regulation. The study, “A Recent Systematic Increase in Vapor Pressure Deficit Over Tropical South America,” was published in October in Scientific Reports. The science team used data from NASA’s Atmospheric Infrared Sounder (AIRS) instrument aboard the Terra satellite. More information on AIRS can be found here: https://airs.jpl.nasa.gov/ Aqua Satellite: https://www.nasa.gov/mission_pages/aqua/index.html Climate: https://www.nasa.gov/subject/3127/climate Images (mentioned), Text, Credits: NASA/Randal Jackson/JPL/Arielle Samuelson/Written by Esprit Smith, NASA’s Earth Science News team. Greetings, Orbiter.ch Full article
26 notes
·
View notes
Text
Our Eyes in the Sky See Toxic Waters
Warm summer temperatures often lead to dangerous blooms of phytoplankton in lakes, reservoirs and along our coastlines. These toxin-containing aquatic organisms can sicken people and pets, contaminate drinking water, and force closures at boating and swimming sites.

In this image, a severe bloom of toxic blue-green algae is spreading across the western half of Lake Erie. Taken on July 30, 2019 by the Operational Land Imager on our Landsat 8 satellite, this image shows green patches where the bloom was most dense and where toxicity levels were unsafe for recreational activities. Around the time of this image, the bloom covered about 300 square miles of Lake Erie’s surface, roughly the size of New York City. By August 13, the bloom had doubled to more than 620 square miles. That’s eight times the size of Cleveland.

The dominant organism—a Microcystis cyanobacteria—produces the toxin microcystin, can cause liver damage, numbness, dizziness, and vomiting. On July 29, 2019, the National Oceanic Atmospheric Administration (NOAA) reported unsafe toxin concentrations in Lake Erie and have since advised people (and their pets) to stay away from areas where scum is forming on the water surface.
youtube
You can stay informed about harmful algal blooms using a new mobile app that will send you alerts on potentially harmful algal blooms in your area. Called CyAN, it’s based on NASA satellite data of the color changes in lakes and other bodies of water. It serves as our eye-in-the-sky early warning system, alerting the public and local officials to when dangerous waters may be in bloom.
Make sure to follow us on Tumblr for your regular dose of space: http://nasa.tumblr.com.
1K notes
·
View notes
Photo

If you squint hard enough, you can see me waving in all four of these pics 👋 by exoduscv
★☆★ SPACE ★☆★
152 notes
·
View notes
Text
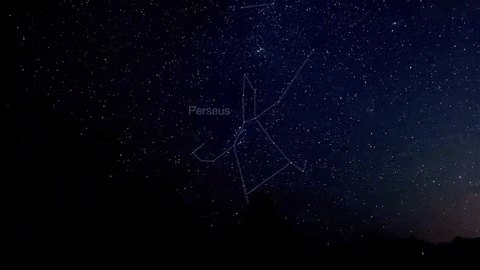
What’s Up For August 2018?
The summer Perseids are here!
The Perseid meteor shower is the best of the year! It peaks on a Moonless summer night from 4 p.m. EST on August 12 until 4 a.m. EST on August 13.
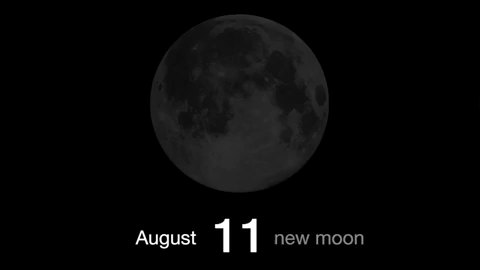
Because the new Moon falls near the peak night, the days before and after the peak will also provide nice, dark skies. Your best window of observation is from a few hours after twilight until dawn, on the days surrounding the peak.
Unlike most meteor showers, which have a short peak of high meteor rates, the Perseids have a very broad peak, as Earth takes more than three weeks to plow through the wide trail of cometary dust from comet Swift-Tuttle.

The Perseids appear to radiate from the constellation Perseus, visible in the northern sky soon after sunset this time of year. Observers in mid-northern latitudes will have the best views.
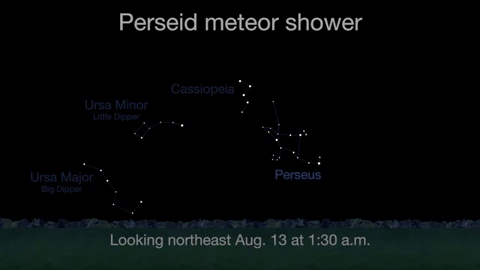
You should be able to see some meteors from July 17 to August 24, with the rates increasing during the weeks before August 12 and decreasing after August 13.
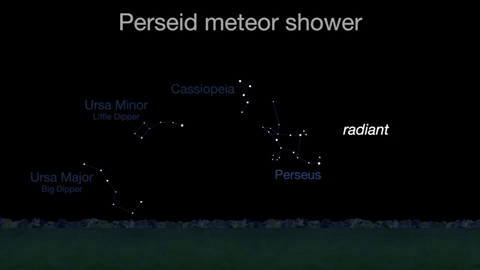
Observers should be able to see between 60 and 70 per hour at the peak. Remember, you don’t have to look directly at the constellation to see them. You can look anywhere you want to-even directly overhead.
Meteor showers like the Perseids are caused by streams of meteoroids hitting Earth’s atmosphere. The particles were once part of their parent comet-or, in some cases, from an asteroid.

The parade of planets Venus, Jupiter, Saturn and Mars–and the Milky Way continue to grace the evening sky, keeping you and the mosquitoes company while you hunt for meteors.

Watch the full What’s Up for August Video:
youtube
There are so many sights to see in the sky. To stay informed, subscribe to our What’s Up video series on Facebook.
Make sure to follow us on Tumblr for your regular dose of space: http://nasa.tumblr.com
5K notes
·
View notes
Text
Solar System 10 Things: Two Years of Juno at Jupiter
Our Juno mission arrived at the King of Planets in July 2016. The intrepid robotic explorer has been revealing Jupiter’s secrets ever since.
Here are 10 historic Juno mission highlights:

1. Arrival at a Colossus
After an odyssey of almost five years and 1.7 billion miles (2.7 billion kilometers), our Juno spacecraft fired its main engine to enter orbit around Jupiter on July 4, 2016. Juno, with its suite of nine science instruments, was the first spacecraft to orbit the giant planet since the Galileo mission in the 1990s. It would be the first mission to make repeated excursions close to the cloud tops, deep inside the planet’s powerful radiation belts.

2. Science, Meet Art
Juno carries a color camera called JunoCam. In a remarkable first for a deep space mission, the Juno team reached out to the general public not only to help plan which pictures JunoCam would take, but also to process and enhance the resulting visual data. The results include some of the most beautiful images in the history of space exploration.

3. A Whole New Jupiter
It didn’t take long for Juno—and the science teams who hungrily consumed the data it sent home—to turn theories about how Jupiter works inside out. Among the early findings: Jupiter’s poles are covered in Earth-sized swirling storms that are densely clustered and rubbing together. Jupiter’s iconic belts and zones were surprising, with the belt near the equator penetrating far beneath the clouds, and the belts and zones at other latitudes seeming to evolve to other structures below the surface.
youtube
4. The Ultimate Classroom
The Goldstone Apple Valley Radio Telescope (GAVRT) project, a collaboration among NASA, JPL and the Lewis Center for Educational Research, lets students do real science with a large radio telescope. GAVRT data includes Jupiter observations relevant to Juno, and Juno scientists collaborate with the students and their teachers.
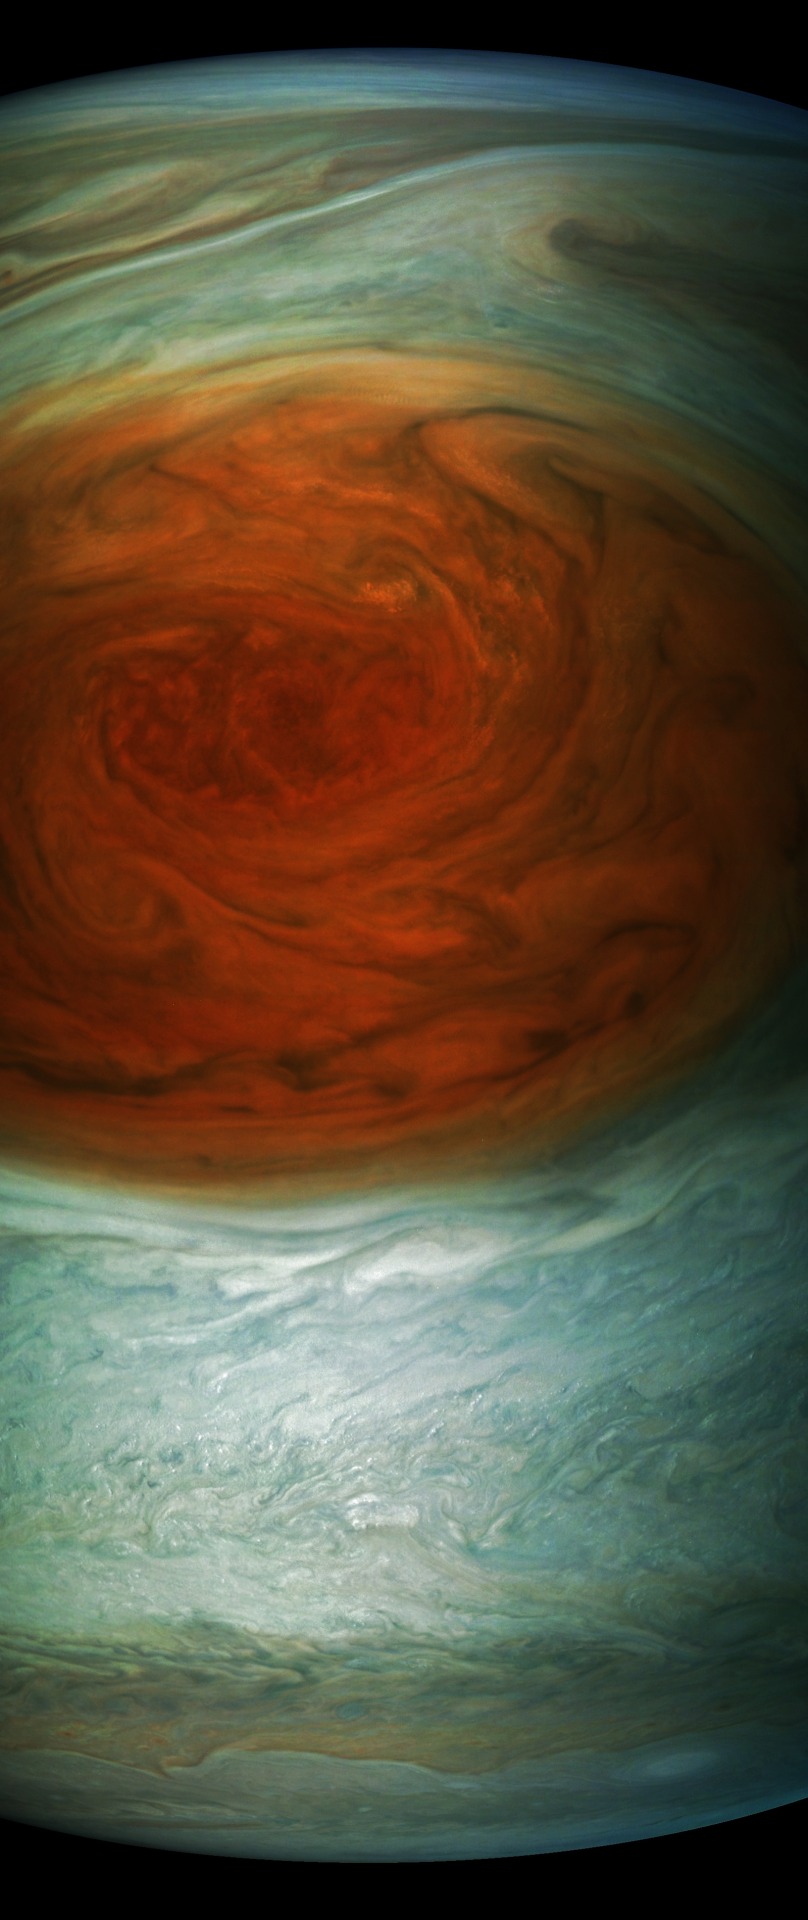
5. Spotting the Spot
Measuring in at 10,159 miles (16,350 kilometers) in width (as of April 3, 2017) Jupiter’s Great Red Spot is 1.3 times as wide as Earth. The storm has been monitored since 1830 and has possibly existed for more than 350 years. In modern times, the Great Red Spot has appeared to be shrinking. In July 2017, Juno passed directly over the spot, and JunoCam images revealed a tangle of dark, veinous clouds weaving their way through a massive crimson oval.
“For hundreds of years scientists have been observing, wondering and theorizing about Jupiter’s Great Red Spot,” said Scott Bolton, Juno principal investigator from the Southwest Research Institute in San Antonio. “Now we have the best pictures ever of this iconic storm. It will take us some time to analyze all the data from not only JunoCam, but Juno’s eight science instruments, to shed some new light on the past, present and future of the Great Red Spot.”
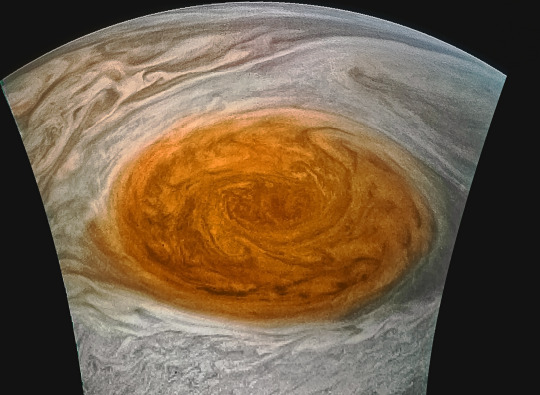
6. Beauty Runs Deep
Data collected by the Juno spacecraft during its first pass over Jupiter’s Great Red Spot in July 2017 indicate that this iconic feature penetrates well below the clouds. The solar system’s most famous storm appears to have roots that penetrate about 200 miles (300 kilometers) into the planet’s atmosphere.
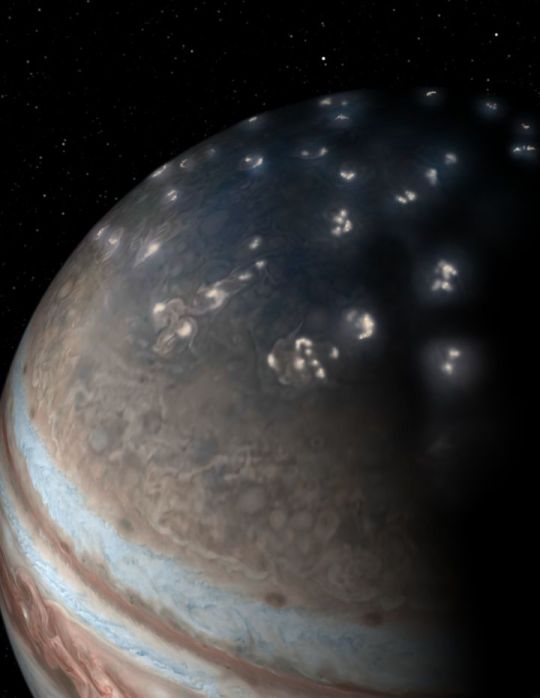
7. Powerful Auroras, Powerful Mysteries
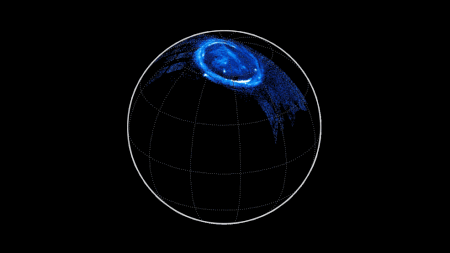
Scientists on the Juno mission observed massive amounts of energy swirling over Jupiter’s polar regions that contribute to the giant planet’s powerful auroras – only not in ways the researchers expected. Examining data collected by the ultraviolet spectrograph and energetic-particle detector instruments aboard Juno, scientists observed signatures of powerful electric potentials, aligned with Jupiter’s magnetic field, that accelerate electrons toward the Jovian atmosphere at energies up to 400,000 electron volts. This is 10 to 30 times higher than the largest such auroral potentials observed at Earth.
Jupiter has the most powerful auroras in the solar system, so the team was not surprised that electric potentials play a role in their generation. What puzzled the researchers is that despite the magnitudes of these potentials at Jupiter, they are observed only sometimes and are not the source of the most intense auroras, as they are at Earth.
youtube
8. Heat from Within
Juno scientists shared a 3D infrared movie depicting densely packed cyclones and anticyclones that permeate the planet’s polar regions, and the first detailed view of a dynamo, or engine, powering the magnetic field for any planet beyond Earth (video above). Juno mission scientists took data collected by the spacecraft’s Jovian InfraRed Auroral Mapper (JIRAM) instrument and generated a 3D fly-around of the Jovian world’s north pole.
Imaging in the infrared part of the spectrum, JIRAM captures light emerging from deep inside Jupiter equally well, night or day. The instrument probes the weather layer down to 30 to 45 miles (50 to 70 kilometers) below Jupiter’s cloud tops.
9. A Highly Charged Atmosphere
Powerful bolts of lightning light up Jupiter’s clouds. In some ways its lightning is just like what we’re used to on Earth. In other ways,it’s very different. For example, most of Earth’s lightning strikes near the equator; on Jupiter, it’s mostly around the poles.
10. Extra Innings
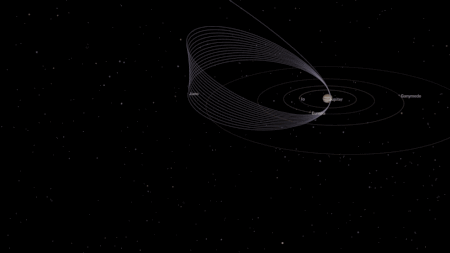
In June, we approved an update to Juno’s science operations until July 2021. This provides for an additional 41 months in orbit around. Juno is in 53-day orbits rather than 14-day orbits as initially planned because of a concern about valves on the spacecraft’s fuel system. This longer orbit means that it will take more time to collect the needed science data, but an independent panel of experts confirmed that Juno is on track to achieve its science objectives and is already returning spectacular results. The spacecraft and all its instruments are healthy and operating nominally.
Read the full web version of this week’s ‘Solar System: 10 Things to Know’ article HERE.
For regular updates, follow NASA Solar System on Twitter and Facebook.
Make sure to follow us on Tumblr for your regular dose of space: http://nasa.tumblr.com
5K notes
·
View notes


Link
0 notes
Text
Earth from Afar
“It suddenly struck me that that tiny pea, pretty and blue, was the Earth. I put up my thumb and shut one eye, and my thumb blotted out the planet Earth. I didn’t feel like a giant. I felt very, very small.” - Neil Armstrong, Apollo 11

This week we’re celebrating Earth Day 2018 with some of our favorite images of Earth from afar…
At 7.2 million Miles…and 4 Billion Miles

Voyager famously captured two unique views of our homeworld from afar. One image, taken in 1977 from a distance of 7.3 million miles (11.7 million kilometers) (above), showed the full Earth and full Moon in a single frame for the first time in history. The second (below), taken in 1990 as part of a “family portrait of our solar system from 4 billion miles (6.4 billion kilometers), shows Earth as a tiny blue speck in a ray of sunlight.” This is the famous “Pale Blue Dot” image immortalized by Carl Sagan.

“This was our willingness to see the Earth as a one-pixel object in a far greater cosmos,” Sagan’s widow, Ann Druyan said of the image. “It’s that humility that science gives us. That weans us from our childhood need to be the center of things. And Voyager gave us that image of the Earth that is so heart tugging because you can’t look at that image and not think of how fragile, how fragile our world is. How much we have in common with everyone with whom we share it; our relationship, our relatedness, to everyone on this tiny pixel.“
A Bright Flashlight in a Dark Sea of Stars

Our Kepler mission captured Earth’s image as it slipped past at a distance of 94 million miles (151 million kilometers). The reflection was so extraordinarily bright that it created a saber-like saturation bleed across the instrument’s sensors, obscuring the neighboring Moon.
Hello and Goodbye

This beautiful shot of Earth as a dot beneath Saturn’s rings was taken in 2013 as thousands of humans on Earth waved at the exact moment the spacecraft pointed its cameras at our home world. Then, in 2017, Cassini caught this final view of Earth between Saturn’s rings as the spacecraft spiraled in for its Grand Finale at Saturn.
‘Simply Stunning’

”The image is simply stunning. The image of the Earth evokes the famous ‘Blue Marble’ image taken by astronaut Harrison Schmitt during Apollo 17…which also showed Africa prominently in the picture.“ -Noah Petro, Deputy Project Scientist for our Lunar Reconnaissance Orbiter mission.
Goodbye—for now—at 19,000 mph

As part of an engineering test, our OSIRIS-REx spacecraft captured this image of Earth and the Moon in January 2018 from a distance of 39.5 million miles (63.6 million kilometers). When the camera acquired the image, the spacecraft was moving away from our home planet at a speed of 19,000 miles per hour (8.5 kilometers per second). Earth is the largest, brightest spot in the center of the image, with the smaller, dimmer Moon appearing to the right. Several constellations are also visible in the surrounding space.
The View from Mars

A human observer with normal vision, standing on Mars, could easily see Earth and the Moon as two distinct, bright "evening stars.”
Moon Photobomb

“This image from the Deep Space Climate Observatory (DSCOVR) satellite captured a unique view of the Moon as it moved in front of the sunlit side of Earth in 2015. It provides a view of the far side of the Moon, which is never directly visible to us here on Earth. “I found this perspective profoundly moving and only through our satellite views could this have been shared.” - Michael Freilich, Director of our Earth Science Division.
Eight Days Out

Eight days after its final encounter with Earth—the second of two gravitational assists from Earth that helped boost the spacecraft to Jupiter—the Galileo spacecraft looked back and captured this remarkable view of our planet and its Moon. The image was taken from a distance of about 3.9 million miles (6.2 million kilometers).
A Slice of Life

Earth from about 393,000 miles (633,000 kilometers) away, as seen by the European Space Agency’s comet-bound Rosetta spacecraft during its third and final swingby of our home planet in 2009.
So Long Earth

The Mercury-bound MESSENGER spacecraft captured several stunning images of Earth during a gravity assist swingby of our home planet on Aug. 2, 2005.
Earth Science: Taking a Closer Look

Our home planet is a beautiful, dynamic place. Our view from Earth orbit sees a planet at change. Check out more images of our beautiful Earth here.
Join Our Earth Day Celebration!
youtube
We pioneer and supports an amazing range of advanced technologies and tools to help scientists and environmental specialists better understand and protect our home planet - from space lasers to virtual reality, small satellites and smartphone apps.
To celebrate Earth Day 2018, April 22, we are highlighting many of these innovative technologies and the amazing applications behind them.
Learn more about our Earth Day plans HERE.
Make sure to follow us on Tumblr for your regular dose of space: http://nasa.tumblr.com
6K notes
·
View notes


Photo

National Geographic - One Strange Rock by Antoine Collignon
via reddit
216 notes
·
View notes
Photo
National Geographic - One Strange Rock by Antoine Collignon
via reddit
216 notes
·
View notes

