#3d scatter plot matplotlib
Explore tagged Tumblr posts
Visit Tumblr Blog
Explore Tumblr blogs with no restrictions, modern design and the best experience.
Last Seen Tumblr Blogs


Fun Fact
The Tumblr office adopted Tommy, an 11-year-old Pomeranian.
Text
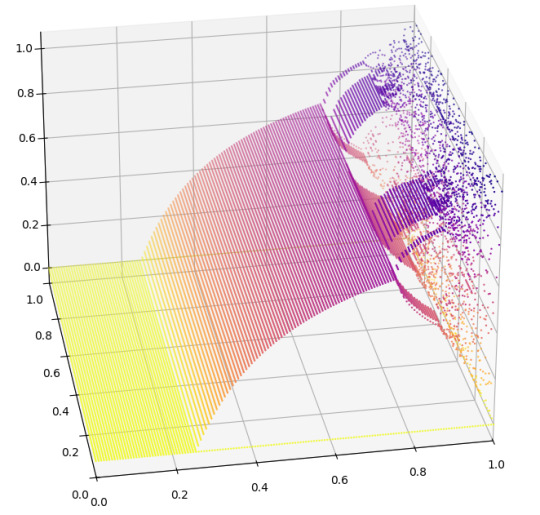
This is a 3D scatter-plot of the bifurcation diagram of the logistic map. Along the two bottom axes you have the parameter r and x_0. The z-axis we have the value of the map after some finite amount of iterations.
All done with python and the matplotlib library.
28 notes
·
View notes
Text
Python Libraries to Learn Before Tackling Data Analysis
To tackle data analysis effectively in Python, it's crucial to become familiar with several libraries that streamline the process of data manipulation, exploration, and visualization. Here's a breakdown of the essential libraries:
1. NumPy
- Purpose: Numerical computing.
- Why Learn It: NumPy provides support for large multi-dimensional arrays and matrices, along with a collection of mathematical functions to operate on these arrays efficiently.
- Key Features:
- Fast array processing.
- Mathematical operations on arrays (e.g., sum, mean, standard deviation).
- Linear algebra operations.
2. Pandas
- Purpose: Data manipulation and analysis.
- Why Learn It: Pandas offers data structures like DataFrames, making it easier to handle and analyze structured data.
- Key Features:
- Reading/writing data from CSV, Excel, SQL databases, and more.
- Handling missing data.
- Powerful group-by operations.
- Data filtering and transformation.
3. Matplotlib
- Purpose: Data visualization.
- Why Learn It: Matplotlib is one of the most widely used plotting libraries in Python, allowing for a wide range of static, animated, and interactive plots.
- Key Features:
- Line plots, bar charts, histograms, scatter plots.
- Customizable charts (labels, colors, legends).
- Integration with Pandas for quick plotting.
4. Seaborn
- Purpose: Statistical data visualization.
- Why Learn It: Built on top of Matplotlib, Seaborn simplifies the creation of attractive and informative statistical graphics.
- Key Features:
- High-level interface for drawing attractive statistical graphics.
- Easier to use for complex visualizations like heatmaps, pair plots, etc.
- Visualizations based on categorical data.
5. SciPy
- Purpose: Scientific and technical computing.
- Why Learn It: SciPy builds on NumPy and provides additional functionality for complex mathematical operations and scientific computing.
- Key Features:
- Optimized algorithms for numerical integration, optimization, and more.
- Statistics, signal processing, and linear algebra modules.
6. Scikit-learn
- Purpose: Machine learning and statistical modeling.
- Why Learn It: Scikit-learn provides simple and efficient tools for data mining, analysis, and machine learning.
- Key Features:
- Classification, regression, and clustering algorithms.
- Dimensionality reduction, model selection, and preprocessing utilities.
7. Statsmodels
- Purpose: Statistical analysis.
- Why Learn It: Statsmodels allows users to explore data, estimate statistical models, and perform tests.
- Key Features:
- Linear regression, logistic regression, time series analysis.
- Statistical tests and models for descriptive statistics.
8. Plotly
- Purpose: Interactive data visualization.
- Why Learn It: Plotly allows for the creation of interactive and web-based visualizations, making it ideal for dashboards and presentations.
- Key Features:
- Interactive plots like scatter, line, bar, and 3D plots.
- Easy integration with web frameworks.
- Dashboards and web applications with Dash.
9. TensorFlow/PyTorch (Optional)
- Purpose: Machine learning and deep learning.
- Why Learn It: If your data analysis involves machine learning, these libraries will help in building, training, and deploying deep learning models.
- Key Features:
- Tensor processing and automatic differentiation.
- Building neural networks.
10. Dask (Optional)
- Purpose: Parallel computing for data analysis.
- Why Learn It: Dask enables scalable data manipulation by parallelizing Pandas operations, making it ideal for big datasets.
- Key Features:
- Works with NumPy, Pandas, and Scikit-learn.
- Handles large data and parallel computations easily.
Focusing on NumPy, Pandas, Matplotlib, and Seaborn will set a strong foundation for basic data analysis.
9 notes
·
View notes
Text
What are the top Python libraries for data science in 2025? Get Best Data Analyst Certification Course by SLA Consultants India
Python's extensive ecosystem of libraries has been instrumental in advancing data science, offering tools for data manipulation, visualization, machine learning, and more. As of 2025, several Python libraries have emerged as top choices for data scientists:
1. NumPy
NumPy remains foundational for numerical computations in Python. It provides support for large, multi-dimensional arrays and matrices, along with a collection of mathematical functions to operate on them. Its efficiency and performance make it indispensable for data analysis tasks. Data Analyst Course in Delhi
2. Pandas
Pandas is essential for data manipulation and analysis. It offers data structures like DataFrames, which allow for efficient handling and analysis of structured data. With tools for reading and writing data between in-memory structures and various formats, Pandas simplifies data preprocessing and cleaning.
3. Matplotlib
For data visualization, Matplotlib is a versatile library that enables the creation of static, animated, and interactive plots. It supports various plot types, including line plots, scatter plots, and histograms, making it a staple for presenting data insights.
4. Seaborn
Built on top of Matplotlib, Seaborn provides a high-level interface for drawing attractive statistical graphics. It simplifies complex visualization tasks and integrates seamlessly with Pandas data structures, enhancing the aesthetic appeal and interpretability of plots. Data Analyst Training Course in Delhi
5. Plotly
Plotly is renowned for creating interactive and web-ready plots. It offers a wide range of chart types, including 3D plots and contour plots, and is particularly useful for dashboards and interactive data applications.
6. Scikit-Learn
Scikit-Learn is a comprehensive library for machine learning, providing simple and efficient tools for data mining and data analysis. It supports various machine learning tasks, including classification, regression, clustering, and dimensionality reduction, and is built on NumPy, SciPy, and Matplotlib. Data Analyst Training Institute in Delhi
7. Dask
Dask is a parallel computing library that scales Python code from multi-core local machines to large distributed clusters. It integrates seamlessly with libraries like NumPy and Pandas, enabling scalable and efficient computation on large datasets.
8. PyMC
PyMC is a probabilistic programming library for Bayesian statistical modeling and probabilistic machine learning. It utilizes advanced Markov chain Monte Carlo and variational fitting algorithms, making it suitable for complex statistical modeling.
9. TensorFlow and PyTorch
Both TensorFlow and PyTorch are leading libraries for deep learning. They offer robust tools for building and training neural networks and have extensive communities supporting their development and application in various domains, from image recognition to natural language processing. Online Data Analyst Course in Delhi
10. NLTK and SpaCy
For natural language processing (NLP), NLTK and SpaCy are prominent libraries. NLTK provides a wide range of tools for text processing, while SpaCy is designed for industrial-strength NLP, offering fast and efficient tools for tasks like tokenization, parsing, and entity recognition.

These libraries collectively empower data scientists to efficiently process, analyze, and visualize data, facilitating the extraction of meaningful insights and the development of predictive models.
Data Analyst Training Course Modules Module 1 - Basic and Advanced Excel With Dashboard and Excel Analytics Module 2 - VBA / Macros - Automation Reporting, User Form and Dashboard Module 3 - SQL and MS Access - Data Manipulation, Queries, Scripts and Server Connection - MIS and Data Analytics Module 4 - MS Power BI | Tableau Both BI & Data Visualization Module 5 - Free Python Data Science | Alteryx/ R Programing Module 6 - Python Data Science and Machine Learning - 100% Free in Offer - by IIT/NIT Alumni Trainer
Regarding the "Best Data Analyst Certification Course by SLA Consultants India," I couldn't find specific information on such a course in the provided search results. For the most accurate and up-to-date details, I recommend visiting SLA Consultants India's official website or contacting them directly to inquire about their data analyst certification offerings. For more details Call: +91-8700575874 or Email: [email protected]
0 notes
Text
How to Build Data Visualizations with Matplotlib, Seaborn, and Plotly

How to Build Data Visualizations with Matplotlib, Seaborn, and Plotly Data visualization is a crucial step in the data analysis process.
It enables us to uncover patterns, understand trends, and communicate insights effectively.
Python offers powerful libraries like Matplotlib, Seaborn, and Plotly that simplify the process of creating visualizations.
In this blog, we’ll explore how to use these libraries to create impactful charts and graphs.
1. Matplotlib:
The Foundation of Visualization in Python Matplotlib is one of the oldest and most widely used libraries for creating static, animated, and interactive visualizations in Python.
While it requires more effort to customize compared to other libraries, its flexibility makes it an indispensable tool.
Key Features: Highly customizable for static plots Extensive support for a variety of chart types Integration with other libraries like Pandas Example: Creating a Simple Line Plot import matplotlib.
import matplotlib.pyplot as plt
# Sample data years = [2010, 2012, 2014, 2016, 2018, 2020] values = [25, 34, 30, 35, 40, 50]
# Creating the plot plt.figure(figsize=(8, 5)) plt.plot(years, values, marker=’o’, linestyle=’-’, color=’b’, label=’Values Over Time’)
# Adding labels and title plt.xlabel(‘Year’) plt.ylabel(‘Value’) plt.title(‘Line Plot Example’) plt.legend() plt.grid(True)
# Show plot plt.show()
2. Seaborn:
Simplifying Statistical Visualization Seaborn is built on top of Matplotlib and provides an easier and more aesthetically pleasing way to create complex visualizations.
It’s ideal for statistical data visualization and integrates seamlessly with Pandas.
Key Features:
Beautiful default styles and color palettes Built-in support for data frames Specialized plots like heatmaps and pair plots
Example:
Creating a Heatmap
import seaborn as sns import numpy as np import pandas as pd
# Sample data np.random.seed(0) data = np.random.rand(10, 12) columns = [f’Month {i+1}’ for i in range(12)] index = [f’Year {i+1}’ for i in range(10)] heatmap_data = pd.DataFrame(data, columns=columns, index=index)
# Creating the heatmap plt.figure(figsize=(12, 8)) sns.heatmap(heatmap_data, annot=True, fmt=”.2f”, cmap=”coolwarm”)
plt.title(‘Heatmap Example’) plt.show()
3. Plotly:
Interactive and Dynamic Visualizations Plotly is a library for creating interactive visualizations that can be shared online or embedded in web applications.
It’s especially popular for dashboards and interactive reports. Key Features: Interactive plots by default Support for 3D and geo-spatial visualizations Integration with web technologies like Dash
Example:
Creating an Interactive Scatter Plot
import plotly.express as px
# Sample data data = { ‘Year’: [2010, 2012, 2014, 2016, 2018, 2020], ‘Value’: [25, 34, 30, 35, 40, 50] }
# Creating a scatter plot df = pd.DataFrame(data) fig = px.scatter(df, x=’Year’, y=’Value’, title=’Interactive Scatter Plot Example’, size=’Value’, color=’Value’)
fig.show()
Conclusion
Matplotlib, Seaborn, and Plotly each have their strengths, and the choice of library depends on the specific requirements of your project.
Matplotlib is best for detailed and static visualizations, Seaborn is ideal for statistical and aesthetically pleasing plots, and Plotly is unmatched in creating interactive visualizations.
0 notes
Text
Visualizing Complex Data with 3D Scatter Plots in Matplotlib
Introduction Visualizing complex data is a crucial step in understanding and communicating insights from large datasets. Three-dimensional scatter plots, in particular, offer a powerful way to visualize relationships between multiple variables and reveal patterns in high-dimensional data. Matplotlib, a popular Python data visualization library, provides an array of tools for creating 3D scatter…
0 notes
Text
How to Visualize 3D Data Distributions in Python with 7 Astonishing Techniques
Introduction
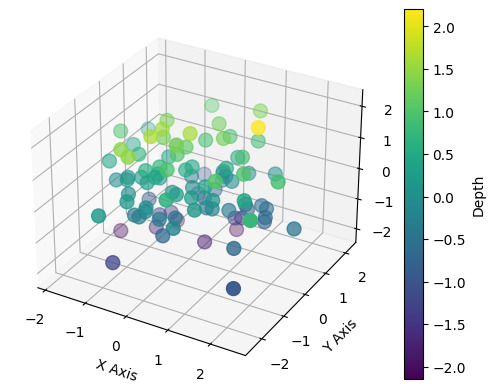
Data visualization is an essential component of data analysis, allowing us to effectively communicate insights and patterns hidden within complex datasets. By visually representing data, we can gain a better understanding of the information at hand and make informed decisions. In addition to traditional 2D data visualization, the use of three-dimensional (3D) visualization techniques has become increasingly popular. 3D data visualization offers a unique perspective, enabling the exploration of data in multiple dimensions and providing a more immersive and intuitive way to interpret information. https://rahularaj.com/what-is-retrieval-augmented-generation-rag/ Overview of Data Visualization and Its Importance Data visualization involves transforming raw data into visual representations such as charts, graphs, and plots. It plays a crucial role in data analysis as it helps us identify trends, patterns, and relationships that might be challenging to comprehend through raw data alone. The importance of data visualization lies in its ability to simplify complex data and present it in a visually appealing and understandable format. By visualizing data, we can: - Gain insights: Visual representations make it easier to identify patterns, outliers, and trends that may not be evident in raw data. - Communicate effectively: Visualizations serve as a means of conveying findings and insights to stakeholders, making it possible to share information in a clear and concise manner. - Make data-driven decisions: Visualizations empower decision-makers by providing a visual context that aids in understanding the implications of data, allowing for informed and strategic decision-making. Introduction to 3D Data Visualization and Its Benefits While 2D visualizations are effective in many cases, they often fall short when representing data with multiple variables or complex relationships. This is where 3D data visualization comes into play. 3D data visualization enables the exploration and representation of data in three dimensions, incorporating depth and perspective into the visualization. This additional dimension allows for a more comprehensive understanding of complex relationships and can reveal hidden patterns and insights. Some benefits of 3D data visualization include: - Enhanced depth perception: By adding depth to the visualization, 3D data visualizations provide a more realistic representation of the data, making it easier to perceive relative distances and relationships between different data points. - Improved spatial understanding: 3D visualizations allow users to view data from different angles and perspectives, facilitating a better understanding of spatial relationships within the dataset. - Increased interactivity: 3D visualizations often offer interactive features that enable users to manipulate the visualization, explore different viewpoints, and gain a more holistic understanding of the data. - Better representation of complex relationships: 3D visualizations can more accurately represent complex relationships between multiple variables, making it easier to analyze and interpret complex datasets. https://rahularaj.com/exploring-pythons-visual-power-10-mind-blowing-heatmap-and-correlation-matrix-examples/ Python provides a range of libraries and tools, such as Matplotlib, Plotly, and Mayavi, that support 3D data visualization. With these libraries, you can create stunning and interactive 3D visualizations to explore and communicate your data effectively. In conclusion, 3D data visualization is a powerful technique that enhances our ability to analyze and interpret complex datasets by providing a more immersive and intuitive representation. By leveraging Python’s capabilities and libraries, you can unlock the full potential of 3D data visualization and gain deeper insights from your data. Technique 1: Scatter Plot in 3D In this section, we will explore the scatter plot function in Python and learn how to create visually appealing and interactive plots in three dimensions. Exploring the Scatter Plot Function in Python Python provides a powerful library called Matplotlib that offers numerous plot types, including scatter plots. Scatter plots are useful for visualizing relationships between multiple variables in a dataset. To create a scatter plot, we can use the scatter() function from the Matplotlib library. This function takes the x, y, and z coordinates of the data points as input and plots them as individual markers on a three-dimensional plane. Using Colors and Sizes to Enhance the Plot One way to enhance a scatter plot is by incorporating colors and sizes to convey additional information about the data points. We can assign different colors to different groups or categories present in the dataset, making it easier to distinguish between them. Similarly, the size of the markers can represent another dimension of the data, such as the magnitude or importance of a variable. In Python, we can achieve this by specifying the c parameter in the scatter() function, which takes an array of colors, and the s parameter, which takes an array of sizes corresponding to each data point. Implementing Interactivity and Tooltips Interactivity adds another layer of engagement and functionality to our scatter plot. With interactivity, users can explore the plot in more detail and obtain additional information about individual data points. Python provides various libraries, such as Plotly and Bokeh, that allow us to create interactive plots. These libraries offer features like tooltips, which display additional information about a data point when the user hovers over it. By integrating interactivity and tooltips into our scatter plot, we can provide users with a richer and more informative visualization experience. To summarize, the scatter plot function in Python is a powerful tool for visualizing data points in three dimensions. By incorporating colors, sizes, interactivity, and tooltips, we can create visually appealing and interactive plots that enhance data exploration and analysis.import matplotlib.pyplot as plt from mpl_toolkits.mplot3d import Axes3D import numpy as np # Generating sample data x = np.random.standard_normal(100) y = np.random.standard_normal(100) z = np.random.standard_normal(100) fig = plt.figure() ax = fig.add_subplot(111, projection='3d') # Creating a scatter plot scatter = ax.scatter(x, y, z, c=z, cmap='viridis', s=100) # Adding color bar and labels fig.colorbar(scatter, ax=ax, label='Depth') ax.set_xlabel('X Axis') ax.set_ylabel('Y Axis') ax.set_zlabel('Z Axis') plt.show()
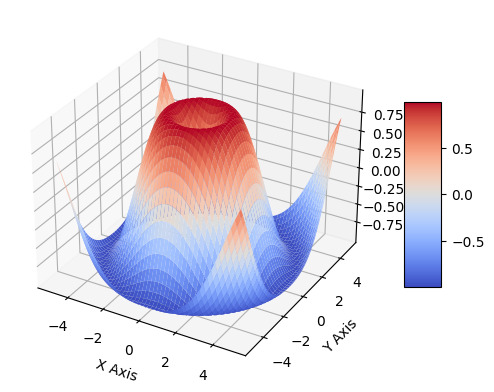
Technique 2: Surface Plotting Surface plotting is a powerful technique for visualizing three-dimensional surfaces using Python. It allows us to explore complex data in a more intuitive and comprehensive manner. Visualizing 3D Surfaces with Python Python provides various libraries that make it easy to visualize 3D surfaces. One popular library is Matplotlib, which offers a wide range of functions and tools for creating high-quality plots. To visualize a 3D surface using Matplotlib, we can use the plot_surface() function. This function takes in three main parameters: the coordinates of the points on the surface, the corresponding values at each point, and an optional colormap for coloring the surface. By representing the X, Y, and Z coordinates of the surface points as arrays, we can create a meshgrid and calculate the corresponding Z values based on a mathematical function or real-world data. We can then pass these arrays to the plot_surface() function to generate the surface plot. Creating Contour Plots for Better Understanding Contour plots are another useful tool for visualizing 3D surfaces. They provide a way to represent the variation of a surface in two dimensions by using contour lines. In Python, we can create contour plots using the contour() or contourf() functions from the Matplotlib library. The contour() function displays contour lines, while the contourf() function fills the areas between the contour lines with colors, which can be specified using a colormap. To create a contour plot, we need to provide the X and Y coordinates of the points on the surface, as well as the corresponding Z values. We can then call the appropriate function and specify the number of contour levels we want to display. Applying Color Maps and Shading Techniques Color maps and shading techniques play a crucial role in enhancing the visual appeal and readability of surface plots. Matplotlib offers a wide range of predefined color maps that can be used to color the surface based on the corresponding values. These color maps can be customized to suit the specific requirements of the plot. Additionally, we can apply shading techniques to the surface plot to further enhance its appearance. One commonly used technique is the use of lighting effects. By simulating the interaction of light with the surface, we can create a more realistic and visually appealing representation. To apply shading techniques, we can use the shade() function in Matplotlib. This function calculates the shading at each point on the surface based on the surface normals and the position of the light source. It then applies the shading to the surface plot, resulting in a more visually appealing output. In conclusion, surface plotting in Python is a powerful technique for visualizing 3D surfaces. By leveraging libraries like Matplotlib, we can create interactive and informative plots that help us better understand complex data.
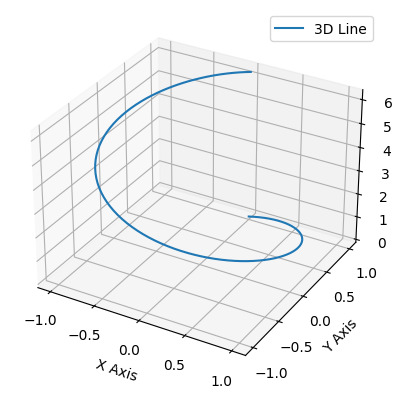
Technique 3: 3D Line Plotting In the realm of data visualization, plotting lines in 3D space is a powerful technique that allows us to represent complex relationships and patterns. With this technique, we can effectively communicate information and insights by visualizing data in three dimensions. Let’s explore some key aspects of 3D line plotting: Introduction to Plotting Lines in 3D Space Plotting lines in 3D space involves representing data points as coordinates in x, y, and z axes. This technique allows us to visualize relationships between three variables simultaneously. By plotting lines, we can observe trends, patterns, and correlations within the data, providing a comprehensive understanding of the information. Visualizing Time-Dependent Data with Animations One of the strengths of 3D line plotting is its ability to visualize time-dependent data. By animating the lines over a specific time range, we can observe how the data changes and evolves over time. This dynamic representation not only enhances understanding but also allows us to identify temporal trends and patterns that may not be evident in static displays. Adding Labels and Annotations to Enhance Clarity To ensure clarity and comprehension, it is crucial to include labels and annotations in our 3D line plots. Labels can represent the different variables or data points, making it easier to interpret the visual information. Annotations, such as arrows or text, can provide additional context or highlight specific observations within the plot. Including clear and concise labels and annotations helps the audience understand the significance of the plotted lines and facilitates effective communication of the insights derived from the data. In summary, 3D line plotting is a valuable technique for visualizing complex relationships in data. By plotting lines in 3D space, we can observe patterns, trends, and correlations within the data and effectively communicate information. Adding labels and annotations enhances clarity, ensuring that the audience can interpret the plot accurately.import matplotlib.pyplot as plt import numpy as np fig = plt.figure() ax = fig.add_subplot(111, projection='3d') # Generate data t = np.linspace(0, 2*np.pi, 100) x = np.sin(t) y = np.cos(t) z = t # Plot a 3D line ax.plot(x, y, z, label='3D Line') ax.legend() ax.set_xlabel('X Axis') ax.set_ylabel('Y Axis') ax.set_zlabel('Z Axis') plt.show()
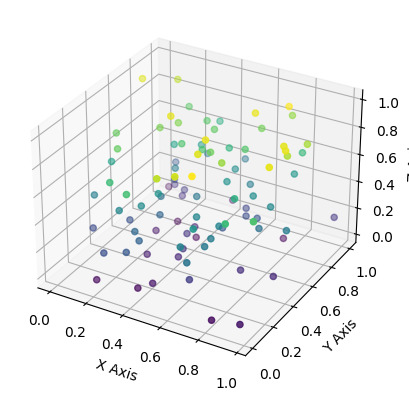
Technique 4: Volumetric Data Visualization Volumetric data visualization is a technique used to represent and visually communicate information contained in three-dimensional datasets. By converting volumetric data into graphical representations, researchers and professionals can gain valuable insights and make informed decisions in various fields, including medicine, engineering, and scientific research. Understanding Volumetric Data and its Applications Volumetric data refers to three-dimensional datasets that contain information about the density, composition, or intensity of a particular variable. This type of data is typically obtained through techniques such as computed tomography (CT) scans, magnetic resonance imaging (MRI), or scientific simulations. Volumetric data finds applications in various domains: - Medical Imaging: Volumetric data from CT or MRI scans can be visualized to assist in the diagnosis and treatment planning of diseases. For example, visualizing volumetric data can help identify abnormalities in organs or tumors. - Scientific Simulations: When simulating complex physical phenomena, such as fluid dynamics or molecular interactions, volumetric data can provide detailed insights into the behavior and properties of the simulated systems. - Engineering and Design: Volumetric data visualization aids engineers and designers in analyzing and optimizing the performance of structures or products. For instance, visualization techniques can be used to examine stress distributions in mechanical components or fluid flow patterns in aerodynamics Using Python Libraries to Render Volumetric Visualizations Python offers several powerful libraries that facilitate the rendering and visualization of volumetric data. Some commonly used libraries include: - Mayavi: Mayavi provides a high-level interface for interactive 3D visualization. It supports the rendering of volumetric data using techniques such as volume rendering, isosurface extraction, and slicing. - PyVista: PyVista is a versatile Python library that enables the creation of interactive 3D visualizations from volumetric data. It offers a wide range of visualization capabilities, including volume rendering, contouring, and slicing. - VisPy: VisPy is a library for high-performance scientific visualization. It provides functionalities for rendering volumetric data using GPU acceleration, allowing for real-time interaction and exploration. These libraries provide a range of customizable options to enhance the visual representation of volumetric data, such as adjusting color maps, applying shading effects, and selecting different rendering techniques.import numpy as np import matplotlib.pyplot as plt from mpl_toolkits.mplot3d import Axes3D # Generate synthetic data data = np.random.rand(100, 3) x, y, z = data, data, data fig = plt.figure() ax = fig.add_subplot(111, projection='3d') # Simple scatter plot to represent volumetric data points ax.scatter(x, y, z, c=z, cmap='viridis') ax.set_xlabel('X Axis') ax.set_ylabel('Y Axis') ax.set_zlabel('Z Axis') plt.show()
Applying Transfer Functions and Opacity Mapping Transfer functions and opacity mapping are fundamental techniques used in volumetric data visualization to control the visual appearance and highlight specific properties of the data. - Transfer Functions: Transfer functions map the raw data values to visual attributes, such as color and transparency. By assigning different colors and opacities to different data values, transfer functions can emphasize certain features or structures present in the volumetric data. - Opacity Mapping: Opacity mapping determines the transparency of the rendered voxels based on their data values. It allows users to control the visibility of specific regions within the volumetric dataset. For example, by adjusting the opacity mapping, one can make certain structures more transparent or completely opaque, depending on their significance. By applying transfer functions and opacity mapping techniques, users can effectively extract meaningful information from volumetric data and highlight specific areas of interest. In conclusion, volumetric data visualization is a powerful technique that enables the exploration and analysis of three-dimensional datasets. By using Python libraries and applying transfer functions and opacity mapping, professionals can create informative and visually appealing renderings that facilitate data interpretation and decision-making in various fields. Technique 5: 3D Bar Plotting In this section, we will explore the technique of creating 3D bar plots using Python. These plots allow us to visualize data in a three-dimensional space, adding an extra dimension to the information being represented. We will cover the process of customizing bar colors, sizes, and orientations in our plots. Additionally, we will learn how to add error bars and confidence intervals to our 3D bar plots. Creating Bar Plots in 3D Space with Python To create 3D bar plots with Python, we can use various libraries such as Matplotlib, Plotly, and Seaborn. These libraries provide functions and tools to generate visually appealing and informative plots. Customizing Bar Colors, Sizes, and Orientations To customize the appearance of our 3D bar plots, we can modify different attributes such as bar colors, sizes, and orientations. For example, using Matplotlib, we can set the color of the bars by specifying a color map or assigning specific colors to each bar. Similarly, we can adjust the size of the bars using the width parameter and control their orientation with the align parameter. Adding Error Bars and Confidence Intervals Error bars and confidence intervals are essential for visualizing the uncertainty associated with our data. They provide a range of values that represent the variability or confidence of our estimated measurements. In 3D bar plots, we can add error bars or confidence intervals by using the appropriate functions provided by the plotting library. These functions allow us to specify the error or confidence values for each bar and visualize them accordingly. By incorporating error bars and confidence intervals into our 3D bar plots, we can provide additional information to our audience, making the plots more informative and reliable. Read the full article
0 notes
Text
Mastering Data Visualization: Matplotlib Tutorial
Are you ready to unlock the potential of data visualization? Welcome to our comprehensive Matplotlib tutorial, your gateway to harnessing Python's powerful plotting library!
Matplotlib is a versatile tool for creating captivating visualizations. Whether you're a beginner or seasoned programmer, this tutorial caters to all skill levels. Starting with the basics, we delve into plotting various types of graphs and charts. Learn to customize colors, labels, and styles, transforming data into visually compelling representations.
Explore the nuances of line plots, scatter plots, histograms, and more. Gain insights into advanced techniques, such as subplots, annotations, and 3D visualizations, amplifying your data storytelling abilities. With Matplotlib's vast capabilities, you'll elevate your data analysis game effortlessly.
Our tutorial provides step-by-step instructions, accompanied by practical examples and tips to simplify complex concepts. Embrace the power of Matplotlib, empowering you to communicate insights effectively.
Ready to embark on this exciting journey of visualizing data? Dive into our Matplotlib tutorial and witness how this library revolutionizes the way you interpret and present data.
For more in-depth guidance and examples, visit: Tutorial and Example.
Begin your data visualization adventure today!
0 notes
Text
Data Analysis and Visualization in Python: A Practical Approach
In the era of big data, extracting meaningful insights from vast datasets has become a cornerstone of decision-making across various industries. Python, with its rich ecosystem of libraries, has emerged as a powerhouse for data analysis and visualization. This blog explores a practical approach to harnessing the power of Python for effective data analysis and visualization.
Why Python for Data Analysis?
Python's popularity in data science stems from its simplicity, readability, and versatility. The language offers a plethora of libraries, such as Pandas, NumPy, and SciPy, which are essential for data manipulation and analysis. Additionally, the integration of Python with powerful visualization tools like Matplotlib and Seaborn makes it a go-to choice for data professionals.
Getting Started with Pandas:
Pandas is a foundational library for data manipulation and analysis. It provides data structures like DataFrames, which are akin to tables, allowing users to easily import, clean, and explore datasets. The blog will delve into basic Pandas functions like reading data, handling missing values, and filtering data.
NumPy for Numerical Operations:
NumPy is the cornerstone for numerical computing in Python programming. Its arrays and functions facilitate mathematical operations with efficiency. This section will cover the basics of NumPy, from array creation to performing essential operations like mean, median, and standard deviation.
Statistical Analysis with SciPy:
SciPy builds on NumPy, offering additional functionality for scientific computing. We will explore statistical methods provided by SciPy, such as hypothesis testing, correlation, and regression analysis, enabling users to derive valuable insights from their datasets.
Data Cleaning and Preprocessing:
Before analysis, data often requires cleaning and preprocessing. This section will guide readers through techniques for handling missing data, dealing with outliers, and transforming variables. Clean and well-preprocessed data is crucial for accurate analysis.
Exploratory Data Analysis (EDA):
EDA is a critical phase in any data analysis project. Python's libraries, particularly Matplotlib and Seaborn, provide powerful tools for creating insightful visualizations. Readers will learn to generate histograms, scatter plots, and box plots to gain a deeper understanding of their data distribution.
Matplotlib for Customizable Visualizations:
Matplotlib is a versatile 2D plotting library that allows users to create a wide range of static, animated, and interactive visualizations. This section will cover the basics of Matplotlib, from simple line charts to complex visualizations, empowering users to tailor their plots to specific requirements.
Seaborn for Stylish Statistical Visualizations:
Seaborn is built on top of Matplotlib and specializes in creating attractive statistical graphics. The blog will demonstrate how to use Seaborn for visualizing relationships in data, creating heatmaps, and enhancing the aesthetics of plots, making the presentation of findings more engaging.
Interactive Visualizations with Plotly:
Plotly is a powerful library for creating interactive visualizations. This section will introduce readers to Plotly's capabilities, including creating interactive line charts, scatter plots, and 3D visualizations. The ability to zoom, pan, and hover over data points enhances the user's exploration of datasets.
Conclusion and Further Learning:
The blog will conclude by emphasizing the importance of data analysis and visualization in making informed decisions. Readers will be encouraged to continue their learning journey through advanced topics such as machine learning integration, geospatial data visualization, and real-time data analysis.
In conclusion, this blog serves as a comprehensive guide for anyone looking to harness the capabilities of Python for data analysis and visualization. By covering essential libraries and techniques, readers can embark on a practical journey to extract meaningful insights from their datasets using the rich ecosystem of Python libraries.
#onlinetraining#technology#automation#career#security#online courses#elearning#learning#programming#startups
0 notes
Text
Data Visualization in Python: Unleashing the Power of Matplotlib, Seaborn, and Bokeh
Data visualization is a vital aspect of data analysis, enabling us to comprehend complex datasets, extract patterns, and communicate insights effectively. In the realm of Python programming, there are several powerful libraries, including Matplotlib, Seaborn, and Bokeh, which offer diverse and intuitive tools to create stunning visual representations of data.
Python training courses provide hands-on practice and guidance to develop coding skills, making learners proficient in Python programming. In this article, we will explore these three libraries and demonstrate how they can be harnessed to enhance the understanding of data.
Read this article: How much is the Python Course Fee in India?
Matplotlib:
Matplotlib is the foundational data visualization library in Python, renowned for its flexibility and versatility. Whether you need to generate simple line plots or intricate 3D visualizations, Matplotlib has got you covered. Let's delve into some of its features:
Basic Line Plot: Creating a basic line plot is as simple as a few lines of code. With Matplotlib, you can customize various aspects of the plot, such as labels, titles, and axes, to make the representation more informative and visually appealing.
Scatter Plot: Scatter plots help visualize the relationship between two variables, identifying potential correlations or clusters. Matplotlib allows you to incorporate colors and sizes to add an extra dimension to the scatter plot. Master Python programming with comprehensive best python courses that cover diverse applications, from web development to data analysis and artificial intelligence.
Bar Plot: Bar plots are ideal for comparing categorical data. Matplotlib lets you generate bar plots with horizontal or vertical bars, and you can adjust the color schemes and annotations to make the visualization more expressive.
Types of plots for Bivariate Analysis in Python
youtube
Seaborn:
Seaborn is built on top of Matplotlib and offers a higher-level interface, making it an excellent choice for creating visually appealing statistical graphics. Some key features of Seaborn include:
Violin Plot: The violin plot is a fusion of a box plot and a kernel density plot, providing a more comprehensive view of the data distribution. Seaborn makes it effortless to create violin plots and compare multiple distributions efficiently.
Pair Plot: Pair plots are instrumental in exploring relationships between multiple variables in a dataset. Seaborn simplifies the process of generating pair plots, accompanied by scatter plots and histograms, enabling rapid insights into data patterns. Validate your Python skills with industry-recognized python certifications, showcasing your ability to code, automate tasks, and create efficient programs.
Heatmap: Heatmaps are beneficial for visualizing correlations in large datasets. Seaborn's heatmap functionality allows you to adjust color maps, add annotations, and effectively display intricate matrices.
HR analytics using Python
youtube
Bokeh:
Unlike Matplotlib and Seaborn, Bokeh is engineered explicitly for creating interactive visualizations for web applications. Its standout feature is the ability to generate interactive plots that can be manipulated and explored by end-users. Key aspects of Bokeh include:
Interactive Line Plot: Bokeh's interactivity shines with line plots. You can create dynamic, interactive visualizations that respond to user interactions, such as zooming and panning, empowering users to delve deeper into the data.
Widgets and Callbacks: Bokeh's real power lies in its ability to integrate widgets and callbacks seamlessly. Sliders, buttons, and dropdowns can be added to plots to create interactive dashboards and data exploration tools. Join a reputable Python Training Institute for Python training, guided by experts, and gain the practical skills needed to tackle complex programming challenges.
Exporting Interactive Visualizations: Bokeh allows easy export of interactive plots to HTML files, facilitating straightforward sharing and embedding in web applications or websites.
Python Programming Language
youtube
END NOTE:
Data visualization is an indispensable tool in any data scientist or analyst's arsenal. In this article, we explored the capabilities of three essential Python libraries for data visualization: Matplotlib, Seaborn, and Bokeh. Matplotlib provides a strong foundation for creating various plots with fine-grained control. Seaborn, building on Matplotlib, simplifies the creation of more advanced statistical graphics.
Bokeh takes interactivity to the next level, enabling users to engage with visualizations dynamically. By leveraging the power of these libraries, Python enthusiasts can unravel the insights hidden within their data and effectively communicate findings to a wider audience. Python course training offer comprehensive learning experiences, covering coding fundamentals and advanced techniques, enabling students to excel in programming. So, why wait? Dive into the world of data visualization and unleash the potential of Matplotlib, Seaborn, and Bokeh to transform your data into captivating visual stories.
0 notes
Text
3D Scatter Plot
How to Sell and Design Custom Sketches
Online money making choices typically require you to have some form of web site, and have some sort of skill in advertising and on-line enterprise to begin with. However, what if I instructed you that there was a technique to generate profits on-line utilizing your existing arts and crafts skills? For those who're involved, read on, as a result of we're going to check out Etsy, and how you can use your current arts and crafts abilities to realize money on-line. What Is Etsy? Etsy, and different websites like it, is a web-based portal that permits members of the positioning to list their original arts and crafts creations on the positioning, add a worth and shipping costs, and promote them to individuals around the globe. It is a little bit like eBay, besides that everything on it's handmade by the people who use the positioning. What Can You Promote On Etsy? Almost anything that's handmade. Individuals promote every little thing from full sized oil paintings handy beaded jewellery, hand knitted baby clothes and handmade candles. From leatherwork to portray, sculpting to sketching, if it's arts and crafts, you may promote it on the positioning. How Do You Make Cash? In contrast to some websites, Etsy does not take a fee off your sale. As a substitute, they permit customers to put up their arts and crafts on the site, in their own 'store' for a small fee per posting. You advertise your products, put a worth on them and embody transport prices, and you get publicity to the 1000's of people that use the site. It is like an internet craft market, with much more visitors! Is It a Good 3D Scatter Plot Concept? You probably have a pastime that you already do, and that you'd wish to become profitable on-line with, then Etsy is a great thought! It can provide you a lot more publicity to much more individuals, and will even lead to you being able to pursue your pastime full time, quite than solely on weekends and at night time! As you'll be able to see, in terms of getting cash online, and on-line business, it's not solely the technically gifted and the enterprise minded that can profit. Everybody, even people who prefer to work with their hands, can earn cash on-line, and either start or expand on an present money making concept. Sketches are nothing however free hand drawings that consists of many overlapping traces. Generally sketches are useful to record something for later use. Sketches will assist artist to increase his imagination power and give him a chance to develop one thing worthwhile within the subject of artwork. Attributable to advanced software, nowadays on-line sketches are also potential. This is very terrific that folks can specific their thoughts by creating sketches utilizing these software tools. Top-of-the-line digital packages for this type of art is Adobe Photoshop. In early days individuals have been utilizing MS paint software program, however it has very less options compared to Adobe Photoshop. You have to have laptop if you wish to create digital sketches. It's a very distinctive technique to create all the sketches amazingly using latest software and hardware on the pc. It also gives a better picture quality then you've ever anticipated. It makes very simple for the artists who needs to create pictures for commercial function like product posters, guide covers, video games and many more. Also the most effective characteristic of digital painting is that you may send it to anybody by way of electronic mail. Let me tell you one thing essential in regards to the adobe photoshop software. This software is the most advanced software program ever researched for portray, pictures and doodles. It offers high quality photographs and provides effective print quality. It is very straightforward to create sketches utilizing adobe photoshop. In case you are going through issue to create sketches utilizing mouse, then you will get digital pads or cordless pen to make it smoother. The cordless pen will act like a mouse and it transfers image on the computer drawn by the artist. From this software program even photographers can develop some special results in their images and may give them an attractive look. This is the superb revolution launched on the planet of painting and sketches. When you have just began attempting at hand on sketching, it's best to learn the valuable suggestions given right here. These will aid you in sketch making. It is best to first perceive that sketching cannot be learnt in a day. It's an artwork. To change into proficient in this field, it is advisable to work onerous and apply quite a bit. The more you follow, the simpler it is going to be to attract. Sketching is a free hand drawing made with pencil on paper. For making good sketches, you must have correct supplies like sketch pencils and paper. The standard of provides can affect the top results. Sketchers maintain pencils in different kinds like tripod grip, overhand grip and underhand grip. Nonetheless, there isn't a best model. You need to choose the type that you are most snug with. You should begin practising with simple figures like straight traces, curves, circles, ellipses, squares and triangles. Although, most individuals suppose that it is simple to draw such figures and they don't have to work exhausting, but it's not so. Many people cannot even draw easy figures with free hand. Mastering simple figures will enable you to to regulate your hand movement, which is step one to drawing a superb sketch. When you turn out to be proficient in drawing geometric figures, it's best to start drawing figures of landscapes, properties, and pets. Gradually transfer to the type of sketches that you just need to draw. For example, if you want to get into style designing, it is best to begin making free hand drawings of mannequins draped in numerous outfits. Equally, if you wish to grow to be a panorama artist, it's best to spend quality time in natural settings capturing its magnificence in your sketchbook. If you wish to become a cartoonist, it is best to draw caricatures of people and scenes. Proportion is a critical part of drawing good sketches. For instance, in case you are making a portrait, it's good to have a correct thought of distance between eyes, measurement of eyes and size of nostril. Even a mere change within the angle of face modifications these proportions. Due to this fact, a sketcher should be able to properly estimate the measurements. While making a sketch, it is best to first focus only on the outline. At all times work on detailing afterwards. Shading helps to offer a three-dimensional look to a drawing. It also helps a person to visualize whether the thing is shut or far away, whether or not it is stationary or moving, what is the texture of the thing, what time of day it is and so forth. Therefore, it is best to pay particular consideration to shading. Learn different styles of texturing. Put money into good quality comfortable pencils of different grades for shading your sketches. Throughout the initial learning course of, do not be too crucial of what you might have sketched. Study out of your mistakes and enhance with each drawing. Final however not the least, get training from an expert. You possibly can join a drawing class or study some expertise and tricks from a non-public tutor. You can too take the help of online drawing tutorials for studying easy methods to sketch. It's no secret that we're going by means of some significantly trying financial instances. Recession, melancholy, double dip recession, regardless of the consultants and analysts are calling it for the time being, instances are difficult and the unemployment price is one of the worst within the historical past of our nation. Whereas one of the things which I do is train folks how you can make cash with developing a website by affiliate internet marketing and advertising, admittedly it takes some time to develop a worthwhile web site which you'll be able to stay off of. Due to this fact at present we will talk about what to do once you're determined and canopy the way to make money on-line quickly. Extra importantly it will only discuss the right way to generate income quick online without cost particularly. Micro Job Sites Offering your companies is kind of possibly the quickest method to generate profits on-line quickly. Micro job websites like Fiverr.com are how a lot of people make a guaranteed fast buck by promoting their companies to interested purchasers. These are web sites which you'll be able to go to and earn money from just about anything which you'll think of. Take your abilities and promote them on these websites and involved clients will contact you about doing your advertised job for them. You receives a commission instantly for doing what you're keen on or have a ability for whether that is writing articles/content material, doing work in Photoshop for someone, doing a drawing or sketch, doing voiceover work; actually anything you can think of. GigHour, Gigbucks, Fittytown pay out at much larger tiers than Fiverr so think about how much whatever you're promoting is price and get to it. I've put together an entire resource on how you can earn money with Fiverr to face out from the crowd, discover clients, and get paid; this data might be utilized to any micro job web site, as well. Craigslist Craigslist is still an incredible place for locating quick one off jobs which pay in addition to full time employment. A number of years ago after I was simply starting in affiliate marketing and didn't know a lot to something about what labored and what did not work and was consequently nonetheless struggling to assist myself, I took to Craigslist and located a couple of jobs which stored me going in the quick term while I bought my footing. One job had me writing descriptions for a whole lot of economic products on an financial website stuffed with affiliate presents (which I did not even notice until later). I used to be paid $one thousand for only a few days of labor. Check out the "And so forth." part, half time section, or search "telecommuting" in your city or any variety of massive cities for gigs which you are able to do from your own dwelling. Just make certain to exercise your due diligence to just remember to're working with a good one that won't stiff you on fee. You must get a contract worked out to determine the parameters of your exchange with your contractual employer when it's a relatively massive sum of money like $1000. There are plenty of free contract sites on the market which you'll grab free documentation from and might easily edit on your functions. eBay eBay is an effective place to earn money online shortly by itemizing and promoting off your potential valuables to involved events for a fast payday. You can also check out what is promoting on eBay then pop in to your local thrift stores and pawn shops to search out these gadgets then resell them on eBay at a better charge for a pleasant profit. On-line Advertising and marketing Okay so I stated in opening that online/internet online affiliate marketing takes time to essentially take off. That doesn't imply that you would be able to't earn money on-line quickly by it, as properly. You will get a site registered for $7.49 with my GoDaddy Dot Com Low cost and hosting for $2.ninety nine a month via my GoDaddy Dot Com Discount, then you may get a website arrange in 10 minutes. Make that website into mini web site to advertise the perfect affiliate product in your area of interest by looking out OfferVault, ClickBank, Fee Junction, PayDotCom, LinkShare, ShareASale, and many others.. Then ship some traffic to that site and make some money in the brief time period whereas growing that mini site right into a content site within the background. You may also get a free weblog on WordPress.com but the issue with that is that it is not yours and also you're really benefiting and developing someone else's enterprise rather than your personal which isn't a good idea. Create Your Own Product Creating your personal product isn't as tough as you'd think. I'll have a complete useful resource devoted to educating methods to create your own online product and promoting it to make some huge cash. Affiliate marketing is one thing, but when you develop your individual product and monitor down your personal associates, that's when the actual money begins to return in and that is how the net entrepreneurs making 7 figures a yr make most of their money. At the very least you can make an info product inside a distinct segment which you may have experience and knowledge in. Individuals like digital merchandise as a result of it is an immediate obtain and informational products have traditionally all the time offered very effectively online, therefore the popularity of Clickbank. Get Artistic Go to your native mom and pop stores and ask them if they've a website for their enterprise and if not then offer to construct them a web site for a few hundred dollars. If the reply is no then start the haggling recreation. As I present in my movies on easy methods to set up a web site free of charge step-by-step once more and methods to use WordPress, you can set up a totally practical and attractive website in 10 minutes with no need any expertise. The point is to be inventive. There are lots of providers which you'll be able to supply which appear out of your reach however are easy to execute and there are lots of people who find themselves either lazy or daunted at something like the idea of establishing a web site. A creative thoughts plus advertising and marketing equals success in this case. When You're Determined Bear in mind When you're actually up towards the wall, be sure to contact agency like the Salvation Army, meals banks, or metropolis human service departments to ensure that you keep the lights on and meals on the table.
#3D Scatter Plot#3d scatter plot online#3d scatter plot matplotlib#3d scatter plot r#3d scatter plot excel#plotly 3d scatter r#plotly 3d scatter python#plotly 3d surface#plotly 3d surface r
0 notes
Text
Data Visualization with Python: Why you should learn

The act of transforming raw data into a graphical representation that is simple to understand and analyze is known as data Visualization. It is an essential tool for data analysis and can make it easier to spot patterns, trends, and outliers in data that might otherwise be hard to find. In this article, we'll go through the benefits of learning Python for data Visualization and how it can advance your career.
Visualization of Data: Its Importance
Making sense of huge, complex datasets requires the use of data Visualization. It makes it possible for you to swiftly spot patterns and trends in data that might otherwise be challenging to find. A line chart, for example, could be used to depict the trend in sales over time if you were studying sales data. This would make it simple for you to spot any patterns or trends in the data, like an increase in sales during a specific month.
The dissemination of data insights to others is aided by data Visualization. It is simple to show data in a form that is understandable and easy to interpret using graphs and charts. When engaging with stakeholders that might not have a strong technical background, this is very crucial. They will be able to comprehend the insights and make wise decisions if the data is presented in a visual way.
The Benefits of Learning Data Visualization with Python
Powerful programming languages like Python are frequently used for data analysis and Visualization. Python offers a large selection of libraries and frameworks, which is one of its key advantages for data Visualization. With little effort, these libraries make it simple to produce high-quality Visualizations. The most well-known Python data Visualization libraries are Matplotlib, Seaborn, and Plotly. In contrast to Seaborn, which is developed on top of Matplotlib and offers a more sophisticated set of Visualization features, Matplotlib is a commonly used toolkit for producing static plots and charts. Plotly is a library that makes it simple to embed interactive Visualizations into web pages. The fact that Python is a flexible language that can be applied to a variety of tasks is another advantage of utilizing it for Data Visualization. Along with data Visualization, it can be used for data cleansing, data manipulation, and machine learning. This makes utilizing a single language for all of the tasks involved in data analysis more effective than using several different languages. Additionally, Python has a sizable and vibrant community that offers assistance and materials for the language's study and application. Through forums and online guides, this community offers assistance and support while also helping to develop libraries and frameworks. Python Data Visualization Library MatplotlibThe most popular Python data Visualization library is Matplotlib. It offers a variety of tools, like as line plots, scatter plots, bar charts, and histograms, for making static plots and charts. You may easily alter the look of your plots and charts in the library to fit your requirements. SeabornOn top of Matplotlib, the Seaborn library offers a more sophisticated set of Visualization capabilities. It offers a number of built-in functions for making plots including heatmaps, violin plots, and box plots, and is especially useful for visualizing statistical data. Additionally, Seaborn offers a variety of pre-installed themes that you may apply to alter the way your plots look. PlotlyPlotly is a library that makes it simple to embed interactive Visualizations into web pages. Bar charts, scatter plots, line plots, and heatmaps are just a few of the numerous tools the library offers for making plots and charts. Making dynamic Visualizations that are simple to share and watch online is one of the key advantages of utilizing Plotly. As a result, it's a fantastic choice for making dashboards and Visualizations that are accessible to many users. Plotly also supports 3D Visualizations, enabling the creation of more interactive and captivating Visualizations. The use of Python for data Visualization also makes it simple to integrate it with other programs and applications. Utilizing a tool like Matplotlib or Seaborn, for instance, you may use Python to clean and edit data before using it to produce Visualizations. In addition, Jupyter Notebooks, a well-liked tool for data analysis and Visualization, allows you to utilize Python to build Visualizations.
Enroll in the Expert-Led Python Data Visualization Course at SkillUp Online to Unlock the Power of Data Visualization
The
Data Visualization with Python course
offered by SkillUp Online is a fantastic method to get the knowledge required to produce Python visuals of the highest caliber. The course is intended for people new to data Visualization and those with little to no prior expertise. Along with the most widely used libraries for data Visualization, including Matplotlib, Seaborn, and Plotly, it covers the fundamentals of Python programming. Experts in data Visualization who have years of expertise teaching the course will walk you through the creation of visuals step by step. You will discover how to import and purify data, make plots and charts, and alter the look of your Visualizations. The course also covers building Visualizations in Jupyter Notebooks and utilizing Plotly for interactive Visualizations. The fact that the Data Visualization with Python course from SkillUp Online is self-paced and can be finished on your own time is one of its key advantages. Furthermore, you will be able to apply what you have learned to actual situations thanks to the course's practical exercises and projects. You'll have a chance to hone your abilities and make your own visions thanks to this.
Conclusion
Data visualization is an essential tool for data analysis, and Python is a powerful language that is well-suited for creating visualizations. By learning data visualization with Python, you will be able to create high-quality visualizations with minimal effort and gain a valuable skill that can benefit your career. With the wide range of libraries available, you can create a variety of different visualizations, whether it be interactive or static, 2D or 3D. Furthermore, the large and active Python community provides support and resources that make it easy to learn and use the language. So, if you haven't already, start learning data visualization with Python today!
Source: https://penzu.com/p/f479be31
0 notes
Text
Animate scatter plot matplotlib

ANIMATE SCATTER PLOT MATPLOTLIB HOW TO
ANIMATE SCATTER PLOT MATPLOTLIB UPDATE
ANIMATE SCATTER PLOT MATPLOTLIB SERIES
By updating the data to plot and using set_3d_properties, you can animate the 3D scatter plot.
ANIMATE SCATTER PLOT MATPLOTLIB HOW TO
This page shows how to generate 3D animation of scatter plot using animation.FuncAnimation, python, and matplotlib.pyplot. # plot_time_series.py plt.plot_date (dates, y, linestyle = ‘solid’ ) How to generate a 3D scatter plot in Python? If we want to create a line plot instead of the scatter plot, we will have to set linestyle=’solid’ in plt.plot_date ().
ANIMATE SCATTER PLOT MATPLOTLIB SERIES
How to create a line plot in Matplotlib?Ĭreating a line plot from time series data in Python Matplotlib. In addition to the above described arguments, this function can take a data keyword argument. The exception is c, which will be flattened only if its size matches the size of x and y. How does the Scatter function in Matplotlib work?įundamentally, scatter works with 1D arrays x, y, s, and c may be input as N-D arrays, but within scatter they will be flattened. For details, see the corresponding parameter in plot. If xdate or ydate is True, the respective values x or y are interpreted as Matplotlib dates. The parameters of _date () are shown in the table below:- The coordinates of the data points. set_offsets expects a Nx2 ndarray and you provide a tuple of two 1d arrays. Any suggestions on how to correctly animate a scatter plot using the animation package? The only problem with your example is how you fill the new coordinates in the animate function. The animated plot also flashes several dots during each frame of animation. How to correctly animate a scatter plot using the animation package? In this article we’ll demonstrate that using a few examples. The data values will be put on the vertical (y) axis. Matplotlib supports plots with time on the horizontal (x) axis. Is there a way to plot time in Matplotlib? The plotted graphs when added with animations gives a more powerful visualization and helps the presenter to catch a larger number of audience. It can also be used as an animation tool too. Matplotlib library of Python is a plotting tool used to plot graphs of functions or figures. – ImportanceOfBeingErnest Nov 24 ’18 at 23:34 How is Matplotlib used as an animation tool? Only use this if performance is not critical for you. Since this uses ArtistAnimation, it will create 100 scatter plots in memory, which is rather inefficient. This method of making animations used 4.2 MiB of memory in sum. How much memory does it take to animate a scatter plot?Ĭreating 100 plots used 1.9 MiB. Today we’ll see how to use Mapbox with Plotly within a dash application, and how to create animated scatter maps. To tackle that weakness, Plotly made a partnership with Mapbox. Plotly has some basic built-in maps plots: enough to show data, but not as nice as 2020 web maps should be. How to create Outstanding Animated scatter maps with Plotly? In this case, we need not clear every figure as a scatter plot generally represents a distinct point in the plane and the points have very little chance of overlapping.
ANIMATE SCATTER PLOT MATPLOTLIB UPDATE
However, to make a real-time scatter, we can just update the values of x and y and add scatter points in each iteration. Can you make a scatter plot in real time? That is our goal today: Animate a scatter plot in 3D with Matplotlib. Furthermore, an animation module also allows for dynamical plotting. It was originally developed for 2D plots, but was later improved to allow for 3D plotting.
14 What are the types of scatter plots?Ĭan You animate a 3D scatterplot with Matplotlib?.
13 What is an example of a scatter plot?.
12 What is a 3 dimensional scatter plot?.
11 Is there a 3D function for px.scatter?.
10 Why do you need Animation function in Matplotlib?.
9 How to create an animated line / scatter plot?.
8 How to generate a 3D scatter plot in Python?.
7 How to create a line plot in Matplotlib?.
6 How to plot a time series in Matplotlib?.
5 How to correctly animate a scatter plot using the animation package?.
4 How is Matplotlib used as an animation tool?.
3 How much memory does it take to animate a scatter plot?.
2 Can you make a scatter plot in real time?.
1 Can You animate a 3D scatterplot with Matplotlib?.
0 notes
Text
Best Libraries and Platforms for Data Visualization

Image credit: unslpash.com
In one of our previous posts we discussed data visualization and the techniques used both in regular projects and in Big Data analysis.
However, knowing the plot does not let you go beyond theoretical understanding of what toll to apply for certain data. With the abundance of techniques, the data visualization world can overwhelm the newcomer. Here we have collected some best data visualization libraries and platforms.
Data visualization libraries
Though all of the most popular languages in Data Science have built-in functions to create standard plots, building a custom plot usually requires more efforts. To address the necessity to plot versatile formats and types of data. Some of the most effective libraries for popular Data Science languages include the following:
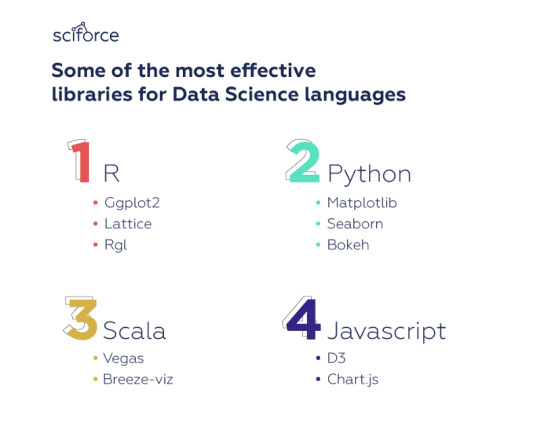
R
The R language provides numerous opportunities for data visualization — and around 12,500 packages in the CRAN repository of R packages. This means there are packages for practically any data visualization task regardless the discipline. However, if we choose several that suit most of the task, we’d select the following:
ggplot2
ggplot2 is based on The Grammar of Graphics, a system for understanding graphics as composed of various layers that together create a complete plot. Its powerful model of graphics simplifies building complex multi-layered graphics. Besides, the flexibility it offers allows you, for example, to start building your plot with axes, then add points, then a line, a confidence interval, and so on.
ggplot2 is slower than base R and rather difficult to master, it pays huge dividends for any data scientist working in R.
Lattice
Lattice is a system of plotting inspired by Trellis graphics. It helps visualize multi-variate data, creating tiled panels of plots to compare different values or subgroups of a given variable. Lattice is built using the grid package for its underlying implementation and it inherits many grid’s features. Therefore, the logic of Lattice should feel familiar to many R users making it easier to work with.
RGL
rgl package is used to create interactive 3D plots. Like Lattice, it’s inspired by the grid package, though it’s not compatible with it. RGL features a variety of 3D shapes to choose from, lighting effects, various “materials” for the objects, as well as the ability to make an animation.
Python
The Python Package Index has libraries for practically every data visualization need, however, the most popular ones offering the broadest range of functionalities are the following:
Matplotlib
Matplotlib is the first Python data visualization and the most widely-used library for generating simple and powerful visualizations in the Python community. The library allows building a wide range of graphs from histograms to heat plots to line plots. Matplotlib is the basis for many other libraries that are designed to work in conjunction with analysis. For instance, libraries like pandas and matplotlib are “wrappers” over Matplotlib allowing access to a number of Matplotlib’s methods with less code.
Seaborn
An example of a popular library, built on top of Matplotlib, is Seaborn. Seaborn’s default styles and color palettes are much more sophisticated than Matplotlib. Beyond that, Seaborn is a higher-level library, so it is easier to generate certain kinds of plots, including heat maps, time series, and violin plots.
Bokeh
Similar to the ggplot library for R, Bokeh is based on The Grammar of Graphics. It supports streaming, and real-time data. Unlike the majority of other data visualization libraries, Bokeh can create interactive, web-ready plots, which can easily output as JSON objects, HTML documents, or interactive web applications. Bokeh has three interfaces with varying degrees of control to accommodate different types of users from users wishing to create simple charts quickly to developers and engineers who wish to define every element of the chart.
Scala
Python and R remain the leading languages for rapid data analysis, however, Scala is becoming the key language in the development of functional products that work with big data, as the latter need stability, flexibility, high speed, scalability, etc
Vegas
Probably, the most functional Scala library for data visualization, Vegas allows plotting specifications such as filtering, transformations, and aggregations. It is similar in structure to Python’s Bokeh and Plotly. Vegas provides declarative visualization, so that the user can focus on specifying what needs to be done with the data, without having to worry about the code implementation.
Breeze-viz
Breeze-viz is based on the prominent Java charting library JFreeChart and has a MATLAB-like syntax. Although Breeze-viz has much fewer opportunities than MATLAB, matplotlib in Python, or R, it is still quite helpful in the process of developing and establishing new models.
Javascript
Javascript may not be among languages adopted for Data Science, but it offers vast opportunities for data visualization, and many libraries for other languages are actually wrappers for JS packages.
D3.js
D3 is called the mother of all visualization libraries, since it is the basis for many libraries. Being the oldest library, it remains the most popular and extensive Javascript data visualization library. It uses web standards and is framework agnostic, working smoothly with any Javascript framework. D3 is built for manipulating documents based on data and bring data to life using HTML, SVG, and CSS. D3’s emphasis on web standards gives you the capabilities of modern browsers without coupling to a proprietary framework, combining visualization components and a data-driven approach to DOM manipulation.
Chart.js
Chart.js is a lightweight library that has fully responsive charts including Bar, Bubble, Doughnut, Line, PolarArea, Radar, Scatter. This is an open-source library based on HTML5. V.2 provides mixed chart-types, new chart axis types, and beautiful animations. Designs are simple and elegant with 8 basic chart types, and you can combine the library with moment.js for time axis.
Online platforms for Data Visualization
At a certain time, especially at the beginning of a project, it is important to generate a lot of charts quickly, in order to explore the scope, depth and the texture of the data and find interesting stories to develop further. There are quite a lot of online platforms to generate data visualization.
Plotly
Plotly as an online platform for data visualization, that is, among all can be accessed from an R or Python Notebook. Plotly is an advanced, online data visualization program with a colorful design. Its forte is making interactive plots, but it offers some charts you won’t find in most packages, like contour plots, candlestick charts, and 3D charts. You can use the chart studio to create web-based reporting templates. You can also modify your own dashboards and interactive graphs for your collaborators to comprehend better.
Tableau
Tableau is a business intelligence system that has a new approach to data analysis. Tableau lets you create charts, graphs, maps and many other graphics. A big advantage of Tableau is availability of several versions: desktop, server, and a cloud one. You can create and publish dashboards, share them with colleagues, and analyze using different methods. We recommend it because of its simplified drag-and-drop system, all day technical support, and flexible package fees.
Of course, it is just a small fraction of all platforms, tools and libraries available for you to visualize your data in the most effective and transparent way. The data itself, as well as the project goals — be it scientific analysis, business intelligence or creating a website that should incorporate some charts — will prompt you the approach, or, most usually a combination of approaches from quick online plotting to base functions and specialized packages.
0 notes
Link
Python 3 Data Visualization Recipes ##UdemyFrancais ##UdemyFreeDiscountCoupons #Data #Python #Recipes #Visualization Python 3 Data Visualization Recipes Become a Master in Data Visualization with Python 3 and acquire employers' one of the most requested skills of 21st Century! A great data visualization engineer earns more than $150000 per year! This is the most comprehensive, yet straight-forward course for the Data Visualization with Python 3 on Udemy! Whether you have never worked with Data Visualization before, already know basics of Python, or want to learn the advanced features of matplotlib and NumPy with Python 3, this course is for you! In this course we will teach you Data Visualization with Python 3, Jupyter, NumPy, and Matplotlib. (Note, we also provide you PDFs and Jupyter Notebooks in case you need them) With over 40 lectures and more than 4 hours of video this comprehensive course leaves no stone unturned in teaching you Data Visualization with Python 3! This course will teach you Data Visualization in a very practical manner, with every lecture comes a full programming video and a corresponding Jupyter notebook that has Python 3 code! Learn in whatever manner is the best for you! We will start by helping you get Python3, NumPy, matplotlib, and Jupyter installed on your Windows computer and Raspberry Pi. We cover a wide variety of topics, including: Basics of Scientific Python Ecosystem Basics of Digital Image Processing Basics of NumPy and Matplotlib Installation of Python 3 on Windows Setting up Raspberry Pi Tour of Python 3 environment on Raspberry Pi Jupyter installation and basics NumPy Ndarrays Array Creation Routines Basic Visualization with Matplotlib Ndarray Manipulation Random Array Generation Bitwise Operations Statistical Functions Plotting with Matplotlib Other types of visualizations (bar, histograms, scatter, and bubble) Contours 3D Visualizations (plot, mesh, and surfaces) Advanced Concepts in Matplotlib and much more..... You will get lifetime access to over 40 lectures plus corresponding PDFs, Image Datasets, and the Jupyter notebooks for the lectures! This course comes with a 30 day money back guarantee! If you are not satisfied in any way, you'll get your money back. So what are you waiting for? Learn Data Visualization with Python 3 in a way that will advance your career and increase your knowledge, all in a fun and practical way! Who this course is for: Data Scientists, Data Analysts, and Data Engineers Mathematicians, Statisticians, Scientists, and Engineers Image Processing and Computer Vision Professionals Machine Learning and AI Professionals Bioinformatics and Biostatistics professionals Programmers and Developers Students, Job seekers, anyone wanting to learn new stuff 👉 Activate Udemy Coupon 👈 Free Tutorials Udemy Review Real Discount Udemy Free Courses Udemy Coupon Udemy Francais Coupon Udemy gratuit Coursera and Edx ELearningFree Course Free Online Training Udemy Udemy Free Coupons Udemy Free Discount Coupons Udemy Online Course Udemy Online Training 100% FREE Udemy Discount Coupons https://www.couponudemy.com/blog/python-3-data-visualization-recipes/
0 notes
Text
How to Offer and Plan Custom Sketches
Online cash settling on decisions commonly expect you to have some type of site, and have a type of expertise in promoting and on-line undertaking in any case. Notwithstanding, imagine a scenario where I educated you that there was a method to create benefits on-line using your current expressions and specialties abilities. For those who're included, perused on, because of we will look at Etsy, and how you can utilize your present expressions and artworks capacities to acknowledge cash on-line. What Is Etsy? Etsy, and diverse sites like it, is an electronic entrance that licenses individuals from the situating to list their unique expressions and specialties manifestations on the situating, include a value and dispatching costs, and elevate them to people far and wide. It is somewhat similar to eBay, other than that everything on it's carefully assembled by the general population who utilize the positioning. What Would you be able to Advance On Etsy? Almost anything that is handcrafted. People advance each seemingly insignificant detail from full estimated oil artistic creations convenient beaded gems, hand sewed infant garments and carefully assembled candles. From leatherwork to depict, chiseling to portraying, if it's specialties and artworks, you may advance it on the positioning. How Do You Make Cash? In difference to a few sites, Etsy does not take an expense off your deal. As a substitute, they allow clients to set up their specialties and artworks on the site, in their own 'store' for a little expense for each posting. You promote your items, put a value on them and encapsulate transport costs, and you get attention to the 1000's of individuals that utilization the site. It resembles a web make advertise, with considerably more visitors! Is It a Decent 3D Disseminate Plot Concept? You most likely have an interest that you as of now do, and that you'd wish to end up plainly productive on-line with, at that point Etsy is an incredible idea! It can give you significantly greater attention to substantially more people, and will even prompt you having the capacity to seek after your hobby full time, very than exclusively on ends of the week and during the evening time! As you'll have the capacity to see, as far as getting money on the web, and on-line business, it's not exclusively the actually skilled and the undertaking disapproved of that can benefit. Everyone, even individuals who like to work with their hands, can gain money on-line, and either begin or develop a present cash making concept. Sketches are nothing however free hand illustrations that comprises of numerous covering follows. For the most part portrays are valuable to record something for later utilize. Representations will help craftsman to build his creative ability power and allow him to create one thing advantageous inside the subject of work of art. Owing to cutting edge programming, these days on-line outlines are additionally potential. This is extremely staggering that people would specific be able to their considerations by making portrays using these product tools. Top-of-the-line computerized bundles for this sort of craftsmanship is Adobe Photoshop. In early days people have been using MS paint programming program, be that as it may it has less choices contrasted with Adobe Photoshop. You need to have PC in the event that you wish to make advanced representations. It's an exceptionally unmistakable method to make all the portrayals incredibly utilizing most recent programming and equipment on the pc. It likewise gives a superior picture quality at that point you've ever foreseen. It makes exceptionally basic for the craftsmen who needs to make pictures for business work like item publications, control covers, computer games and some more. Likewise the best normal for advanced painting is that you may send it to anyone by method for electronic mail. Oh my goodness one thing fundamental with respect to the adobe photoshop programming. This product is the most progressive programming program at any point investigated for depict, pictures and doodles. It offers excellent photos and gives successful print quality. It is extremely clear to make outlines using adobe photoshop. In the event that you are experiencing issue to make draws using mouse, at that point you will get advanced cushions or cordless pen to make it smoother. The cordless pen will act like a mouse and it exchanges picture on the PC drawn by the craftsman. From this product program even picture takers can build up some unique outcomes in their pictures and may give them an alluring look. This is the heavenly transformation propelled on the planet of painting and sketches. When you have quite recently started endeavoring nearby on portraying, it's best to take in the significant proposals given ideal here. These will help you in portray making. It is best to first see that drawing can't be learnt in a day. It's a craftsmanship. To change into capable in this field, it is prudent to work burdensome and apply a lot. The more you take after, the less complex it will be to attract. Sketching is a free hand drawing made with pencil on paper. For making great portrayals, you should have redress supplies like draw pencils and paper. The standard of gives can influence the best results. Sketchers keep up pencils in various types like tripod hold, overhand grasp and underhand grasp. In any case, there isn't a best model. You have to pick the sort that you are most cozy with. You should start rehearsing with straightforward figures like straight follows, bends, circles, ovals, squares and triangles. Albeit, most people assume that it is easy to draw such figures and they don't need to work debilitating, yet it's not really. Numerous individuals can't draw simple figures with free hand. Acing basic figures will empower you to direct your hand development, which is stage one to drawing a radiant sketch. When you end up being capable in drawing geometric figures, it's best to begin drawing figures of scenes, properties, and pets. Step by step exchange to the kind of portrayals that you simply need to draw. For instance, in the event that you need to get into style planning, it is best to start making free hand illustrations of mannequins hung in various outfits. Similarly, on the off chance that you wish to develop to be a scene craftsman, it's best to invest quality energy in regular settings catching its radiance in your sketchbook. On the off chance that you wish to wind up plainly a sketch artist, it is best to draw exaggerations of individuals and scenes. Proportion is a basic piece of drawing great representations. For example, in the event that you are making a picture, it's great to have a right idea of separation between eyes, estimation of eyes and size of nostril. Indeed, even a simple change inside the point of face adjustments these extents. Because of this reality, a sketcher ought to have the capacity to legitimately gauge the measurements. While making a portray, it is best to first concentrate just on the diagram. Constantly take a shot at itemizing afterwards. Shading offers a three-dimensional look to an illustration. It likewise encourages a man to picture whether the thing is closed or far away, regardless of whether it is stationary or moving, what is the surface of the thing, what time of day it is et cetera. Accordingly, it is best to pay specific thought to shading. Learn distinctive styles of finishing. Place cash into great quality agreeable pencils of various evaluations for shading your sketches. Throughout the underlying adapting course of, don't be excessively urgent of what you may have portrayed. Concentrate out of your oversights and upgrade with each drawing. Final however not the minimum, get preparing from a specialist. You can join an illustration class or concentrate some mastery and traps from a non-open mentor. You can too take the assistance of web based illustration instructional exercises for concentrate simple strategies to sketch. It's no mystery that we're passing by methods for some essentially attempting money related occurrences. Retreat, despairing, twofold plunge subsidence, paying little respect to the experts and investigators are calling it until further notice, cases are troublesome and the joblessness cost is one of the most exceedingly terrible inside the chronicled past of our nation. Whereas something which I do is prepare people how you can make money with building up a site by subsidiary web promoting and publicizing, honestly it sets aside some opportunity to build up an advantageous site which you'll have the capacity to remain off of. Due to this reality at display we will discuss what to do once you're resolved and covering the best approach to profit on-line rapidly. Additional critically it will just talk about the correct method to create wage snappy online without cost particularly. Micro Employment Sites Offering your organizations is somewhat potentially the snappiest strategy to create benefits on-line rapidly. Miniaturized scale work sites like Fiverr.com are the way many individuals make an ensured quick buck by elevating their organizations to intrigued buyers. These are sites which you'll have the capacity to go to and win cash from pretty much anything which you'll consider. Take your capacities and advance them on these sites and included customers will reach you about doing your promoted work for them. You gets a commission immediately to do what you're enthused about or have a capacity for whether that is composing articles/content material, doing work in Photoshop for somebody, completing an illustration or outline, doing voiceover work; really anything you can think of. GigHour, Gigbucks, Fittytown pay out at considerably bigger levels than Fiverr so consider how much whatever you're advancing is cost and get to it. I've assembled a whole asset on how you can win cash with Fiverr to look out from the group, find customers, and get paid; this information may be used to any miniaturized scale work site, as well. Craigslist Craigslist is as yet a fantastic place for finding fast erratic occupations which pay notwithstanding all day work. Various years back after I was just beginning in member showcasing and didn't know a great deal to something about what toiled and what did not work and was subsequently in any case attempting to help myself, I took to Craigslist and found a few employments which put away me going in the brisk term while I purchased my footing. One work made them compose depictions for a ton of monetary items on a money related site loaded down with offshoot presents (which I didn't see until some other time). I used to be paid $one thousand for just a couple of days of labor. Check out the "Et cetera." part, half time area, or pursuit "working from home" in your city or any assortment of gigantic urban communities for gigs which you can do from your own home. Simply influence sure to practice your due persistence to simply to recall to're working with a decent one that won't hardened you on charge. You should get an agreement worked out to decide the parameters of your trade with your legally binding manager when it's a moderately enormous total of cash like $1000. There are a lot of free contract destinations available which you'll snatch free documentation from and may effectively alter on your functions. eBay eBay is a powerful place to acquire cash online in no time by organizing and advancing off your potential resources to included occasions for a quick payday. You can likewise look at what is advancing on eBay at that point fly in to your nearby thrift stores and pawn shops to seek out these devices at that point exchange them on eBay at a superior charge for a wonderful profit. On-line Promoting and marketing Okay so I expressed in opening that on the web/web online member promoting sets aside opportunity to basically take off. That doesn't suggest that you would be capable to't gain cash on-line rapidly by it, as properly. You will get a webpage enlisted for $7.49 with my GoDaddy Website Minimal effort and facilitating for $2.ninety nine a month through my GoDaddy Website Markdown, at that point you may get a site organize in 10 minutes. Make that site into smaller than expected site to promote the ideal partner item in your general vicinity of enthusiasm by watching out OfferVault, ClickBank, Charge Intersection, PayDotCom, LinkShare, ShareASale, and numerous others.. At that point transport some activity to that site and profit in the short era though developing that small scale site directly into a substance site inside the background. You may likewise get a free weblog on WordPress.com yet the issue with that will be that it isn't yours and furthermore you're truly profiting and creating another person's venture as opposed to your own which isn't a decent idea. Create Your Own Product Creating your own item isn't as intense as you'd think. I'll have an entire helpful asset committed to instructing techniques to make your own online item and elevating it to make some gigantic money. Offshoot showcasing is a certain something, however when you build up your individual item and screen down your own partners, that is the point at which the genuine cash starts to return in and that is the manner by which the net business visionaries making 7 figures a yr make the vast majority of their money. At the minimum you can make an information item inside an unmistakable fragment which you may have understanding and learning in. People like advanced stock because of it is a prompt acquire and instructive items have customarily all the time offered viably on the web, in this way the ubiquity of Clickbank. Get Artistic Go to your local mother and pop stores and approach them in the event that they've a site for their undertaking and if not then offer to build them a site for a couple of hundred dollars. In the event that the answer is no then begin the wheeling and dealing entertainment. As I introduce in my motion pictures on simple strategies to set up a site for nothing out of pocket well ordered afresh and techniques to utilize WordPress, you can set up an absolutely handy and appealing site in 10 minutes with no need any expertise. The point is to be imaginative. There are heaps of suppliers which you'll have the capacity to supply which show up out of your scope however are anything but difficult to execute and there are bunches of individuals who get themselves either apathetic or overwhelmed at something like building up a site. An imaginative contemplations in addition to promoting and advertising measures up to achievement in this case. When You're Resolved Bear in mind When you're entirely towards the divider, make sure to contact organization like the Salvation Armed force, dinners banks, or city human administration divisions to guarantee that you keep the lights on and suppers on the table.
#3D Scatter Plot Matplotlib Fairfax#Matplotlib 3D Line Plot Fairfax#Pandas 3D Plot Fairfax#Unknown Projection ‘3D’ Fairfax#Seaborn 3D Plot Fairfax#‘Numpy.Ndarray’ Object Has No Attribute ‘Has_Data’ Fairfax#Python Interactive 3D Scatter Plot Fairfax#Matplotlib 2D Surface Plot Fairfax
0 notes
Text
June 21, 2020 at 10:00PM - Python Programming Bootcamp 2.0 (96% discount) Ashraf
Python Programming Bootcamp 2.0 (96% discount) Hurry Offer Only Last For HoursSometime. Don't ever forget to share this post on Your Social media to be the first to tell your firends. This is not a fake stuff its real.
Learning a new programming language can take huge amounts of time – especially if you have to drive to a physical classroom every day. This crash online course, however, will put you on the fast track to learning Python, teaching you everything you need to know about this powerful general-purpose language in just two sittings.
Access 28 lectures & 3 hours of content 24/7
Learn Python language fundamentals
Progress into more advanced topics like functions & classes
Fortify your learning by completing challenges
Everybody loves their filters, and in this course you’ll learn how to build your very own, just like your favorites on Instagram and Snapchat. You’ll build an app that allows you to load a photo, edit its contrast, brightness, and gray-scale, and then create and apply custom filters. In addition to the practical construction, you’ll also delve into the Python theory behind it all.
Access 27 lectures & 3.5 hours of content 24/7
Discuss concepts such as matrices, color models, brightness, contrast, & convolution from a mathematical perspective
Install Virtual Box
Perform matrix operations using Numpy & OpenCV
Discover a variety of Python libraries
The best way to learn a programming language is through practical, hands-on experience, and this course will teach you Python through building a fully-functional security camera. The application you’re building will detect movement in video footage and subsequently execute an action, such as sending out an email or SMS. Between theory and actual hands-on work, by course’s end you’ll have a nuanced understanding of Python.
Access 36 lectures & 4.5 hours of content 24/7
Create a fully-functional smart security camera using a Raspberry Pi or the webcam on your device
Learn summation notation
Explore image similarity metrics like sum squared errors, mean squared errors, & structural similarity
Understand how to perform video processing w/ Python
Python is an especially valuable tool for visualizing data, and this course will cover a variety of techniques that will allow you to visualize data using the Python library, Matplotlib. Beginning with an intro to statistics, you’ll extend into a variety of plots that will cover most use-cases.
Access 20 lectures & 3 hours of content 24/7
Explore bar charts, line plots, & scatter plots
Learn about advanced plots such as Quiver plots, 3D lines, & 3D surfaces
Discover subplots & how they’re used
This beginner course will get you up to speed with the very basics of Python, one of the most important programming languages used in a wide variety of industries today. Give your resume a boost while learning practical skills that can take your career a long way!
Access 46 lectures & 4 hours of content 24/7
Set up Python & install the IDE
Learn about operators in Python
Use for loops & while loops
Discover the different types of statements in Python
Master Python fundamentals
Totally new to programming? No worries, this course is geared towards beginners, showing you detailed examples of how to code with Python, one of the most common and powerful general-purpose languages around. If you’ve ever had an interest in programming, here’s where to start!
Access 93 lectures & 5.5 hours of content 24/7
Learn Python basics through exercises
Discover variables, strings, lists, & more
Explore tuples, dictionaries, decision statements, & more
Python is an incredibly efficient language as you’ll learn in this quick course that you can complete in as little as a day. Python is frequently used in scientific fields for academic research and applied work due in part to this great efficiency. This example-driven course is created to give you a deeper understanding of the language.
Access 84 lectures & 2.5 hours of content 24/7
Learn Python by completing projects
Get a single, all-inclusive learning experience for Python 2.X or Python 3.X
Discover the essential Python fundamentals in as little as one day
Python has a range of machine learning applications, making it invaluable for developers, especially ones building engines for the web. This course focuses on building procedural machine learning processes from the ground up so you can get a more nuanced understanding of how machines process data.
Access 48 lectures & 5 hours of content 24/7
Get thorough explanations & comments to understand why things are being done in certain ways
Take code walkthroughs to see a machine learning app work in real time
Write machine learning processes from scratch
Python can be especially useful in finance as it has powerful analytical and predictive modeling capabilities. In this course, you’ll learn just how Python can be applied in the world of finance. Even if you know absolutely nothing about coding, you’ll learn in-demand, real-world skills that can make your resume jump out or help you make a difference in your own financial portfolio.
Access 104 lectures & 6.5 hours of content 24/7
Build correlations between stocks, estimate risk & rate of return
Explore the difference between diversifiable & non-diversifiable risk
Perform regression analysis
Measure a regression’s explanatory power w/ R^2
Use Monte Carlo in a corporate finance context for options & stock pricing
Apply the Black Scholes formula
from Active Sales – SharewareOnSale https://ift.tt/2sBiuOB https://ift.tt/eA8V8J via Blogger https://ift.tt/2YlE7jY #blogger #bloggingtips #bloggerlife #bloggersgetsocial #ontheblog #writersofinstagram #writingprompt #instapoetry #writerscommunity #writersofig #writersblock #writerlife #writtenword #instawriters #spilledink #wordgasm #creativewriting #poetsofinstagram #blackoutpoetry #poetsofig
0 notes