#AlertManagement
Explore tagged Tumblr posts
Visit Tumblr Blog
Explore Tumblr blogs with no restrictions, modern design and the best experience.
Last Seen Tumblr Blogs


Fun Fact
12.7% of mobile users access Tumblr.
Text
TVAlertsManager Features: Effortlessly Automate and Optimize Your TradingView Alerts
TVAlertsManager offers powerful features to automate and manage your TradingView alerts with ease. Customize and track Real-Time Alerts in TradingView, ensuring you never miss key market opportunities. Streamline your trading strategy, receive instant notifications, and make data-driven decisions faster with the advanced capabilities of TVAlertsManager.
0 notes
Text
ARM AI Edge Controller + Prometheus Database for Smart Building Energy Monitoring

Case Details
ARM Embedded Computers and Prometheus Overview
1. ARM Embedded Computers
ARM embedded computers are low-power, high-performance microcomputers based on ARM architecture, designed for IoT and edge computing scenarios. Key features include:
Low Power Consumption: Utilizes ARM processors (e.g., Cortex-A series), ideal for long-term embedded applications.
Compact Design: Small form factor, easily integrated into devices like sensor gateways or industrial controllers.
Rich Interfaces: Supports GPIO, I2C, SPI, UART, USB, Ethernet, etc., enabling seamless connectivity with sensors and peripherals.
Real-Time Capabilities: Some models support real-time operating systems (RTOS) or Linux, meeting industrial control requirements. Typical applications include smart homes, industrial automation, and energy management.
2. Prometheus
Prometheus is an open-source monitoring and alerting tool maintained by the Cloud Native Computing Foundation (CNCF). Core functionalities include:
Time-Series Database: Efficiently stores and queries metrics (e.g., CPU usage, energy consumption).
Data Collection: Uses HTTP pull mode to gather metrics from targets (e.g., ARM devices).
PromQL Query Language: Enables flexible data analysis and aggregation.
Visualization & Alerting: Integrates with Grafana for dashboards and Alertmanager for anomaly notifications. Prometheus excels in distributed systems and IoT real-time monitoring.
Application Cases: ARM Embedded Computers + Prometheus in Lighting System Energy Monitoring
System Architecture
Hardware Layer
ARM embedded computers (e.g., Raspberry Pi, NVIDIA Jetson Nano, Rockchip boards) act as edge nodes, connected to light sensors, current/voltage sensors, and smart meters.
Collects real-time data (power, current, on/off status) from lighting devices (e.g., LED lights, smart switches) via Modbus, MQTT, or LoRa protocols.
Data Collection Layer
Deploy Prometheus Exporters (e.g., Node Exporter, custom exporters) on ARM devices to convert sensor data into Prometheus-compatible metrics (e.g., light_power_consumption{watt="50", location="room1"}).
Transmits data to a Prometheus server (deployed locally or in the cloud) via Wi-Fi/Ethernet.
Monitoring & Analytics Layer
Prometheus periodically pulls metrics from ARM devices and stores them in its time-series database.
Grafana dashboards visualize real-time energy usage, historical trends, and device status.
Typical Use Cases
Case 1: Commercial Building Energy Optimization
Requirement: Reduce lighting energy consumption in an office building while ensuring comfortable illumination.
Solution:
Deploy ARM devices on each floor to collect light intensity and power data.
Use Prometheus to monitor real-time power usage and automatically adjust LED brightness based on ambient light.
Trigger alerts via Alertmanager for high-energy zones (e.g., lights left on in empty meeting rooms).
Outcome: 30% reduction in energy consumption; remote lighting strategy management.
Case 2: Industrial Lighting Health Monitoring
Requirement: Prevent production line downtime caused by lighting failures in a factory.
Solution:
ARM devices monitor current fluctuations to detect anomalies (e.g., voltage drops).
Prometheus stores historical data; machine learning models (e.g., TensorFlow Lite) predict lamp lifespan.
Dashboards display device health scores for proactive maintenance.
Outcome: 50% fewer failures; 20% lower maintenance costs.
Case 3: Smart City Streetlight Management
Requirement: Enable remote control and time-based dimming for municipal streetlights.
Solution:
ARM devices with LoRa modules act as streetlight controllers.
Prometheus collects status and energy data, adjusts brightness based on time (e.g., dimming at night).
GPS-integrated maps pinpoint faulty streetlights.
Outcome: 40% lower energy usage; 60% reduction in public complaints.
Key Advantages
Real-Time Insights: ARM edge computing + Prometheus enables sub-second data collection for rapid responses.
Cost Efficiency: Low-cost ARM hardware + free/open-source Prometheus suits large-scale deployments.
Scalability: Easily expandable—add sensors or zones without system overhauls.
Data-Driven Decisions: Historical analysis supports energy-saving initiatives (e.g., replacing inefficient fixtures).
Future Prospects
Integrating AI algorithms (e.g., time-series prediction) could further optimize lighting strategies,
The BL370 series, with its high-performance hardware, industrial protocol stack, and edge AI capabilities, combined with Prometheus’ real-time monitoring, flexible querying, and visualization, delivers the following core benefits for lighting energy management:
Precision Control: End-to-end low latency from data acquisition to action.
Reliable Operations: Resilient in harsh environments with remote diagnostics and long-term stability.
Intelligent Decision-Making: AI-driven energy optimization and predictive maintenance.
Rapid Deployment: Out-of-the-box hardware/software with strong protocol compatibility, shortening project timelines.
Future Expansion: Leverage BL370’s NPU and Prometheus’ time-series database to develop predictive models (e.g., lighting demand forecasts based on historical data), enabling "zero-touch" energy management.
#ARMxy#ARMxy SBC#ARMxy based SBC#ARM Industrial computer#ARM Embedded Controller#Prometheus#database
0 notes
Text
Deploy Your First App on OpenShift in Under 10 Minutes
Effective monitoring is crucial for any production-grade Kubernetes or OpenShift deployment. In this article, we’ll explore how to harness the power of Prometheus and Grafana to gain detailed insights into your OpenShift clusters. We’ll cover everything from setting up monitoring to visualizing metrics and creating alerts so that you can proactively maintain the health and performance of your environment.
Introduction
OpenShift, Red Hat’s enterprise Kubernetes platform, comes packed with robust features to manage containerized applications. However, as the complexity of deployments increases, having real-time insights into your cluster performance, resource usage, and potential issues becomes essential. That’s where Prometheus and Grafana come into play, enabling observability and proactive monitoring.
Why Monitor OpenShift?
Cluster Health: Ensure that each component of your OpenShift cluster is running correctly.
Performance Analysis: Track resource consumption such as CPU, memory, and storage.
Troubleshooting: Diagnose issues early through detailed metrics and logs.
Proactive Alerting: Set up alerts to prevent downtime before it impacts production workloads.
Optimization: Refine resource allocation and scaling strategies based on usage patterns.
Understanding the Tools
Prometheus: The Metrics Powerhouse
Prometheus is an open-source systems monitoring and alerting toolkit designed for reliability and scalability. In the OpenShift world, Prometheus scrapes metrics from various endpoints, stores them in a time-series database, and supports complex querying through PromQL (Prometheus Query Language). OpenShift’s native integration with Prometheus gives users out-of-the-box monitoring capabilities.
Key Features of Prometheus:
Efficient Data Collection: Uses a pull-based model, where Prometheus scrapes HTTP endpoints at regular intervals.
Flexible Queries: PromQL allows you to query and aggregate metrics to derive actionable insights.
Alerting: Integrates with Alertmanager for sending notifications via email, Slack, PagerDuty, and more.
Grafana: Visualize Everything
Grafana is a powerful open-source platform for data visualization and analytics. With Grafana, you can create dynamic dashboards that display real-time metrics from Prometheus as well as other data sources. Grafana’s rich set of panel options—including graphs, tables, and heatmaps—lets you drill down into the details and customize your visualizations.
Key Benefits of Grafana:
Intuitive Dashboarding: Build visually appealing and interactive dashboards.
Multi-source Data Integration: Combine data from Prometheus with logs or application metrics from other sources.
Alerting and Annotations: Visualize alert states directly on dashboards to correlate events with performance metrics.
Extensibility: Support for plugins and integrations with third-party services.
Setting Up Monitoring in OpenShift
Step 1: Deploying Prometheus on OpenShift
OpenShift comes with built-in support for Prometheus through its Cluster Monitoring Operator, which simplifies deployment and configuration. Here’s how you can get started:
Cluster Monitoring Operator: Enable the operator from the OpenShift Web Console or using the OpenShift CLI. This operator sets up Prometheus instances, Alertmanager, and the associated configurations.
Configuration Adjustments: Customize the Prometheus configuration according to your environment’s needs. You might need to adjust scrape intervals, retention policies, and alert rules.
Target Discovery: OpenShift automatically discovers important endpoints (e.g., API server, node metrics, and custom application endpoints) for scraping. Ensure that your applications expose metrics in a Prometheus-compatible format.
Step 2: Integrating Grafana
Deploy Grafana: Grafana can be installed as a containerized application in your OpenShift project. Use the official Grafana container image or community Operators available in the OperatorHub.
Connect to Prometheus: Configure a Prometheus data source in Grafana by providing the URL of your Prometheus instance (typically available within your cluster). Test the connection to ensure metrics can be queried.
Import Dashboards: Leverage pre-built dashboards from the Grafana community or build your own custom dashboards tailored to your OpenShift environment. Dashboard templates can help visualize node metrics, pod-level data, and even namespace usage.
Step 3: Configuring Alerts
Both Prometheus and Grafana offer alerting capabilities:
Prometheus Alerts: Write and define alert rules using PromQL. For example, you might create an alert rule that triggers if a node’s CPU usage remains above 80% for a sustained period.
Alertmanager Integration: Configure Alertmanager to handle notifications by setting up routing rules, grouping alerts, and integrating with channels like Slack or email.
Grafana Alerting: Configure alert panels directly within Grafana dashboards, allowing you to visualize metric thresholds and receive alerts if a dashboard graph exceeds defined thresholds.
Best Practices for Effective Monitoring
Baseline Metrics: Establish baselines for normal behavior in your OpenShift cluster. Document thresholds for CPU, memory, and network usage to understand deviations.
Granular Dashboard Design: Create dashboards that provide both high-level overviews and deep dives into specific metrics. Use Grafana’s drill-down features for flexible analysis.
Automated Alerting: Leverage automated alerts to receive real-time notifications about anomalies. Consider alert escalation strategies to reduce noise while ensuring critical issues are addressed promptly.
Regular Reviews: Regularly review and update your monitoring configurations. As your OpenShift environment evolves, fine-tune metrics, dashboards, and alert rules to reflect new application workloads or infrastructure changes.
Security and Access Control: Ensure that only authorized users have access to monitoring dashboards and alerts. Use OpenShift’s role-based access control (RBAC) to manage permissions for both Prometheus and Grafana.
Common Challenges and Solutions
Data Volume and Retention: As metrics accumulate, database size can become a challenge. Address this by optimizing retention policies and setting up efficient data aggregation.
Performance Overhead: Ensure your monitoring stack does not consume excessive resources. Consider resource limits and autoscaling policies for monitoring pods.
Configuration Complexity: Balancing out-of-the-box metrics with custom application metrics requires regular calibration. Use templated dashboards and version control your monitoring configurations for reproducibility.
Conclusion
Monitoring OpenShift with Prometheus and Grafana provides a robust and scalable solution for maintaining the health of your containerized applications. With powerful features for data collection, visualization, and alerting, this stack enables you to gain operational insights, optimize performance, and react swiftly to potential issues.
As you deploy and refine your monitoring strategy, remember that continuous improvement is key. The combination of Prometheus’s metric collection and Grafana’s visualization capabilities offers a dynamic view into your environment—empowering you to maintain high service quality and reliability for all your applications.
Get started today by setting up your OpenShift monitoring stack, and explore the rich ecosystem of dashboards and integrations available for Prometheus and Grafana! For more information www.hawkstack.com
0 notes
Text
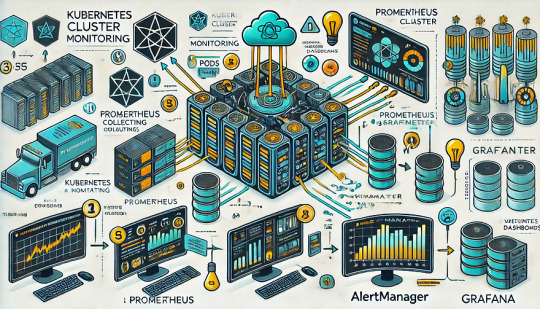
Monitoring Kubernetes Clusters with Prometheus and Grafana
Introduction
Kubernetes is a powerful container orchestration platform, but monitoring it is crucial for ensuring reliability, performance, and scalability.
Prometheus and Grafana are two of the most popular open-source tools for monitoring and visualizing Kubernetes clusters.
In this guide, we’ll walk you through setting up Prometheus and Grafana on Kubernetes and configuring dashboards for real-time insights.
Why Use Prometheus and Grafana for Kubernetes Monitoring?
Prometheus: The Monitoring Backbone
Collects metrics from Kubernetes nodes, pods, and applications.
Uses a powerful query language (PromQL) for analyzing data.
Supports alerting based on predefined conditions.
Grafana: The Visualization Tool
Provides rich dashboards with graphs and metrics.
Allows integration with multiple data sources (e.g., Prometheus, Loki, Elasticsearch).
Enables alerting and notification management.
Step 1: Installing Prometheus and Grafana on Kubernetes
Prerequisites
Before starting, ensure you have:
A running Kubernetes cluster
kubectl and Helm installed
1. Add the Prometheus Helm Chart Repository
Helm makes it easy to deploy Prometheus and Grafana using predefined configurations.shhelm repo add prometheus-community https://prometheus-community.github.io/helm-charts helm repo update
2. Install Prometheus and Grafana Using Helm
shhelm install prometheus prometheus-community/kube-prometheus-stack --namespace monitoring --create-namespace
This command installs: ✅ Prometheus — For collecting metrics ✅ Grafana — For visualization ✅ Alertmanager — For notifications ✅ Node-exporter — To collect system-level metrics
Step 2: Accessing Prometheus and Grafana
Once deployed, we need to access the Prometheus and Grafana web interfaces.
1. Accessing Prometheus
Check the Prometheus service:shkubectl get svc -n monitoring
Forward the Prometheus server port:shkubectl port-forward svc/prometheus-kube-prometheus-prometheus 9090 -n monitoring
Now, open http://localhost:9090 in your browser.
2. Accessing Grafana
Retrieve the Grafana admin password:shkubectl get secret --namespace monitoring prometheus-grafana -o jsonpath="{.data.admin-password}" | base64 --decodeForward the Grafana service port:shkubectl port-forward svc/prometheus-grafana 3000:80 -n monitoring
Open http://localhost:3000, and log in with:
Username: admin
Password: (obtained from the previous command)
Step 3: Configuring Prometheus as a Data Source in Grafana
Open Grafana and navigate to Configuration > Data Sources.
Click Add data source and select Prometheus.
Set the URL to:
sh
http://prometheus-kube-prometheus-prometheus.monitoring.svc.cluster.local:9090
Click Save & Test to verify the connection.
Step 4: Importing Kubernetes Dashboards into Grafana
Grafana provides ready-made dashboards for Kubernetes monitoring.
Go to Dashboards > Import.
Enter a dashboard ID from Grafana’s dashboard repository.
Example: Use 3119 for Kubernetes cluster monitoring.
Select Prometheus as the data source and click Import.
You’ll now have a real-time Kubernetes monitoring dashboard! 🎯
Step 5: Setting Up Alerts in Prometheus and Grafana
Creating Prometheus Alerting Rules
Create a ConfigMap for alerts:yamlapiVersion: v1 kind: ConfigMap metadata: name: alert-rules namespace: monitoring data: alert.rules: | groups: - name: InstanceDown rules: - alert: InstanceDown expr: up == 0 for: 5m labels: severity: critical annotations: summary: "Instance {{ $labels.instance }} is down"
Apply it to the cluster:shkubectl apply -f alert-rules.yaml
Configuring Grafana Alerts
Navigate to Alerting > Notification Channels.
Set up a channel (Email, Slack, or PagerDuty).
Define alert rules based on metrics from Prometheus.
Step 6: Enabling Persistent Storage for Prometheus
By default, Prometheus stores data in memory. To make the data persistent, configure storage:
Modify the Helm values:yamlprometheus: server: persistentVolume: enabled: true size: 10Gi
Apply the changes:shhelm upgrade prometheus prometheus-community/kube-prometheus-stack -f values.yaml
Conclusion
In this guide, we’ve set up Prometheus and Grafana to monitor a Kubernetes cluster. You now have: ✅ Real-time dashboards in Grafana ✅ Prometheus alerts to detect failures ✅ Persistent storage for historical metrics
WEBSITE: https://www.ficusoft.in/devops-training-in-chennai/
0 notes
Text
蜘蛛池需要哪些日志管理工具?
在互联网运维和SEO优化领域,蜘蛛池(Spider Pool)是一个重要的概念。它指的是通过模拟大量搜索引擎爬虫(也称为“蜘蛛”或“机器人”)的行为,来提升网站的收录速度和排名。为了确保蜘蛛池的有效运行,日志管理工具是必不可少的。这些工具可以帮助我们监控、分析和优化蜘蛛池的表现。那么,蜘蛛池需要哪些日志管理工具呢?本文将为您详细介绍。
1. 日志收集工具
首先,我们需要一个强大的日志收集工具。这类工具可以自动抓取服务器上的各种日志文件,并将其集中存储在一个地方。这样做的好处是可以方便地进行后续的日志分析和处理。常用的日志收集工具有Logstash、Fluentd等。
2. 日志分析工具
有了日志收集工具之后,接下来就需要用到日志分析工具了。这类工具能够帮助我们从海量的日志数据中提取有价值的信息。例如,我们可以使用日志分析工具来统计蜘蛛池中不同搜索引擎爬虫的访问频率、停留时间等指标。常用的日志分析工具有Elasticsearch、Kibana等。
3. 日志可视化工具
日志可视化工具可以帮助我们将复杂的日志数据以图表的形式展示出来,使得数据分析变得更加直观易懂。通过这种方式,我们可以更快速地发现蜘蛛池中的异常情况,并及时采取措施进行调整。常用的日志可视化工具有Grafana、Tableau等。
4. 日志告警工具
最后,我们还需要一个日志告警工具。当蜘蛛池出现异常情况时,这个工具会立即向我们发送通知,以便我们能够及时处理问题。常用的日志告警工具有Prometheus Alertmanager、Zabbix等。
结语
综上所述,要有效地管理和优化蜘蛛池,我们需要一套完整的日志管理系统。这包括日志收集工具、日志分析工具、日志可视化工具以及日志告警工具。只有这样,我们才能确保蜘蛛池的高效运行,并最终实现SEO优化的目标。
讨论点
你认为在实际应用中,还有哪些日志管理工具是必不可少的?欢迎在评论区分享你的观点!
加飞机@yuantou2048

EPS Machine
ETPU Machine
0 notes
Text
Monitoring Systems and Services with Prometheus
In today’s IT landscape, monitoring systems and services is not just important—it’s critical. With the rise of microservices, cloud-native architectures, and distributed systems, ensuring application uptime and performance has become more complex. Enter Prometheus, an open-source monitoring and alerting toolkit designed for modern systems.
What is Prometheus?
Prometheus is a powerful, feature-rich, and highly scalable monitoring system. It excels at collecting metrics, providing a flexible query language, and integrating seamlessly with a wide variety of systems. Developed originally by SoundCloud, it is now a Cloud Native Computing Foundation (CNCF) project.
Key Features of Prometheus
Multi-dimensional data model: Metrics are stored with key-value pairs (labels), allowing granular and flexible querying.
Pull-based scraping: Prometheus pulls metrics from defined endpoints, ensuring better control over the data.
Powerful query language (PromQL): Prometheus Query Language enables robust metric analysis.
Time-series database: It stores all data as time-stamped, making historical analysis and trend monitoring straightforward.
Alerting capabilities: Prometheus integrates with Alertmanager to provide notifications for defined thresholds or anomalies.
How Prometheus Works
Scraping Metrics: Prometheus scrapes metrics from targets (applications, services, or systems) by accessing exposed HTTP endpoints, typically /metrics.
Data Storage: The collected metrics are stored in Prometheus’s time-series database.
Querying with PromQL: Users can run queries to analyze trends, generate graphs, or inspect metrics for anomalies.
Alerting: Based on queries, Prometheus can trigger alerts via the Alertmanager, which supports integrations with tools like Slack, PagerDuty, and email.
Use Cases of Prometheus
Infrastructure Monitoring: Track CPU, memory, disk usage, and network performance of your servers and VMs.
Application Monitoring: Monitor application health, API latencies, error rates, and user request patterns.
Kubernetes Monitoring: Gain insights into Kubernetes clusters, including pod status, resource utilization, and deployments.
Business Metrics: Measure success indicators such as transactions per second, user growth, or conversion rates.
Getting Started with Prometheus
Install Prometheus: Download and install Prometheus from its official site.
Set up Scrape Targets: Define the endpoints of the services you want to monitor in the prometheus.yml configuration file.
Run Prometheus: Start the server, and it will begin collecting metrics.
Visualize Metrics: Use Prometheus’s web UI, Grafana (a popular visualization tool), or command-line queries for visualization and analysis.
Integrating Prometheus with Grafana
While Prometheus provides a basic web interface, its true potential shines when paired with Grafana for rich and interactive dashboards. Grafana supports PromQL natively and allows you to create stunning visualizations of your metrics.
Benefits of Using Prometheus
Open Source: Freely available, with a vast and active community.
Scalable: Works efficiently for both small setups and enterprise-level infrastructures.
Extensible: Compatible with many exporters, enabling monitoring of databases, message queues, and more.
Alerts and Insights: Real-time monitoring and customizable alerts ensure minimal downtime.
Challenges and How to Overcome Them
High Cardinality: Too many unique label combinations can lead to resource overuse. Optimize your labels to avoid this.
Scaling: Use Prometheus federation or remote storage solutions to handle extremely large environments.
Learning Curve: PromQL and setup can be complex initially, but online documentation and the Prometheus community offer ample resources.
Final Thoughts
Prometheus has transformed the way modern systems and services are monitored. Its powerful features, extensibility, and open-source nature make it a go-to choice for organizations of all sizes. Whether you’re monitoring a single server or a multi-cloud deployment, Prometheus can scale to meet your needs.
If you’re looking to harness the power of Prometheus for your systems, explore HawkStack’s monitoring solutions. Our expert team ensures seamless integration and optimized monitoring for all your infrastructure needs.
Ready to get started? Contact us today! www.hawkstack.com
#redhatcourses#information technology#containerorchestration#kubernetes#docker#linux#container#containersecurity#dockerswarm
0 notes
Text
Tips and tools for collecting helpful Kubernetes metrics
Prometheus is named after the Greek legend of Prometheus, a titan who defied the gods and gave fire to humanity. For this action, Prometheus was chained to a boulder where an eagle, the earthen symbol of Zeus, would eat the other immortal's liver, every day, for eternity.
Since its introduction in 2012, Prometheus has been adopted by a multitude of companies and organizations. However, it remains independent with the management and maintenance of the project occurring separate of any company.
In 2016, Prometheus joined the Cloud Native Computing Foundation (CNCF). It is the second project hosted by the foundation; the first project was Kubernetes.
READ MORE...
In modern software development, managing and monitoring infrastructure is critical for ensuring the reliability and performance of applications. Prometheus has emerged as one of the most powerful tools for this purpose. Designed specifically for monitoring and alerting in cloud-native environments, Prometheus is widely adopted by developers, sysadmins, and DevOps teams.
In this masterclass, we will explore the core concepts of Prometheus, how to set it up, configure it, and use it for monitoring infrastructure and generating alerts. By the end of this guide, you’ll have a deep understanding of how Prometheus works and how it can be applied to real-world infrastructure monitoring and alerting.
Table of Contents
Introduction to Prometheus
Prometheus Architecture
Setting up Prometheus
Data Collection with Exporters
Writing Prometheus Queries (PromQL)
Alerting in Prometheus
Monitoring Infrastructure with Prometheus
Prometheus and Grafana Integration
Scaling and Managing Prometheus
Best Practices for Prometheus Monitoring
Real-World Use Cases
Conclusion
1. Introduction to Prometheus
Prometheus is an open-source systems monitoring and alerting toolkit, originally built at SoundCloud. Since its inception, it has become one of the most popular monitoring tools, particularly for cloud-native environments. It is part of the Cloud Native Computing Foundation (CNCF) and works exceptionally well with containerized environments like Kubernetes.
Key features of Prometheus:
Time Series Database (TSDB): Prometheus stores all data as time series, i.e., data points are stored along with a timestamp.
Powerful Query Language (PromQL): Prometheus offers a flexible query language for extracting and analyzing time series data.
Pull-based Architecture: Prometheus scrapes metrics from monitored targets by pulling data from HTTP endpoints.
Alerting System: Prometheus integrates with the Alertmanager to support rule-based alerting.
Prometheus is particularly useful for monitoring server health, application metrics, and containerized environments like Kubernetes.
2. Prometheus Architecture
To understand how Prometheus works, it’s important to understand its architecture. Prometheus consists of several components:
Prometheus Server: The core component responsible for scraping and storing time series data. It uses a custom time series database (TSDB).
Exporters: Components that expose metrics on HTTP endpoints. These are used for exporting data from systems, services, and hardware.
Pushgateway: Prometheus is primarily pull-based, but the Pushgateway allows ephemeral and batch jobs to push their metrics to Prometheus.
Alertmanager: This component handles alerts triggered by Prometheus. It can send notifications via email, Slack, PagerDuty, etc.
PromQL: Prometheus Query Language is used to query the time series data stored in the database.
Grafana (optional): While not part of Prometheus, Grafana is often used to visualize Prometheus data.
Prometheus periodically scrapes data from exporters and stores the time series data in its internal database. Based on the data, Prometheus can trigger alerts and send them to the Alertmanager, which forwards them to the appropriate channels.
3. Setting up Prometheus
Setting up Prometheus is relatively straightforward. Prometheus is distributed as a single binary, which makes installation easy. You can download the binary for your operating system from the official Prometheus website.
4. Data Collection with Exporters
Prometheus uses exporters to collect metrics from various sources. Exporters are components that expose metrics via HTTP endpoints in a format that Prometheus understands. There are several types of exporters:
Node Exporter: Exposes hardware and operating system metrics such as CPU, memory, and disk usage.
Blackbox Exporter: Allows you to probe endpoints via HTTP, HTTPS, DNS, TCP, and ICMP.
Custom Exporters: You can create custom exporters to expose metrics from your own applications or systems.
Installing Node Exporter
The Node Exporter is one of the most commonly used exporters. It provides system-level metrics that are critical for infrastructure monitoring.
5. Writing Prometheus Queries (PromQL)
PromQL is the powerful query language of Prometheus. It allows you to query and aggregate time series data, which can be used for monitoring and alerting purposes.
6. Alerting in Prometheus
Alerting is a critical feature of any monitoring system. Prometheus allows you to define alerting rules based on your PromQL queries. These alerts can then be sent to the Alertmanager for further processing.
7. Monitoring Infrastructure with Prometheus
Monitoring infrastructure with Prometheus involves collecting metrics from different systems such as servers, databases, and cloud services. Prometheus is well-suited for monitoring the health and performance of the following:
Servers: Collect CPU, memory, disk, and network metrics.
Databases: Monitor query performance, connection pools, and other database metrics.
Applications: Monitor application-level metrics like request rates, errors, and latency.
Cloud Services: Use exporters to monitor cloud platforms like AWS, GCP, or Azure.
By setting up exporters on each system, you can gain comprehensive visibility into your infrastructure.
8. Prometheus and Grafana Integration
While Prometheus comes with its own basic UI, integrating it with Grafana provides a more user-friendly and visually appealing way to explore and visualize metrics.
Steps to Integrate Prometheus with Grafana
Install Grafana: Download and install Grafana from the official website.
Add Prometheus as a Data Source:
Navigate to the Grafana dashboard.
Go to “Data Sources” and add Prometheus.
Provide the URL of the Prometheus server (http://localhost:9090).
Create Dashboards: Grafana allows you to create custom dashboards that can visualize Prometheus data using charts, graphs, and tables.
By using Grafana dashboards, you can easily monitor trends, set thresholds, and visualize system performance.
9. Scaling and Managing Prometheus
Prometheus is designed to work in small to medium environments, but as your infrastructure grows, scaling Prometheus becomes necessary. Here are some ways to scale and manage Prometheus:
Sharding: Distribute Prometheus instances across different workloads.
Federation: Use Prometheus federation to aggregate metrics from multiple Prometheus instances.
Retention and Storage: Configure data retention policies and external storage for long-term data storage.
10. Best Practices for Prometheus Monitoring
Use Labels Effectively: Prometheus uses labels to categorize metrics. Make sure to use descriptive labels for better querying and alerting.
Alert on Symptoms, Not Causes: Alerts should be based on high-level symptoms like service unavailability, rather than low-level causes like CPU usage.
Monitor the Monitoring System: Ensure that Prometheus itself is being monitored. You can do this by setting up alerts for Prometheus health.
Keep Queries Simple: While PromQL is powerful, avoid complex queries in production to ensure performance remains high.
11. Real-World Use Cases
Prometheus has been widely adopted by organizations of all sizes for monitoring and alerting in production environments. Some common use cases include:
Monitoring Kubernetes Clusters: Prometheus is often used with Kubernetes to monitor containerized applications.
Application Performance Monitoring (APM): Developers use Prometheus to track request rates, error rates, and latency in microservices architectures.
Infrastructure Monitoring: IT teams monitor system metrics like CPU, memory, and disk usage to ensure system health.
12. Conclusion
Prometheus is a powerful and flexible tool for monitoring and alerting in modern cloud environments. Whether you are monitoring servers, applications, or entire Kubernetes clusters, Prometheus provides the essential tools for collecting, storing, querying, and visualizing metrics. With the addition of Grafana, you can create beautiful, insightful dashboards to keep track of your infrastructure in real-time. By mastering Prometheus, you gain the ability to keep your systems running smoothly and efficiently, ensuring that performance issues are caught before they become critical failures.
Through this Prometheus MasterClass, you’ve learned about its architecture, setting it up, collecting metrics, writing queries, alerting, and best practices. The next step is to start implementing Prometheus in your infrastructure monitoring and alerting strategy.
0 notes
Text
Introduction to Prometheus MasterClass: Infra Monitoring & Alerting

Prometheus MasterClass: Infra Monitoring & Alerting is an essential course for anyone looking to dive deep into infrastructure monitoring and alerting with Prometheus. In today's ever-evolving tech landscape, keeping a keen eye on your systems is crucial. With constant changes and high demands on performance, monitoring is more than just an operational necessity—it’s a strategic tool to ensure reliability, security, and smooth functioning of systems.
What is Prometheus?
Prometheus is an open-source monitoring and alerting tool designed for reliability and scalability. Initially developed by SoundCloud, Prometheus has grown to become one of the most popular choices for system monitoring, especially in cloud environments. The tool is perfect for tracking system health, collecting performance data, and triggering alerts when things go wrong.
Why Learn Prometheus?
Let’s face it—infrastructure monitoring is no longer just a nice-to-have; it’s a must-have for businesses. With the growth of cloud computing and the rise of containerized applications like Docker and Kubernetes, systems are becoming more complex. When systems fail, even for a few minutes, it can lead to massive losses, from revenue to customer trust. Prometheus helps avoid this by enabling real-time monitoring and alerting, which gives you the ability to identify and fix issues before they spiral out of control.
In this Prometheus MasterClass: Infra Monitoring & Alerting, you'll be guided through setting up and using Prometheus for effective system monitoring, as well as integrating it with Grafana for data visualization and setting up powerful alerting mechanisms.
Key Features of Prometheus
Multi-Dimensional Data Model: Prometheus’s core strength is its ability to model time series data with multiple dimensions. This allows you to filter and aggregate data in real-time, which is crucial for quick and effective troubleshooting.
Customizable Alerts: With Prometheus Alertmanager, you can set up highly customizable alerts based on thresholds and other metrics that matter most to your infrastructure.
Scalability: Whether you are monitoring a few services or thousands of nodes, Prometheus can handle it, thanks to its horizontally scalable design.
Pull-based Model: Unlike many other monitoring systems that rely on pushing data, Prometheus pulls data from configured endpoints, which makes it more resilient to intermittent network issues.
PromQL: The Prometheus Query Language (PromQL) is a flexible, powerful query language that helps you extract precise metrics in real-time, making it easy to set up efficient alerts and dashboards.
Monitoring Cloud Infrastructure
With the rise of cloud-native architectures and services like Amazon Web Services (AWS), Google Cloud Platform (GCP), and Microsoft Azure, the need for real-time monitoring has grown exponentially. Prometheus is designed to easily integrate with cloud and microservices environments. From Kubernetes clusters to individual EC2 instances, Prometheus can monitor almost anything.
Integrating Prometheus with Grafana
While Prometheus is excellent at collecting and storing metrics, it lacks in terms of data visualization. That’s where Grafana steps in. Grafana allows you to create highly customizable and visually appealing dashboards to view your Prometheus data in real time. Together, they form a powerful combo for infrastructure monitoring.
Alerts That Matter
Not all alerts are created equal. Setting up alerts that focus on the right metrics—such as CPU utilization, memory leaks, or service availability—is crucial to avoiding alert fatigue. In this Prometheus MasterClass, you'll learn how to configure Alertmanager to trigger the right type of alerts at the right time, and even how to integrate it with communication platforms like Slack or PagerDuty for real-time notifications.
Why You Need Prometheus for Monitoring?
One of the biggest challenges in today’s tech industry is maintaining system reliability. Downtime, system crashes, or unexpected failures can result in serious consequences for your business. Prometheus ensures that you can prevent these problems before they affect your users. Here’s how:
Proactive Monitoring: Get ahead of problems before they affect your users.
Improved Performance: With real-time metrics, you can optimize system performance.
Cost Efficiency: Reduce downtime and avoid costly system failures.
Setting Up Prometheus in Kubernetes
One of the most popular use cases for Prometheus is its integration with Kubernetes. In Kubernetes environments, Prometheus monitors all components—from pods and services to nodes and applications. It’s a must-have tool if you’re running large-scale, containerized applications that require 24/7 monitoring.
Setting up Prometheus in Kubernetes is surprisingly simple. Using the Prometheus Operator, you can automate the setup process, allowing you to focus on fine-tuning your metrics collection and alerting strategies.
Real-World Use Cases of Prometheus
Netflix: The Streaming Giant
Netflix uses Prometheus to monitor its sprawling cloud infrastructure, ensuring uptime and system availability for its millions of global users. By setting up custom alerts and using Prometheus with Grafana, Netflix has dramatically reduced downtime.
DigitalOcean: The Cloud Provider
DigitalOcean uses Prometheus to monitor its entire cloud environment, including compute resources and databases. Prometheus’s pull-based data model allows the company to efficiently monitor system health and resolve issues before they become customer problems.
PAP Meaning in Monitoring Context
You might be wondering, what does PAP stand for in monitoring? PAP stands for Policy Administration Point. It is a crucial concept in access control systems where it serves as the component responsible for managing policies. In the context of infrastructure monitoring, PAP plays a role in ensuring that certain policies—such as alert thresholds and access permissions—are adhered to, thereby enhancing the security and reliability of your system.
Why Alert Fatigue is a Big Deal
One of the hidden dangers of infrastructure monitoring is alert fatigue. When you set up too many alerts, especially for low-priority issues, your team becomes desensitized. This can result in them missing critical alerts. Learning how to set up meaningful alerts with Prometheus Alertmanager is crucial for avoiding this trap.
Best Practices for Prometheus Monitoring
Start with Critical Metrics: Focus on the most important metrics like CPU usage, memory leaks, and service uptime.
Set Proper Alert Thresholds: Don’t be too aggressive with alert thresholds; instead, use historical data to set realistic limits.
Use Grafana for Visualization: Create dashboards for easy monitoring and visualization of your key metrics.
Prometheus vs Other Monitoring Tools
When it comes to monitoring, Prometheus is often compared to other tools like Nagios, Zabbix, or even newer tools like Datadog and New Relic. While these tools are excellent in their own right, Prometheus stands out for its open-source nature, scalability, and deep integration with modern systems like Kubernetes.
Nagios: Focuses more on system-level monitoring.
Zabbix: More suited for network and server monitoring.
Datadog and New Relic: Commercial, SaaS-based monitoring tools that offer additional features but come at a cost.
Prometheus offers an open-source, flexible alternative that can scale with your infrastructure and doesn’t lock you into a commercial product ecosystem.
Conclusion: Take Your Monitoring to the Next Level
Whether you're running a small startup or managing a large-scale enterprise infrastructure, Prometheus offers a powerful, flexible, and scalable solution for infrastructure monitoring and alerting. This Prometheus MasterClass: Infra Monitoring & Alerting will guide you through every aspect of setting up, using, and optimizing Prometheus for your unique needs.
Monitoring is not just about preventing disasters; it's about improving your infrastructure’s performance and ensuring your systems remain reliable and efficient. So, why wait? Take control of your infrastructure monitoring today with Prometheus!
0 notes
Link
0 notes
Text

TradingView Manage Alerts: Tips for Efficient Trading Notifications
Learn how to Manage Alerts in TradingView Manage Alerts to enhance your trading strategy. This guide covers how to customize, organize, and optimize alerts for better market monitoring. Stay on top of price movements, news, and trends with efficient alert management, ensuring you never miss an important trading opportunity.
0 notes
Link
AlertOps empowers teams to collaborate in real-time to resolve business-critical incidents faster. We offer the most flexible and customizable solution, capable of addressing everything from basic on-call alerting to complex and unique enterprise challenges.
#alertmanagement#incidentmanagement#risk management#mtta#mttr#security incident management#major incident software
1 note
·
View note
Text
Creating a Winning Customer Engagement Strategy for Businesses
To improve customer engagement, businesses should create a customer engagement strategy that involves interacting with customers through multiple channels throughout their life cycle. This includes social media, emails, SMS, community forums, and loyalty programs. A connected CRM and customer experience solution is necessary to personalize customer engagement, as it gives a 360-degree view of all customer journeys. Customer engagement is different from customer satisfaction and customer experience, but a good customer engagement strategy can improve customer satisfaction. To facilitate the process, businesses should use tools such as a CRM, feedback collection tool, survey tool, and alert management system. Survey tools and alert management systems are particularly useful for engaging with customers and obtaining more information about their needs and preferences.

#CustomerEngagement#NUMRCXM#MultiChannelMarketing#CRM#CustomerExperience#CustomerSatisfaction#LoyaltyPrograms#FeedbackCollection#SurveyTools#AlertManagement#BusinessGrowth#socialmedia#management#strategy#engagement
0 notes
Text
Kubernetes - Prometheus & Grafana
Introduction
Kubernetes is a powerful orchestration tool for containerized applications, but monitoring its health and performance is crucial for maintaining reliability. This is where Prometheus and Grafana come into play. Prometheus is a robust monitoring system that collects and stores time-series data, while Grafana provides rich visualization capabilities, making it easier to analyze metrics and spot issues.
In this post, we will explore how Prometheus and Grafana work together to monitor Kubernetes clusters, ensuring optimal performance and stability.
Why Use Prometheus and Grafana for Kubernetes Monitoring?
1. Prometheus - The Monitoring Powerhouse
Prometheus is widely used in Kubernetes environments due to its powerful features:
Time-series database: Efficiently stores metrics in a multi-dimensional format.
Kubernetes-native integration: Seamless discovery of pods, nodes, and services.
Powerful querying with PromQL: Enables complex queries to extract meaningful insights.
Alerting system: Supports rule-based alerts via Alertmanager.
2. Grafana - The Visualization Layer
Grafana transforms raw metrics from Prometheus into insightful dashboards:
Customizable dashboards: Tailor views to highlight key performance indicators.
Multi-source support: Can integrate data from multiple sources alongside Prometheus.
Alerting & notifications: Get notified about critical issues via various channels.
Setting Up Prometheus & Grafana in Kubernetes
1. Deploy Prometheus
Using Helm, you can install Prometheus in your Kubernetes cluster:
helm repo add prometheus-community https://prometheus-community.github.io/helm-charts
helm repo update
helm install prometheus prometheus-community/kube-prometheus-stack
This will install Prometheus, Alertmanager, and related components.
2. Deploy Grafana
Grafana is included in the kube-prometheus-stack Helm chart, but if you want to install it separately:
helm install grafana grafana/grafana
After installation, retrieve the admin password and access Grafana:
kubectl get secret --namespace default grafana -o jsonpath="{.data.admin-password}" | base64 --decode
kubectl port-forward svc/grafana 3000:80
Access Grafana at http://localhost:3000 using the retrieved credentials.
3. Configure Prometheus as a Data Source
In Grafana:
Go to Configuration > Data Sources
Select Prometheus
Enter the Prometheus service URL (e.g., http://prometheus-server.default.svc.cluster.local:9090)
Click Save & Test
4. Import Kubernetes Dashboards
Grafana provides ready-made dashboards for Kubernetes. You can import dashboards by using community templates available on Grafana Dashboards.
Key Metrics to Monitor in Kubernetes
Some essential Kubernetes metrics to track using Prometheus and Grafana include:
Node Health: CPU, memory, disk usage
Pod & Container Performance: CPU and memory usage per pod
Kubernetes API Server Health: Request latency, error rates
Networking Metrics: Traffic in/out per pod, DNS resolution times
Custom Application Metrics: Business logic performance, request rates
Setting Up Alerts
Using Prometheus Alertmanager, you can configure alerts for critical conditions:
- alert: HighCPUUsage expr: avg(rate(container_cpu_usage_seconds_total[5m])) by (pod) > 0.8 for: 5m labels: severity: critical annotations: summary: "High CPU usage detected"Alerts can be sent via email, Slack, PagerDuty, and other integrations.
Conclusion Prometheus and Grafana provide a comprehensive monitoring and visualization solution for Kubernetes clusters. With the right setup, you can gain deep insights into your cluster’s performance, detect anomalies, and ensure high availability.
By integrating Prometheus' powerful data collection with Grafana’s intuitive dashboards, teams can efficiently manage and troubleshoot Kubernetes environments. Start monitoring today and take your Kubernetes operations to the next level!
For more details www.hawkstack.com
0 notes
Text
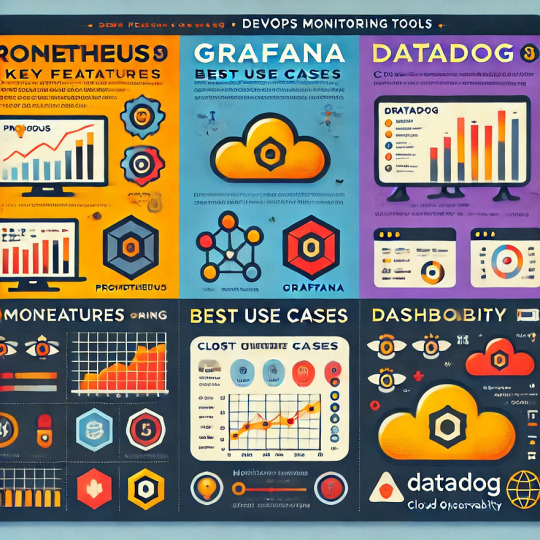
DevOps Monitoring Tools: Prometheus, Grafana, and Datadog Explained
Introduction
Monitoring is essential in DevOps for ensuring application reliability, performance, and security.
Prometheus, Grafana, and Datadog are three widely used monitoring tools.
This guide explores their features, use cases, and how they fit into a DevOps workflow.
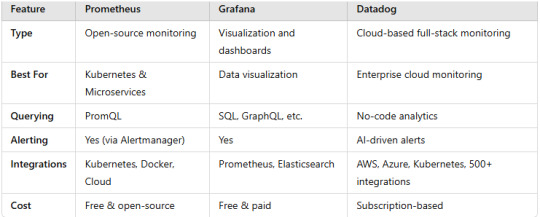
1. Prometheus: The Open-Source Monitoring System
What is Prometheus?
A time-series database and monitoring tool originally developed by SoundCloud.
Uses a pull-based model to collect metrics from applications and infrastructure.
Ideal for cloud-native and Kubernetes environments.
Key Features
Multi-dimensional data model using labels.
Powerful query language (PromQL) for data analysis.
Alerting via Alertmanager for real-time notifications.
Integration with Kubernetes, Docker, and other services.
Use Cases
Monitoring microservices and containers in Kubernetes.
Setting up alerting based on real-time application metrics.
Analyzing system performance trends over time.
2. Grafana: Visualization and Analytics
What is Grafana?
A visualization and dashboarding tool that integrates with multiple data sources, including Prometheus.
Helps in creating real-time, interactive dashboards.
Key Features
Customizable and interactive dashboards.
Supports multiple data sources (Prometheus, Elasticsearch, MySQL, etc.).
Alerting with various notification channels.
Plugins and integrations for extending functionality.
Use Cases
Visualizing time-series data from Prometheus.
Creating real-time dashboards for server and application health.
Integrating with DevOps tools for centralized monitoring.
3. Datadog: A Full-Stack Monitoring Solution
What is Datadog?
A cloud-based monitoring platform providing observability across infrastructure, applications, and logs.
Offers real-time performance monitoring, security, and analytics.
Key Features
Unified monitoring for metrics, logs, and traces.
AI-driven anomaly detection.
Cloud-native and serverless monitoring support.
Automatic integrations with AWS, Azure, Kubernetes, and more.
Use Cases
Comprehensive monitoring of cloud and hybrid environments.
Anomaly detection using machine learning.
Security and compliance monitoring for DevOps teams.
4. Choosing the Right Tool for Your DevOps Needs
Conclusion
Prometheus is best for monitoring cloud-native applications.
Grafana is ideal for visualization and dashboarding.
Datadog offers full-stack observability for enterprises.
The choice depends on your infrastructure, budget, and monitoring needs.
WEBSITE: https://www.ficusoft.in/devops-training-in-chennai/
0 notes
Text
SendQuick Cloud - Cloud Monitoring and Alert Notification System
sendQuick Cloud is the perfect cloud monitoring and alert notification system for your organisation. Our alert notification system features include: 1. Immediate Notification 2. Rooster Management 3. Public Cloud Integration 4. User Management 5. Ensure Application Availability 6. Social Messenger App Integration 7. Emails to Text (SMS) Messages 8. Integrates with Any Application

The benefits of having an alert notification system are to ensure that your system has no down-time and be in control of any critical IT issues before it becomes a problem. Your IT personnel will be kept up-to-date at any given time. You will get a complete picture of all connected data centers, security, and network operation centers. Download Brochure here: https://www.talariax.com/sendquick-cloud-brochure-download/. Discover all the more data and info look into our site.
0 notes
Text
Monitoring Systems and Services with Prometheus
In the rapidly evolving IT landscape, monitoring systems and services is no longer a luxury—it’s a necessity. Downtime can lead to revenue loss, customer dissatisfaction, and tarnished reputations. This is where Prometheus, an open-source monitoring and alerting toolkit, steps in as a game-changer.
Let’s dive into how Prometheus empowers organizations to effectively monitor their infrastructure and services, ensuring reliability and performance.
What is Prometheus?
Prometheus is a robust, open-source solution for monitoring systems, collecting metrics, and generating alerts. Originally developed at SoundCloud, it is now part of the Cloud Native Computing Foundation (CNCF) and widely adopted for monitoring cloud-native applications.
Key features of Prometheus include:
Time-series Database: Stores metrics with a timestamp for easy trend analysis.
Powerful Query Language (PromQL): Allows complex queries for data visualization and analysis.
Built-in Alerting: Enables seamless integration with tools like Alertmanager for notifications.
Service Discovery: Automatically identifies and monitors services in dynamic environments.
Why Choose Prometheus for Monitoring?
Prometheus stands out for its ability to handle dynamic, containerized environments like Kubernetes. Its lightweight architecture and focus on simplicity make it a top choice for modern IT infrastructures.
Key Benefits:
Scalability: Handles millions of metrics with ease, making it suitable for large-scale deployments.
Flexibility: Supports a wide range of exporters for monitoring different components, including databases, operating systems, and cloud services.
Custom Metrics: Developers can define and monitor application-specific metrics, providing deeper insights into performance.
Open Ecosystem: Integration with visualization tools like Grafana enhances data representation.
How Prometheus Works
Prometheus operates by pulling metrics from instrumented services at defined intervals. Here’s a breakdown of its architecture:
Data Collection: Scrapes metrics from endpoints exposed by monitored services or exporters.
Data Storage: Stores data in its local time-series database optimized for efficient querying.
Alerting: Uses PromQL to define alert conditions, notifying teams when thresholds are breached.
Visualization: Displays real-time data and trends through dashboards (often in Grafana).
Monitoring Use Cases with Prometheus
Prometheus can monitor virtually any system or application. Popular use cases include:
Kubernetes Monitoring: Track container performance, pod resource usage, and cluster health.
Application Monitoring: Collect custom metrics to understand application behavior and performance.
Database Monitoring: Use exporters for MySQL, PostgreSQL, and more to monitor query latency, resource consumption, and error rates.
Cloud Monitoring: Monitor AWS, Azure, and GCP services with cloud-specific exporters.
Best Practices for Using Prometheus
To make the most of Prometheus, consider the following best practices:
Define Clear Metrics: Focus on business-critical metrics and avoid overloading the system with unnecessary data.
Leverage Exporters: Use prebuilt exporters to simplify monitoring of common technologies.
Optimize Data Retention: Configure retention periods based on your monitoring needs to balance performance and storage.
Integrate with Grafana: Pair Prometheus with Grafana for intuitive and interactive dashboards.
Conclusion
Prometheus is a cornerstone for reliable and efficient monitoring in modern IT infrastructures. Whether you’re managing microservices in Kubernetes or monitoring traditional applications, Prometheus delivers the tools to gain real-time insights and respond proactively to issues.
If you're looking to enhance your monitoring capabilities with Prometheus, HawkStack Technologies offers expert solutions tailored to your needs. Let us help you achieve seamless monitoring and alerting for your systems and services.
Discover the power of Prometheus with HawkStack. Visit HawkStack.com today!
#redhatcourses#information technology#containerorchestration#kubernetes#docker#container#aws#linux#containersecurity#dockerswarm
0 notes