#ChartingSoftware
Explore tagged Tumblr posts


Text
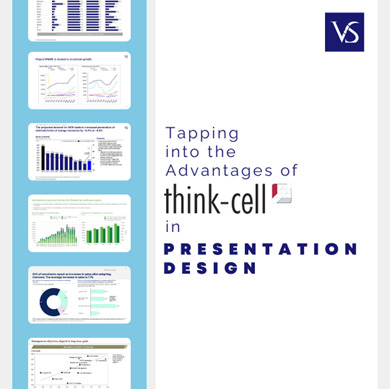
Getting Started with Think-cell: A Guide to Elevating Your Excel Presentations
Data Visualization – Charts, Graphs and Infographic designs - ThinkCell: Expert Q&A Insights
1.What are the features of think-cell in Excel?
Think-cell enhances Excel by providing automated chart creation, including Gantt charts and waterfall charts. It offers features like smart layout adjustments, easy data linking, and customizable design options. Users can quickly generate professional presentations with integrated PowerPoint functionality, enabling seamless updates of charts and data. Overall, think-cell streamlines the process of visualizing and presenting data effectively.
2. What is Thinkcell used for?
Thinkcell is a software tool primarily used for creating presentations and visualizing data in Microsoft PowerPoint. It helps users design charts, graphs, and other visual elements quickly and efficiently, streamlining the process of turning complex data into clear and impactful visuals. It's commonly utilized by consultants, analysts, and business professionals for effective communication of insights.
3. What are the advantages of think-cell?
Think-cell offers several advantages, including streamlined creation of professional presentations and charts in PowerPoint, automation of data visualization from Excel, and time-saving templates for slide design. It enhances productivity with features like automatic layout adjustments and easy updates to charts, allowing users to focus on content rather than formatting. This leads to clearer communication of complex data.
4. How to use think-cell in Excel?
To use think-cell in Excel, first install the think-cell add-in. Open Excel, then create or select your data. Access think-cell via the ribbon, where you'll find options for creating charts, such as Gantt charts or waterfall charts. Follow the prompts to insert and customize your chart based on your data. Use the think-cell features to enhance your presentation.
5. What is the think-cell?
Think-Cell is a software tool designed to enhance Microsoft PowerPoint and Excel, primarily for creating professional presentations and charts efficiently. It automates the creation of complex data visualizations, such as Gantt charts and waterfall charts, and streamlines the presentation design process, helping users save time while maintaining high-quality visual standards in their work.
Visit: VS Website See: VS Portfolio
#DataVisualization#PresentationTools#BusinessIntelligence#ChartingSoftware#ProductivityTools#ExcelFeatures
0 notes
Text
Understanding the Average True Range (ATR) Indicator: A Key Tool for Volatility Analysis
When it comes to trading and investing in financial markets, one of the most crucial factors to consider is volatility. Volatility measures the degree of price fluctuations, and it plays a significant role in determining a trader’s risk and reward potential. The Average True Range (ATR) indicator is a powerful tool that provides valuable insights into market volatility. In this blog post, we…

View On WordPress
#ATRFormula#ATRIndicator#AverageTrueRange#BreakoutTrading#ChartingSoftware#FinancialMarkets#Investing#MarketVolatility#PortfolioDiversification#RiskManagement#stoploss#TakeProfit#TechnicalAnalysis#TradingSignals#TradingStrategies#TradingTips#TradingTools#TrendFollowing#VolatilityAnalysis#VolatilityIndicator
0 notes
Video
Best charting software and real time data
0 notes