#stoploss
Text
What is scalping??
Scalping is a short-term trading strategy in the stock market where traders aim to make small, quick profits by buying and selling stocks within minutes or even seconds. The key idea behind scalping is to exploit small price movements in highly liquid stocks, making numerous trades throughout the day.
How Scalping Works
Scalping involves buying a large number of shares and selling them as soon…

View On WordPress
#DayTrading#HighLiquidity#IndianStockMarket#IntradayTrading#MarketVolatility#NSE#QuickProfits#RelianceIndustries#RiskManagement#Scalping#ShortTermTrading#StockMarketStrategy#StopLoss#TradingTips
0 notes
Text
DAX Analyse für Dienstag, 02. Juli 2024 – Erweiterung mit Elliott-Wellen-Theorie

15-Minuten-Chart
Der 15-Minuten-Chart zeigt eine Seitwärtsbewegung, wobei der RSI bei 45,88 liegt, was auf eine neutrale Marktstimmung hindeutet. Der MACD deutet auf eine leichte bärische Divergenz hin, was auf eine mögliche kurzfristige Korrektur hindeuten könnte. Die Bollinger-Bänder sind relativ eng, was auf eine bevorstehende Volatilitätsausweitung hinweisen könnte.
4-Stunden-Chart
Im 4-Stunden-Chart zeigt der RSI einen Wert von 55,95, was auf eine leicht bullische Stimmung hindeutet. Der MACD hat eine positive Divergenz, was auf eine Fortsetzung des Aufwärtstrends hinweisen könnte. Die Bollinger-Bänder sind weit auseinander, was auf eine hohe Volatilität hinweist.
1-Stunden-Chart
Der 1-Stunden-Chart zeigt eine neutrale bis leicht bullische Tendenz. Der RSI liegt bei 50,45 und der MACD zeigt eine leicht negative Divergenz, was auf eine mögliche Korrektur hinweist. Die Bollinger-Bänder deuten auf eine erhöhte Volatilität hin.
Tages-Chart
Der Tages-Chart zeigt eine Erholung vom jüngsten Tief. Der RSI liegt bei 49,31, was auf eine neutrale Stimmung hinweist. Der MACD zeigt eine positive Divergenz, was auf eine Fortsetzung des Aufwärtstrends hinweisen könnte. Die Bollinger-Bänder sind weit auseinander, was auf eine hohe Volatilität hinweist.
Wahrscheinliche nächste Bewegung
Basierend auf den Charts könnte der Markt in den nächsten Handelstagen eine leichte Aufwärtsbewegung erleben, gefolgt von möglichen Korrekturen aufgrund der Volatilität.
Ausführliche Analysen, inkl Handelszonen (Long- und Shortbereiche) TakeProfit, StopLoss Bereichen, sowie Leverageempfehlung erhalten Sie im kostenpflichtigen Analyse-Abo Dax30 (GER) unter http://lanzerath-wahnfried.it im Shop
Elliott-Wellen-Analyse für Dienstag, den 2. Juli 2024
15-Minuten-Chart
Der 15-Minuten-Chart zeigt eine mögliche Wellenstruktur, die auf eine abgeschlossene Korrekturwelle (Welle 4) hindeutet und eine bevorstehende impulsive Welle 5 vermuten lässt. Der RSI bei 45,88 unterstützt diese Annahme, da er auf eine Erholung aus einer überverkauften Zone hinweisen könnte.
4-Stunden-Chart
Im 4-Stunden-Chart könnte sich der Markt in einer impulsiven Welle 3 eines größeren Zyklus befinden. Der RSI von 55,95 und die positive Divergenz im MACD unterstützen die Annahme einer Fortsetzung des Aufwärtstrends, was typisch für Welle 3 ist. Die Bollinger-Bänder deuten auf eine erhöhte Volatilität hin, was ebenfalls typisch für diese Phase ist.
1-Stunden-Chart
Der 1-Stunden-Chart zeigt möglicherweise eine Korrekturphase, die als Welle 4 interpretiert werden könnte. Der RSI von 50,45 und die leicht negative Divergenz im MACD deuten auf eine bevorstehende Abschlusskorrektur hin, bevor die impulsive Welle 5 beginnt.
Tages-Chart
Der Tages-Chart zeigt eine größere Wellenstruktur, wobei sich der Markt möglicherweise in einer Welle C einer ABC-Korrektur befindet. Der RSI von 49,31 und die positive Divergenz im MACD deuten auf das Ende der Korrektur und den Beginn eines neuen Aufwärtsimpulses hin.
Wahrscheinliche nächste Bewegung
Basierend auf der Elliott-Wellen-Analyse könnte der Markt in den nächsten Tagen eine impulsive Aufwärtsbewegung (Welle 5) erleben, die durch eine abgeschlossene Korrekturwelle vorbereitet wurde. Kurzfristige Rücksetzer könnten als Einstiegspunkte für Long-Positionen genutzt werden.
Disclaimer: Diese Analyse dient nur zu Informationszwecken und stellt keine Finanzberatung dar. Der Handel mit Finanzinstrumenten ist mit Risiken verbunden und kann zum Verlust des gesamten investierten Kapitals führen. Bitte konsultieren Sie einen professionellen Finanzberater, bevor Sie Handelsentscheidungen treffen.
#DAX#Index#Chartanalyse#technische Analyse#Aktienmarkt#RSI#MACD#Bollinger Bänder#Trend#Unterstützung#Widerstand#Handelsstrategien#Finanzmärkte#Investitionen#Marktdynamik#Leverage#StopLoss#TakeProfit#Elliott-Wellen-Theorie
0 notes
Text
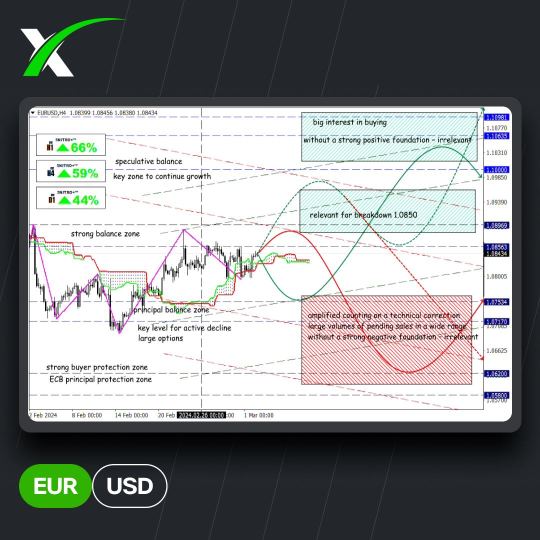
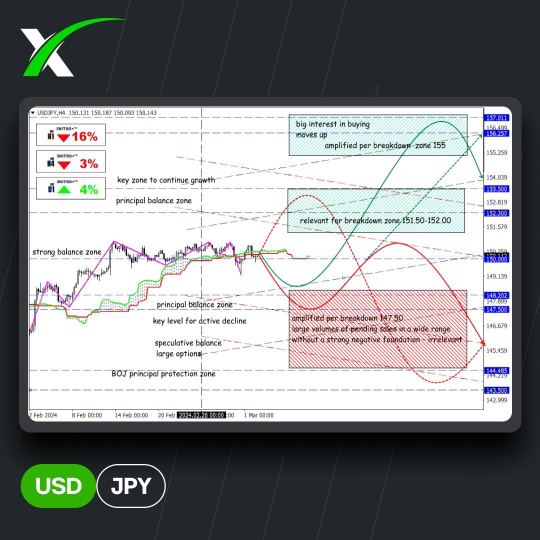
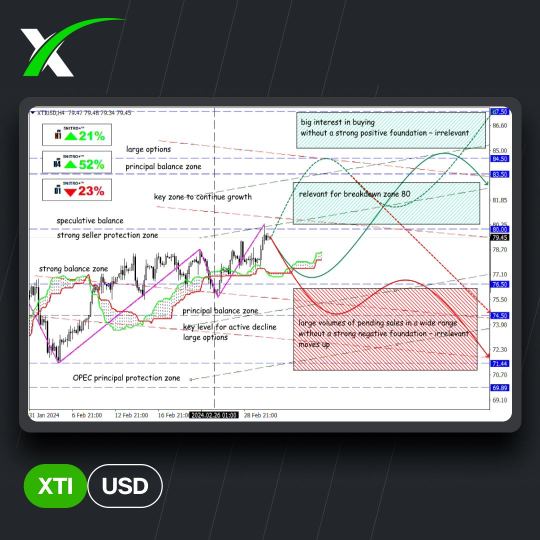
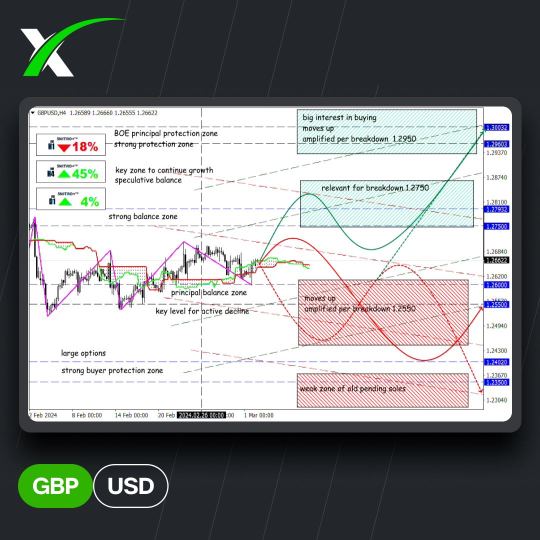
💱 Target levels and forecast for the week 04.03. – 08.03.
We are in for a challenging week.
⠀
NFP: signs of continued strength in the labor market are inevitable, and a strong economy could lead to a resurgence in inflation. The unemployment rate is expected to remain at 3.7% and wage growth is expected to slow.
⠀
Powell testimony: before NFP, it is worth listening to the semi-annual monetary policy report before the House committee on Wednesday and the Senate committee on Thursday.
⠀
ECB meeting: no change in policy is expected, investors will wait for the magic mantra to be repeated that it is too early to discuss rate cuts.
⠀
Oil prices: OPEC+ extended oil production cuts for Q2 in an attempt to prevent a global surplus and support prices. Commentary on this topic has garnered speculation on major benchmarks, but within reasonable limits.
⠀
Fans of Asian assets are advised not to miss the publication of China's CPI and PPI tomorrow morning, we are waiting for the market reaction on Monday.
⠀
Recall the fundamental events that you need to pay attention to (GMT 0 time):
⠀
Tue, 05
USD: Services, composite PMI (14:45); ISM Non-Manufacturing PMI, Employment, Prices (15:00); API Weekly Crude Oil Stock (21:30)
GBP: Services, composite, PMI (09:30)
⠀
Wed, 06
AUD: GDP, Retail Sales (00:30)
USD: ADP Nonfarm Employment Change (13:15); Fed Chair Powell Testifies; JOLTs Job Openings (15:00); Crude Oil Inventories (+Cushing) (15:30); Beige Book (19:00)
⠀
Thu, 07
AUD: Trade Balance (00:30)
CNY: Exports, Imports, Trade Balance (03:00)
EUR: ECB Monetary Policy Statement, Interest Rate Decision (13:15); Press Conference (13:45); President Lagarde Speaks (15:00)
USD: Initial Jobless Claims, Exports, Imports, Nonfarm Productivity, Trade Balance (13:30); Fed Chair Powell Testifies (15:00);
⠀
Fri, 08
USD: Nonfarm Payrolls (13:30); WASDE Report (17:00)

#EURUSD#GBPUSD#USDJPY#XTIUSD#Profits#xChief#forexsignals#MarketFocus#forexnews#Stock#StopLoss#EconomicCalendar#worldnews#forexmarket
0 notes
Text
💱 Целевые уровни и прогноз на неделю 04.03. – 08.03.
⠀
Нам предстоит сложная неделя.
⠀
NFP: признаки сохранения прочности на рынке труда неизбежны, а сильная экономика может привести к возобновлению инфляции. Ожидается, что уровень безработицы сохранится на уровне 3,7%, а рост заработной платы замедлится.
⠀
Показания Пауэлла: перед NFP стоит послушать полугодовой отчет по монетарной политике перед комитетом Палаты представителей в среду и комитетом Сената в четверг.
⠀
Заседание ЕЦБ: изменений в политике не ожидается, инвесторы будут ждать повторения волшебной мантры о том, что пока рано обсуждать снижение ставок.
⠀
Цены на нефть: ОПЕК+ продлил сокращение добычи нефти на 2 квартал, пытаясь предотвратить глобальный профицит и поддержать цены. Комментарии на эту тему гарантируют спекуляции на основных бенчмарках, но в разумных пределах.
⠀
Фанатам азиатских активов рекомендуем не пропустить публикацию CPI и PPI Китая завтра утром, реакцию рынка ждем в понедельник.
⠀
Фундаментальные события, на которые необходимо обратить внимание (время GMT 0):
⠀
Вт, 05
USD: PMI – композитный, сферы услуг (14:45); ISM для непроизводственной сферы – PMI, занятость, цены (15:00); запасы нефти по данным API (21:30)
GBP: PMI – композитный, сферы услуг, (09:30)
⠀
Ср, 06
AUD: ВВП, розничные продажи (00:30)
USD: Статистика рынка труда от ADP (13:15); выступление Пауэлла; число открытых вакансий от JOLTS (15:00); запасы сырой нефти (+ в Кушинге) (15:30); Бежевая Книга (19:00)
⠀
Чт, 07
AUD: Торговый баланс (00:30)
CNY: Экспорт, импорт, торговый баланс (03:00)
EUR: Заседание ЕЦБ, процентная ставка (13:15); пресс-конференция ЕЦБ (13:45); выступление Лагард (15:00)
USD: Число заявок на пособие по безработице, производительность труда в несельскохозяйственном секторе (13:30); выступление Пауэлла (15:00);
⠀
Пт, 08
USD: Nonfarm Payrolls (13:30); отчет WASDE (17:00)


#EURUSD#GBPUSD#USDJPY#XTIUSD#Profits#xChief#forexsignals#MarketFocus#forexnews#Stock#StopLoss#EconomicCalendar#worldnews#forexmarket
0 notes
Text


AUD/JPY - Trade 3rd - Money Growth
Full Breakdown
1 note
·
View note
Text
Understanding the Average True Range (ATR) Indicator: A Key Tool for Volatility Analysis
When it comes to trading and investing in financial markets, one of the most crucial factors to consider is volatility.
Volatility measures the degree of price fluctuations, and it plays a significant role in determining a trader’s risk and reward potential.
The Average True Range (ATR) indicator is a powerful tool that provides valuable insights into market volatility.
In this blog post, we…

View On WordPress
#ATRFormula#ATRIndicator#AverageTrueRange#BreakoutTrading#ChartingSoftware#FinancialMarkets#Investing#MarketVolatility#PortfolioDiversification#RiskManagement#stoploss#TakeProfit#TechnicalAnalysis#TradingSignals#TradingStrategies#TradingTips#TradingTools#TrendFollowing#VolatilityAnalysis#VolatilityIndicator
0 notes
Text
Giới thiệu về Stop Loss và cách đặt lệnh Stop-loss trong giao dịch forex
Thế nào là Stop Loss? Lý do gì mà Stop-Loss bị bỏ quên? Những tư tưởng sai lầm khi đặt lệnh stop loss tìm hiểu tại:
https://forexno1.net/stop-loss-la-gi/
0 notes
Text
"Take Control of Your Trading Journey with ChartBuddy: Unlocking Reliable Buy/Sell Signals and Advanced Chart Analysis."
.
.
.
Follow + Like + Share + Comment
Follow us for daily tips and setups
Turn on post notifications
Follow for more update @chartbuddyofficial
#forex#stockmarket#nifty#bitcoins#crypto#technicalanalysis#tradingcards#tradingtips#tradingmemes#forextrading#success#business#bullishtrend#chartanalysis#stoploss#traders#trademarketing#sharemarket#riskmanagement#riskanalysis#financialgrowth#startupindia#sensex#explorepage#chartbuddyofficial#investing#trader#forextrader#money#stocks
0 notes
Text
youtube
Identify trend direction quickly and get precise entry and exit points. Non-repainting and identifies best trade opportunities. Make the most out of it now.
https://www.youtube.com/watch?v=DqIsCEmx-yM
#trendpower#nonrepainting#accurateindicator#mt4indicatormt5#mt5indicator#takeprofit#stoploss#trendreversal#tradingsystem#tradersir#Youtube
0 notes
Text

In the ultrafast scalping world, every second matters. Expert Trading Panel executes trade 5X faster.
Make it yours and trade like a pro.
https://wetalktrade.com/best-mt4-expert-advisor-mt5-expert-trading-robot/
#expertadvisor#tradingpanel#mt4#mt5#forextrading#tradingtool#tradingrobot#lot#takeprofit#stoploss#experttradingpanel#wetalktrade
0 notes
Text
The Importance of Risk Management in Forex Trading

risk management: How managing risks can make or break your Forex trading success
By Amir Shayan
Forex trading is a highly volatile market where the potential for profits and losses is great. As such, it is critical for traders to implement effective risk management strategies to protect their investments. In this article, we'll explore the importance of risk management in forex trading and provide tips on how to manage risk effectively.
The Importance of Risk Management in Forex Trading
Risk management is the process of identifying potential risks and implementing strategies to minimize or mitigate those risks. In forex trading, risk management is critical because of the potential for significant losses. Without proper risk management strategies in place, traders may be exposed to losses that could wipe out their accounts.
One of the key benefits of effective risk management is that it can help traders stay in the game for the long term. By managing risk, traders can limit their losses and ensure that they have enough capital to continue trading. Additionally, effective risk management can help traders make better decisions by reducing emotional reactions to market fluctuations.
Risk management is also important for traders who use leverage. Leverage allows traders to control large positions with a small amount of capital. However, it also increases the potential for losses. Without proper risk management, traders may be exposing themselves to losses that are much larger than their initial investment.
Tips for Effective Risk Management in Forex Trading

- Use Stop Loss Orders
Stop loss orders are one of the most effective tools for managing risk in forex trading. These orders allow traders to set a specific price at which their position will be automatically closed if the market moves against them. Stop loss orders can help limit losses and prevent traders from losing more money than they can afford.
- Set Realistic Targets
Setting realistic targets is an important part of risk management in forex trading. Traders should set profit targets based on their trading strategy and risk tolerance. It's important to remember that forex trading is a long-term game, and traders should not expect to make large profits overnight.
- Use Proper Position Sizing
Proper position sizing is critical for managing risk in forex trading. Traders should never risk more than they can afford to lose. One common rule of thumb is to risk no more than 1-2% of your account balance on any given trade.
- Avoid Overtrading
Overtrading is a common mistake that many forex traders make. This occurs when traders open too many positions at once, which can lead to increased risk and potential losses. Traders should stick to their trading plan and avoid the temptation to open too many positions at once.
- Diversify Your Portfolio
Diversification is an important part of risk management in forex trading. Traders should diversify their portfolios by trading different currency pairs and using different trading strategies. This can help reduce the risk of losses in one particular area.
- Keep Emotions in Check
Emotions can be a major factor in forex trading, and they can lead to poor decision making. Traders should keep their emotions in check and avoid making impulsive decisions based on fear or greed. It's important to stick to your trading plan and avoid making emotional decisions that could lead to losses.
Conclusion
Effective risk management is critical for success in forex trading. Traders should implement strategies such as stop loss orders, proper position sizing, and diversification to minimize their risk exposure. Additionally, traders should keep their emotions in check and avoid overtrading to ensure that they have enough capital to continue trading in the long term. By following these tips, traders can manage their risk effectively and increase their chances of success in the forex market.
Read the full article
#Currencyexchange#financialmarkets#Forextrading#investment#MoneyManagement#Riskmanagement#stoploss#tradingplan#Tradingpsychology#tradingstrategies
0 notes
Text
What is Stop Loss in the Military? – The Answer and More
In this article, we will explore the concept of stop loss in the military and the various perspectives surrounding this issue.
Read more: https://www.safecallnow.org/stop-loss-in-the-military/
0 notes
Text
SL là gì? Hướng dẫn đặt SL cho người mới
SL là viết tắt của Stop Loss, là lệnh dừng lỗ. Đây là lệnh cắt lỗ tự động được trader cài sẵn cho giao dịch. Nhà đầu tư sau khi nghiên cứu và phân tích thị trường sẽ chọn một mức giá cụ thể có thể gồng lỗ được nhiều nhất để đặt lệnh Stop Loss.
Xem tiếp: https://vnforex.com/sl-la-gi-huong-dan-dat-sl-cho-nguoi-moi-giao-dich/
0 notes
Text
#StocksToBuy#StockMarket#finance#krishafinance#bestdemataccount#freedemataccount#mutualfunds#sharemarket#stockbroker#nifty#NSE#BSE#StockMarketindia#learn#fishhookpattern#buy#sell#stoploss
0 notes
Photo

#Stoploss. Time for Yoga. :)))) https://www.instagram.com/p/CkRztkuyLHL/?igshid=NGJjMDIxMWI=
0 notes
Last Seen Blogs