#Data Analysis Tools
Explore tagged Tumblr posts
Visit Tumblr Blog
Explore Tumblr blogs with no restrictions, modern design and the best experience.
Last Seen Tumblr Blogs


Fun Fact
The average Tumblr user visits about 67 pages every month.
Text

Our data engineering solutions are designed to grow with your business, ensuring your systems can efficiently handle increasing data volumes, and support expansion without compromising performance or reliability. We integrate data from multiple sources, providing a unified view that makes it easier to manage, analyze, and leverage, improving decision-making, strategic planning, and overall business outcomes.
#data engineering services#data analytics services#data analysis tools#data analysis software#data engineering#data analysis
0 notes
Text
Per-Capita Income and Life Expectancy : W3 Data Analysis Tools
For the third week’s assignment of Data Analysis Tool on Coursera, we would continue to be working with GapMinder's dataset which contains statistics in the social, economic, and environmental development variable at local, national, and global levels
We would be studying the effect of Income per Person of a County on prevalent rates of life-expectancy. Since both the explanatory variable (Per-Capita Income) and the response variable are quantitative we'll calculate the Pearson Correlation Coefficient to analyze the strength of correlation between the variables.
The Correlation Analysis between the two variables gives :

The Correlation Coefficient is 0.60 with a very low p-value << 0.0001, which indicates a considerably strong and significant relation between the Per-Capita Income and the Life Expectancy of individuals. A positive Correlation Coefficient indicates that the Life-Expectancy increases with the Per-Capita Income of a Country.

However, looking at the scatter-plot between the two variables, we see that a sharp increase in the life expectancy is seen only at the very low end of the per-capita income spectrum. Beyond a per-capita income of 10000, the life-expectancy almost flattens out. So, we need to understand the strong relationship between the variables together the scatter-plot.
0 notes
Text

The image features an individual from behind, focusing on a computer screen displaying lines of code, which signifies the hands-on experience provided by the DY Patil Online MBA program. The backdrop is a plain wall that ensures the viewer’s attention is drawn to the subject matter
#DY Patil Distance MBA#Data Analysis Tools#Data Analysis Techniques#Distance Learning#Business Intelligence
0 notes
Text
0 notes
Text
What Are the Benefits of Using Data Analysis Tools?

In today's data-driven world, the ability to analyze data effectively is crucial for businesses and organizations of all sizes. Data analysis tools have revolutionized the way companies approach decision-making, strategy formulation, and operational efficiency. These tools enable the extraction of meaningful insights from vast amounts of data, driving informed decisions and fostering a competitive edge. This comprehensive overview explores the numerous benefits of using data analysis tools.
Enhanced Decision-Making
One of the most significant benefits of data analysis tools is their ability to enhance decision-making processes. By providing accurate, real-time insights into business operations, these tools enable leaders to make informed decisions based on concrete data rather than intuition or guesswork.
Data-Driven Decisions: Data analysis tools help in identifying trends, patterns, and correlations within data sets, offering a solid foundation for making strategic decisions.
Reduced Uncertainty: By analyzing historical data, businesses can forecast future trends and outcomes with greater accuracy, reducing the uncertainty inherent in decision-making.
Improved Operational Efficiency
Data analysis tools streamline various business processes, leading to improved operational efficiency. They automate routine tasks and provide insights that help optimize workflows and resource allocation.
Automation of Tasks: Many data analysis tools can automate data collection, processing, and reporting, saving time and reducing the potential for human error.
Resource Optimization: By identifying inefficiencies and bottlenecks in processes, these tools help businesses optimize their resource allocation and improve overall productivity.
Enhanced Customer Insights
Understanding customer behavior and preferences is crucial for any business aiming to enhance customer satisfaction and loyalty. Data analysis tools provide deep insights into customer interactions, preferences, and feedback.
Customer Segmentation: These tools can segment customers based on various criteria such as demographics, purchasing behavior, and engagement levels, allowing for targeted marketing strategies.
Personalized Experiences: By analyzing customer data, businesses can personalize their offerings and communication, leading to improved customer experiences and higher retention rates.
Competitive Advantage
In a competitive marketplace, the ability to quickly adapt to changes and capitalize on emerging opportunities is vital. Data analysis tools provide businesses with the insights needed to stay ahead of the competition.
Market Trends: By analyzing market data, businesses can identify emerging trends and adjust their strategies accordingly.
Competitor Analysis: These tools enable companies to monitor their competitors’ activities and performance, allowing them to identify strengths and weaknesses and develop more effective strategies.
Financial Performance
Data analysis tools play a crucial role in enhancing a company's financial performance. They provide detailed insights into financial data, helping businesses manage their finances more effectively.
Cost Reduction: By identifying areas of waste and inefficiency, businesses can implement cost-saving measures.
Revenue Growth: These tools help in identifying new revenue opportunities and optimizing pricing strategies based on data-driven insights.
Risk Management
Risk management is a critical aspect of any business, and data analysis tools can significantly enhance this process. By providing predictive insights and identifying potential risks, these tools help businesses mitigate and manage risks more effectively.
Predictive Analytics: Data analysis tools can predict potential risks by analyzing historical data and identifying patterns that precede adverse events.
Proactive Measures: By identifying potential risks early, businesses can take proactive measures to mitigate them, reducing their impact on operations.
Enhanced Research and Development
For businesses involved in research and development (R&D), data analysis tools offer numerous benefits. They facilitate the analysis of large datasets, enabling more effective research and faster innovation.
Accelerated Innovation: By analyzing data from various sources, businesses can identify opportunities for innovation and bring new products or services to market more quickly.
Informed R&D Decisions: These tools provide insights into the effectiveness of different R&D initiatives, helping businesses allocate resources more effectively.
Better Supply Chain Management
Effective supply chain management is crucial for operational efficiency and customer satisfaction. Data analysis tools provide real-time insights into supply chain operations, helping businesses optimize their supply chain management.
Inventory Management: These tools help businesses manage inventory more effectively by predicting demand and optimizing stock levels.
Supplier Performance: Data analysis tools can monitor supplier performance, helping businesses identify reliable suppliers and negotiate better terms.
Compliance and Reporting
In many industries, regulatory compliance is a critical concern. Data analysis tools help businesses ensure compliance with regulations by providing detailed and accurate reports.
Regulatory Compliance: These tools can monitor compliance with industry regulations, helping businesses avoid costly fines and penalties.
Accurate Reporting: By automating the reporting process, data analysis tools ensure that reports are accurate and delivered on time.
Employee Performance
Data analysis tools can also enhance employee performance by providing insights into productivity and identifying areas for improvement.
Performance Monitoring: These tools enable businesses to monitor employee performance and identify high-performing individuals and teams.
Training and Development: By identifying skill gaps and training needs, data analysis tools help businesses develop targeted training programs that enhance employee performance.
Conclusion
Data analysis tools are indispensable for modern businesses seeking to thrive in a data-driven world. They provide a multitude of benefits, including enhanced decision-making, improved operational efficiency, deeper customer insights, competitive advantage, better financial performance, and more effective risk management. By leveraging these tools, businesses can not only optimize their current operations but also position themselves for sustained growth and success. Investing in data analysis tools is not just about keeping up with the competition; it’s about setting your business apart and driving it forward in an increasingly complex and competitive landscape.
0 notes
Text
Transforming Lab Operations: Innovations in Laboratory Management

In the dynamic landscape of laboratory management, staying at the forefront of innovation is essential for optimizing operations and delivering accurate results efficiently. Let's explore some groundbreaking advancements in laboratory management, including sample tracking, quality control, efficiency solutions, data analysis tools, and automation tech, that are revolutionizing the way labs operate.
Sample tracking is a critical aspect of laboratory management, ensuring the traceability and integrity of samples throughout the testing process. Advanced sample tracking systems utilize barcode or RFID technology to monitor sample movement, from collection to analysis, minimizing errors and enhancing workflow efficiency. By implementing robust sample tracking solutions, labs can streamline processes, improve turnaround times, and maintain compliance with regulatory standards.
Quality control measures are paramount in laboratory management to uphold the accuracy and reliability of test results. Rigorous quality control protocols, including internal and external quality assurance programs, help labs identify and rectify errors promptly, ensuring the highest standards of accuracy and precision. Leveraging quality control software and analytical tools enables labs to monitor performance metrics in real-time, identify trends, and implement corrective actions proactively.
To enhance operational efficiency, labs are increasingly adopting efficiency solutions that automate routine tasks and streamline workflows. From automated specimen processing and result reporting to electronic documentation and workflow optimization tools, these solutions reduce manual labor, minimize errors, and maximize throughput. By optimizing resource allocation and improving turnaround times, efficiency solutions empower labs to handle increasing sample volumes and meet growing demand effectively.

Data analysis plays a crucial role in laboratory management, enabling labs to derive valuable insights from vast amounts of test data. Advanced data analysis tools, including statistical software, machine learning algorithms, and predictive analytics models, help labs uncover trends, identify outliers, and improve decision-making. By harnessing the power of data analysis, labs can optimize testing protocols, identify areas for improvement, and enhance overall performance.
Automation technology is transforming laboratory management by automating repetitive tasks and streamlining complex workflows. From robotic sample handling systems and automated analyzers to intelligent laboratory information systems (LIS), automation tech enhances efficiency, accuracy, and scalability. By automating manual processes, labs can reduce human error, increase productivity, and focus on high-value tasks, such as data interpretation and result validation.
In conclusion, innovations in laboratory management, including sample tracking, quality control, efficiency solutions, data analysis tools, and automation tech, are driving significant improvements in lab operations and performance. By embracing these advancements, labs can enhance accuracy, efficiency, and reliability, ultimately delivering better outcomes for patients and healthcare providers.
0 notes
Text
Comprehensive Guide to 7 Predictive Analytics Tools and Software
Introduction to Predictive Analytics Definition and importance in today’s business landscape Predictive Analytics Tools harness the power of historical data, statistical modeling, and machine learning algorithms to forecast future events or outcomes. These tools utilize the vast amount of data available to businesses, enabling them to predict trends, identify patterns, and make informed…

View On WordPress
#Business Forecasting#Data Analysis Tools#Machine Learning Applications#Predictive Analytics#Strategic Decision Making
0 notes
Text
Revealing Unseen Insights: An In-Depth Manual on Data Analytics Tools and Techniques
Data analytics is the process of collecting, cleaning, analyzing, and interpreting data to gain insights that can be used to make better decisions. It is a powerful tool that can be used to improve businesses, organizations, and even our own lives.

There are many different data analytics tools and techniques available, each with its own strengths and weaknesses. Some of the most common tools include:
Data visualization: This involves creating charts, graphs, and other visual representations of data to make it easier to understand.
Statistical analysis: This involves using statistical methods to identify patterns and trends in data.
Machine learning: This involves using algorithms to learn from data and make predictions.
Natural language processing: This involves using algorithms to analyze text data.
The best data analytics tool or technique for a particular situation will depend on the specific goals of the analysis. For example, if you are trying to identify patterns in customer behavior, you might use data visualization or statistical analysis. If you are trying to build a model to predict future sales, you might use machine learning.
In this blog post, we will provide an in-depth overview of the most common data analytics tools and techniques. We will also discuss the steps involved in conducting a data analytics project, from data collection to interpretation.
The Steps of a Data Analytics Project
A data analytics project typically follows these steps:
Define the problem. What are you trying to achieve with your data analysis? What are your specific goals?
Collect the data. This may involve gathering data from internal sources, such as customer records or sales data, or from external sources, such as social media data or government datasets.
Clean the data. This involves removing any errors or inconsistencies in the data.
Analyze the data. This is where you use the data analytics tools and techniques to identify patterns and trends.
Interpret the results. This involves making sense of the findings and drawing conclusions.
Communicate the results. This involves sharing your findings with the stakeholders who need to know.
Data Analytics Tools and Techniques
Here is a brief overview of some of the most common data analytics tools and techniques:
Data visualization: This involves creating charts, graphs, and other visual representations of data to make it easier to understand. Some popular data visualization tools include Tableau, QlikView, and Microsoft Power BI.
Statistical analysis: This involves using statistical methods to identify patterns and trends in data. Some popular statistical analysis tools include SPSS, SAS, and R.
Machine learning: This involves using algorithms to learn from data and make predictions. Some popular machine learning tools include TensorFlow, scikit-learn, and Keras.
Natural language processing: This involves using algorithms to analyze text data. Some popular natural language processing tools include spaCy, NLTK, and Stanford CoreNLP.
Conclusion
Data analytics is a powerful tool that can be used to reveal unseen insights. By understanding the different tools and techniques available, you can choose the right ones for your specific needs. And by following the steps involved in a data analytics project, you can ensure that your analysis is successful.
I hope this blog post has been helpful. If you have any questions, please feel free to leave a comment below.
#Data analysis tools#Business data insights#Big data analytics#Data mining solutions#Data analytics consulting#Data analytics services
0 notes
Text
How DeepSeek AI Revolutionizes Data Analysis
1. Introduction: The Data Analysis Crisis and AI’s Role2. What Is DeepSeek AI?3. Key Features of DeepSeek AI for Data Analysis4. How DeepSeek AI Outperforms Traditional Tools5. Real-World Applications Across Industries6. Step-by-Step: Implementing DeepSeek AI in Your Workflow7. FAQs About DeepSeek AI8. Conclusion 1. Introduction: The Data Analysis Crisis and AI’s Role Businesses today generate…
#AI automation trends#AI data analysis#AI for finance#AI in healthcare#AI-driven business intelligence#big data solutions#business intelligence trends#data-driven decisions#DeepSeek AI#ethical AI#ethical AI compliance#Future of AI#generative AI tools#machine learning applications#predictive modeling 2024#real-time analytics#retail AI optimization
3 notes
·
View notes
Text
Alcoholism and Major Lifetime Depression : W2 Data Analysis Tools
For the second week’s assignment of Data Analysis Tool on Coursera, we would continue to be working with NESARC’s dataset which contains information on alcohol and drug use and disorders, related risk factors, and associated physical and mental disabilities.
We would be studying the effect of Major Depression in the life of an individual on their alcohol consuming status. We'd be performing an Chi-Square test of Independence test between a categorical explanatory variable (alcohol drinking status ), and a categorical response variable (presence of major lifetime depression). We'll also be restricting the test to include only adults of age between 18-40.
The explanatory variable has 3 groups
Current Drinker
Ex Drinker
Lifetime Abstainer
The response variable has 2 groups.
0. No Lifetime Depression
1. Has Lifetime Depression
The null hypothesis is that there is no association between the drinking status of an individual and the presence of Major Lifetime Depression
Running a Chi-Square Test of Independence between the data for two variables, we get :
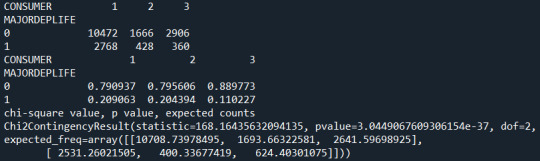
In the first table, the table of counts of the response variable by the explanatory variable, we see the number of individual under each consumer group (1,2, or 3), who do and do not have major lifetime depression. That is, among current drinkers, 10472 individuals do not have a Lifetime depression, while 2768 individuals do suffer from depression.
The next table presents the same data in percentages of individuals with or without lifetime depression under each alcohol consumer group. So 79% of current drinkers do not have major lifetime depression, while 21% do.
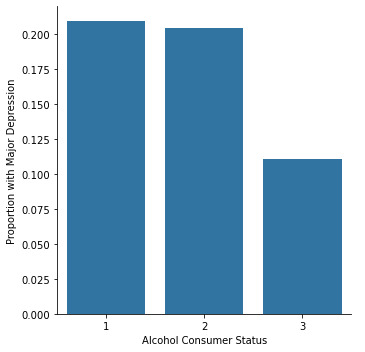
The graph below also conveys the same, just for the proportion of individuals under each alcohol consumer group who have Major Lifetime Depression. So, 21% of current drinkers and 20% of Ex-Drinkers have Major Lifetime Depression, while only 11 % of Lifetime abstainers have suffer from depression.
The Chi-Square Value from the test is large, about 168, while the p-value is very small (<< 0.0001), which tells us that the presence of Major Lifetime Depression and the Alcohol-Consuming Status of an individual are significantly associated.
The explanatory variable has 3 categories, and by observing the plot we can infer say that the Life-Time Abstainers had a significantly lower rate of life-time depression diagnosis compared to the current-drinkers and ex-drinkers. To quantitatively verify the same, and to avoid a type 1 error, we'll use the Bonferroni Adjustment Posthoc test.
Since we need to make only three pairs of comparisons, we would evaluate significance at the adjusted p-value of 0.017 (0.05/3).
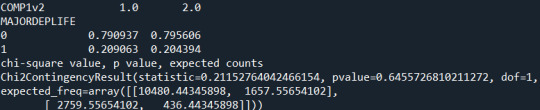
Now, running a chi-square test between just the group 1 and 2 of Alcohol-Consumer Status we get a low Chi-Square value of 0.211 and a large p-value 0.64 >> 0.017. We hence will accept the null-hypothesis that there is no significant difference in the rates of Major Lifetime Depression among current-drinkers and ex-drinkers.

Running a chi-square test between just the group 1 and 3 of Alcohol-Consumer Status we get a high Chi-Square value of 165 and a low p-value << 0.017. We hence will reject the null-hypothesis that there is no significant difference in the rates of Major Lifetime Depression among current-drinkers and life-time abstainers.

Finally, using a chi-square test between just the group 2 and 3 of Alcohol-Consumer Status we get a high Chi-Square value of 89 and a low p-value << 0.017. We hence will once again reject the null-hypothesis that there is no significant difference in the rates of Major Lifetime Depression among Ex-Drinkers and life-time abstainers.
Thus, using the Bonferroni Adjustment, we can conclude that there is a significant difference in the occurrence of major life-time depression between Lifetime alcohol Abstainers as compared to current-drinkers or ex-drinkers. However, the rate of depression is not significantly different between current-drinkers and ex-drinkers.
Python Code
@author: DKalaikadal159607 """
import pandas import numpy import scipy.stats import seaborn import matplotlib.pyplot as plt
data = pandas.read_csv('nesarc.csv', low_memory=False)
#new code setting variables you will be working with to numeric
data['MAJORDEPLIFE'] = pandas.to_numeric(data['MAJORDEPLIFE'], errors='coerce') data['CONSUMER'] = pandas.to_numeric(data['CONSUMER'], errors='coerce') data['AGE'] = pandas.to_numeric(data['AGE'], errors='coerce')
#subset data to young adults age 18 to 40
sub1=data[(data['AGE']>=18) & (data['AGE']<=40)]
#make a copy of my new subsetted data
sub2 = sub1.copy()
#contingency table of observed counts
ct1=pandas.crosstab(sub2['MAJORDEPLIFE'], sub2['CONSUMER']) print (ct1)
colsum=ct1.sum(axis=0) colpct=ct1/colsum print(colpct)
print ('chi-square value, p value, expected counts') cs1= scipy.stats.chi2_contingency(ct1) print (cs1)
seaborn.catplot(x="CONSUMER", y="MAJORDEPLIFE", data=sub2, kind="bar", ci=None) plt.xlabel('Alcohol Consumer Status') plt.ylabel('Proportion with Major Depression')
recode2 = {1: 1, 2: 2} sub2['COMP1v2']= sub2['CONSUMER'].map(recode2)
#contingency table of observed counts
ct2=pandas.crosstab(sub2['MAJORDEPLIFE'], sub2['COMP1v2']) print (ct2)
#column percentages
colsum=ct2.sum(axis=0) colpct=ct2/colsum print(colpct)
print ('chi-square value, p value, expected counts') cs2= scipy.stats.chi2_contingency(ct2) print (cs2)
recode3 = {1: 1, 3:3 } sub2['COMP1v3']= sub2['CONSUMER'].map(recode3)
#contingency table of observed counts
ct3=pandas.crosstab(sub2['MAJORDEPLIFE'], sub2['COMP1v3']) print (ct3)
#column percentages
colsum=ct3.sum(axis=0) colpct=ct3/colsum print(colpct)
print ('chi-square value, p value, expected counts') cs3= scipy.stats.chi2_contingency(ct3) print (cs3)
recode4 = {2: 2, 3: 3} sub2['COMP2v3']= sub2['CONSUMER'].map(recode4)
#contingency table of observed counts
ct4=pandas.crosstab(sub2['MAJORDEPLIFE'], sub2['COMP2v3']) print (ct4)
#column percentages
colsum=ct4.sum(axis=0) colpct=ct4/colsum print(colpct)
print ('chi-square value, p value, expected counts') cs4= scipy.stats.chi2_contingency(ct4) print (cs4)
0 notes
Text
Data Analysis Tools and Techniques in DY Patil Distance MBA
Business decisions are driven by data analysis All those who are pursuing their distance MBA from top distance MBA colleges including the DY Patil Distance Learning MBA program must learn how to use some of these data analysis tools and techniques. In the blog below, we explore what Data Analysis is as a subject per se and how to practically learn about it through tools similar covered under the…
#Business Intelligence#Data Analysis Techniques#Data Analysis Tools#Data-Driven Decisions#Distance Learning#MBA Curriculum#MBA Skills#Online MBA Program.#Statistical Methods
0 notes
Text
Salisbury Autistic Care - The Sensory Haven Future Homes for Autistic People
Salisbury Autistic Care: Creating Inclusive Communities for Individuals on the Autism Spectrum is putting its best foot forward by designing homes best suited for autistic individuals. Efforts are made to provide an environment where those on the autism spectrum can thrive and feel at ease.
In this discussion, we'll explore how Salisbury's real estate sector is designing homes with the latest innovations that prioritize the safety concerns of these individuals.
Let's discover together how the latest innovative homes are reshaping the landscape of inclusive living.

Smart Home Technology: Real estate is focusing on installing homes with smart home devices that can be controlled remotely or automated to perform tasks autonomously. It includes devices like voice-activated assistants (like Amazon Alexa or Google Home), smart thermostats, lighting systems, and security cameras that can greatly improve the autonomy and comfort of individuals with autism. These technologies can be programmed to adjust environmental factors according to the individual's preferences, providing a sense of control and reducing sensory overload.
Communication Apps and Devices: Many autistic people face trouble in communication. However, integrating communication apps and devices within the property can facilitate effective communication. It will help them by assisting in conveying their message to their caregivers. These may include augmentative and alternative communication (AAC) apps, picture exchange communication systems (PECS), or specialized devices that support speech output.
Safety and Monitoring Solutions: Autistic individuals are not much aware of their safety in the surrounding environment. As a result, they may unintentionally engage in behaviors that could put their well-being at risk. Technology can play a crucial role in ensuring their safety. GPS tracking devices, door alarms, and wearable sensors can alert caregivers if a resident leaves the property or enters restricted areas, allowing for timely intervention. Additionally, smart locks and security systems can enhance overall safety within the property.
Sensory Regulation Tools: Many individuals with autism are sensitive to sensory stimuli. The real estate must focus on designing calming sensory rooms with soft lighting, comfortable seating, tactile objects, soothing music or sounds, and visual projections. Interactive projections or immersive virtual reality experiences can provide engaging and customizable sensory experiences, allowing individuals with autism to explore different sensory inputs in a controlled and therapeutic environment.
Data Collection and Analysis: Homes installed with smart sensors can help in tracking daily behavior patterns like sleep patterns, activity levels, or emotional states, providing valuable insights about the individual. This information can be used to create personalized care plans and interventions.
Educational and Therapeutic Resources: Integrating educational and therapeutic resources within autism care properties empowers residents to engage in meaningful activities and skill-building exercises that support their development and enhance their quality of life. Smart home technology helps them to have access to educational and therapeutic sessions that promote learning, growth, and self-confidence for individuals with autism.
Conclusion
Through these advancements, Salisbury Autistic Care — Most Desirable Areas to Live in is not only addressing the unique needs and challenges faced by autistic individuals but also trying to create surroundings where they can feel safe and comfortable. By prioritizing safety, communication, sensory comfort, and personalized support, these homes are reshaping the landscape of inclusive living and setting a new standard for the integration of technology and compassion in real estate development.
#Educational and Therapeutic Resources#Data Collection and Analysis#Sensory Regulation Tools#Safety and Monitoring Solutions#Smart Home Technology#Future Homes#Sensory Haven:#Salisbury Autistic Care
8 notes
·
View notes
Text
Correspondence analysis is a statistical technique used to analyze the associations between categorical variables in large datasets. It aims to uncover patterns and relationships between the categories of different variables by visualizing them in a low-dimensional space, typically a two-dimensional plot.
This method is particularly useful when dealing with categorical data, such as survey responses, where variables are not numerical but represent different categories or levels. Correspondence analysis transforms the categorical data into a graphical representation, allowing for easier interpretation of relationships between variables.
#market research#correspondance analysis in marketing research#market research analyst#market research companies in india#market research tools#data analysis in research
2 notes
·
View notes
Text
ughhhhhhhhhhhhhh
#learning to use data analysis tools that suck ass lmao#why am i doing this Like This when i could simply do it in 20 seconds in sql
2 notes
·
View notes
Text
i hate data storage
#my 90+ page google doc of baby sitters club notes and analysis somehow got deleted and they can’t recover it bc it’s been over 25 days#so basically i have lost the majority of years’ worth of my recorded thoughts on my number one thing to ever exist#it took me a year and a half to read all those books when i was reading 5 a week every week#there’s no way i’m ever going to be able to recreate all of that information#like. i don’t even know what to fucking do that document was everything#and like yes part of it is on me for not adequately backing it up but why can google store all my personal data in perpetuity forever but#not recover a document that was accidentally deleted 2 months ago#useless fucking company and useless fucking recovery tool if it only goes back 25 days!#anyways i’m literally fucking devastated.
4 notes
·
View notes