#DiseaseMapping
Explore tagged Tumblr posts
Visit Tumblr Blog
Explore Tumblr blogs with no restrictions, modern design and the best experience.
Last Seen Tumblr Blogs


Fun Fact
130K people were victims of a chain letter scam that affected Tumblr in May 2011.
Text
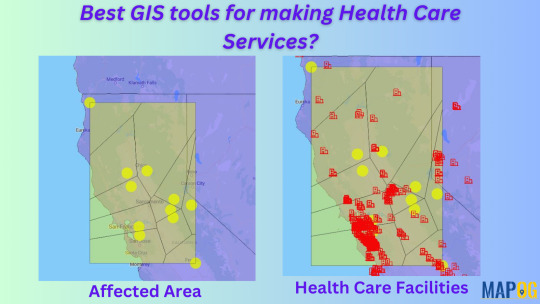
How to use GIS in Disease spreading?
Why is it important to use GIS for Disease mapping?
Mapping disease outbreaks provides critical opportunities to leverage Geographic Information Systems (GIS) for pandemic response, analysis, and decision-making.
Steps to Add GIS Data to an Online Map
Choose an Online Mapping Tool
Choose an online platform to perform the basic needs for creating maps, adding layers and data visualization.
Online mapping platforms are powerful tools that combine geographic data, visualization, and interactivity to solve real-world problems across industries.
There are user-friendly websites for beginners as well as professional users like MAPOG. Where it provides different types of build-in tools.
Prepare Your Data
To prepare GIS data, download the required data in csv, kml. Shapefile or geojason format.
Organize your data layers based on their thematic importance, like roads, administrative boundaries, or climate zones.
Most platforms provide an option to upload or import GIS data directly. Ensure the spatial attributes are preserved during upload.
3. Steps for preparing mapping
By applying these simple steps in MAPOG one can easily make disease spreading maps.
To upload boundary ‘add upload’ > upload vector file to add area of interest > select the vector file > open > upload.
Upload csv data that has latitude and longitude > upload csv file > open > publish.
To change the symbols and color click > ‘Action’ > edit feature > change according to preference for both the layers.
Steps to add polygon in the disease affected area using “point to polygon”
By applying “points to polygon”, it shows the area that is affected.
Click “processing tool” > select “point to polygon” > select the point layer data > click “convert”.
Click the “action” button > rename > style editor > change the symbols and colours.

Conclusion
The purpose of using online map making is to research and make maps affordable, user-friendly, its simplicity and collaborative features make it ideal for individuals that need quick sharable maps without heavy investment in training or setups. Finally, future trends like AI integration mapping show the evolving nature of these platforms.
3 notes
·
View notes
Link
OKAY GUYS, cool resource time. This is diseasemaps.org. You type in your chronic/rare disease and it connects you to other people with the disease worldwide, you can share stories, get questions answered, and it links you up to researchers and organizations for your disease.
Especially if you feel like you’re alone with your condition, this could be great resource to get connected!
226 notes
·
View notes
Text

I went down a google rabbit hole while doing some research for Bone Dysplasia/Larsen Syndrome, ended up on Diseasemaps, got a little side tracked, and, oh my *laughs into the night*
Person: So what's your health like?"
Me: 5.
Person: 5? What does that mean?
Me: 5
Person: okay, like, out of what? 10? 100?
Me: *level of dissonance, finds it too much of a humourous relief to say anything else*
Me: ..........it's a 5
Person: what is even wrong with you?
Me: 5
(You can take the test hither)
[Image description: A test from disease maps to compare health to the average population and averages for other conditions. general population 66.54. HIV 47.80. Hip replacement 58.64. Lung cancer 43.28. This person's score is 5. Total score (from entire test) is 0 to 3,600. This person scored 495]
79 notes
·
View notes